Effectiveness of a Total Meal Replacement Program
(OPTIFAST Program) on Weight Loss: Results from the
OPTIWIN Study
Jamy D. Ard
1, Kristina H. Lewis
1, Amy Rothberg
2, Anthony Auriemma
3, Sally L. Coburn
4, Sarah S. Cohen
5,
Judy Loper
6, Laura Matarese
7, Walter J. Pories
7, and Seletha Periman
8Objective:
The aim of this study was to test the effectiveness of the OPTIFAST program (OP), a total meal
replacement dietary intervention, compared with a food-based (FB) dietary plan for weight loss.
Methods:
Participants with BMI 30 to 55 kg/m
2, age 18 to 70 years old, were randomized to OP or FB
die-tary and lifestyle interventions for 26 weeks, followed by a weight-maintenance phase. Outcomes were
percent change in body weight (%WL) from baseline to weeks 26 and 52, associated changes in body
com-position (using dual energy x-ray absorptiometry), and adverse events. Primary analysis used
repeated-measures multivariable linear mixed models to compare outcomes between groups in a modified
intention-to-treat fashion (mITT).
Results:
A total of 273 participants (83% of randomized; 135 OP, 138 FB) made up the mITT population.
Mean age was 47.1 ± 11.2 years; 82% were female and 71% non-Hispanic white. Baseline BMI was 38.8 ± 5.9
kg/m
2. At 26 weeks, OP %WL was 12.4% ± 0.6% versus 6.0% ± 0.6% in FB (
P
< 0.001). At 52 weeks, OP
%WL was 10.5% ± 0.6% versus 5.5% ± 0.6% in FB (
P
< 0.001). Fat mass loss was greater for OP; lean mass
loss was proportional to total weight loss. There was no difference in serious adverse event rates between
groups.
Conclusions:
Compared with an FB approach, OP was more effective with greater sustained weight loss.
Obesity (2019) 27, 22-29. doi:10.1002/oby.22303Introduction
Weight loss requires an energy deficit, usually achieved by reducing the volume of food consumed through modifying portions, reducing certain macronutrients (e.g., lower fat or lower carbohydrate intake), or eliminating various food groups. However, irrespective of the strategy employed to modify intake, weight loss at 6 to 12 months with food-based (FB) diets averages 4% to 8% of initial body weight (1-3). Meal replacements (MR), typically formulated as prepackaged shakes or bars, are another option for reducing energy intake (4,5). They help promote weight loss by eliminating choices, controlling portions, and providing satiation at lower calorie intakes (6,7). Total meal replace-ment (TMR), or the use of MR as the sole source of daily nutrition, has been studied as one option to enhance behavioral weight loss. Several retrospective and prospective clinical trials through the 1990s showed significant initial weight loss with the use of very-low-calorie diets
(VLCD), typically providing 400 to 600 kcal/d using TMR. However, the 1998 expert obesity panel convened by the National Heart, Lung, and Blood Institute did not recommend the use of VLCDs because of concerns that long-term weight losses, especially after cessation of the VLCD, were not significantly different from those achieved with stan-dard low-calorie diets (8). At the time of the systematic review for the 2013 American Heart Association/American College of Cardiology/ TOS Obesity Guidelines, there was insufficient high-quality evidence to support more than a limited recommendation for use of these types of dietary strategies (3). While studies reviewed for the 2013 guidelines suggested that short-term TMR weight loss could be larger than that achieved with FB diets, the potential for weight regain after TMR still appeared high (3). The studies of TMR reviewed in the 2013 guide-lines, dating from 1998 to 2009, were generally short-term studies, often without follow-up intervention beyond 3 to 6 months of initiation of TMR (3).
Received: 1 June 2018; Accepted: 3 August 2018; Published online 13 November 2018. doi:10.1002/oby.22303 Funding agencies: This trial was funded by Nestlé Health Science.
Disclosure: JDA, JL and AA are consultants for Nestlé Healthcare Nutrition; JDA, KHL, and LM receive grant funding from Nestlé Health Science; SP is an employee of Nestlé Health Sciences. Nestlé Healthcare Nutrition owns the OPTIFAST program. The other authors declared no conflict of interest.
Clinical trial registration: ClinicalTrials.gov identifier NCT02635698.
1 Department of Epidemiology and Prevention, Wake Forest School of Medicine, Winston Salem, North Carolina, USA. Correspondence: Jamy D. Ard (jard@
wakehealth.edu) 2 Department of Internal Medicine, University of Michigan Health System, Ann Arbor, Michigan, USA 3 AMITA Health, Alexian Brothers
Weight Loss Solutions, Elk Grove Village, Illinois, USA 4 Alaska Premier Health, Anchorage, Alaska, USA 5 EpidStat Institute, Ann Arbor, Michigan, USA 6 The Central Ohio Nutrition Center, Inc., Gahanna, Ohio, USA 7 Department of Surgery, East Carolina University Brody School of Medicine, Greenville, North
The OPTIFAST program (OP) is one example of a TMR weight-loss intervention. Originally developed in the 1970s as a VLCD providing 420 kcal/d, the program has evolved to include comprehensive behav-ioral intervention and a higher calorie intake. This trial was designed to test the effectiveness of OP. The goal was to determine whether OP was more effective than an FB dietary plan and comprehensive behavioral intervention for weight loss at 26 and 52 weeks. We hypothesized that OP would lead to greater weight loss at 26 and 52 weeks and a greater proportion of patients achieving 5% and 10% weight loss compared with FB. In this report, we present the main results of the effectiveness of the Optifast program compared with a reduced-energy food based diet plan on body weight (OPTIWIN) trial, including weight-change outcomes, changes in body composition, and adverse events (AEs).
Methods
Setting and population
OPTIWIN was an open-label, multicenter, randomized controlled clinical trial. The nine participating US centers included five private clinics and four academic medical centers. Participants had to be 18 to 70 years old and nonsmokers with BMI of 30 to 55 kg/m2. Key
ex-clusions included recent weight loss or use of weight-loss medications, previous bariatric surgery, organ failure, type 1 diabetes or hemoglo-bin A1c > 10%, cardiovascular disease event or mental health
hospi-talization in the past 6 months, alcohol or drug dependence, positive screening for potential eating disorder, or poorly controlled depression. Volunteers were screened by telephone to assess initial eligibility, fol-lowed by an person visit to confirm eligibility and obtain written in-formed consent. Eligible individuals completed a 7-day run-in diet that included use of one serving of MR (OPTIFAST; Nestlé Health Science, Bridgewater, New Jersey) daily to assess tolerance to the product. The final screening visit was completed after the run-in to assess adher-ence to the run-in diet, self-monitoring tasks, and final eligibility. This study was overseen and approved by a central institutional review board (Quorum) after review by each site’s institutional review board and was registered on ClinicalTrials.gov (NCT02635698).
Treatment arms
OP.
Participants randomized to OP were provided all MR at no cost. Participants with BMI < 45 were instructed to use five MRs per day (800 kcal total) with 40% of calories as protein, 40% as carbohydrate, and 20% as fat. Participants with BMI of 45 to 49.9 received six MRs per day (960 kcal); those with BMI ≥ 50 received six MRs plus one meal daily of lean protein (3-4 ounces) and one nonstarchy vegetable serving (1,100-1,200 kcal). Participants followed their prescription for 12 to 16 weeks based on provider discretion and patient preference, after which there was gradual reintroduction of food through week 26. After week 26, participants’ calories were gradually increased to achieve weight stability. During this time, participants were advised to use one to two MRs daily to facilitate weight-loss maintenance. The OPTIFAST protocol requires medical monitoring during the ini-tiation of TMR. OP participants saw a clinician regularly to address health concerns and adjust medications for a total of 11 medical mon-itoring visits during the first 26 weeks and 4 medical monmon-itoring vis-its in weeks 27 to 52. Labs for medical monitoring, including either a basic or comprehensive metabolic panel, were obtained at weeks 2, 4, 6, 8, 10, 12, and 16. Participants had individual counseling with trainedinterventionists for a total of 16 individual counseling visits through the first 26 weeks and 11 individual counseling visits from week 27 through week 52.
FB program. The FB program was a modified version of the Diabetes Prevention Program (DPP) intervention (9-11). During active weight loss (0-26 weeks), FB participants were prescribed a calorie-restricted diet emphasizing lower fat intake (25%-30% of total calories). They were advised to reduce calories by 500 to 750 kcal below estimated total energy expenditure, calculated based on resting metabolic rate measured by indirect calorimetry (MedGem; Microlife USA, Inc., Clearwater, Florida) plus an activity factor based on self-reported physical activity. To balance the incentive of free MR in the OP arm, FB participants received gift cards totaling $800 to offset the cost of groceries during the active weight-loss phase. They also had two medical monitoring visits and seven individual counseling visits through week 26. During the maintenance phase (27-52 weeks), they had two medical monitoring visits and five individual counseling visits.
Comprehensive behavioral program. Both treatment groups had weekly 45- to 60-minute group behavioral sessions for the duration of the intervention. Group sessions were facilitated by trained professional interventionists using a standardized intervention manual. OP program sessions used the OPTIFAST Lifestyle Education Series content as the basis for the behavioral group sessions. The FB program used the DPP’s Group Lifestyle Balance program (9).
Both groups received prescriptions for physical activity that included a graduated target of 150 to 180 min/wk of moderate to vigorous exercise. Participants were instructed to record daily food and beverage intake and minutes of exercise using written journals, which were reviewed weekly by the interventionist.
Study measures
Body weight was measured in light clothing on digital scales to the nearest 0.1 lb. Height was measured without shoes using a wall-mounted stadiometer to the nearest 0.5 cm. BMI was calculated as weight in kilograms divided by height in meters squared. Waist circumference was measured using a spring-loaded tape measure (Gulick) 1 cm above the umbilicus. Two measures were averaged at each study visit. Body composition was measured using dual-energy x-ray absorptiometry. Physical activity was measured using a triaxial accelerometer (Philips Actiware, CT, Andover, Massachusetts) worn on the wrist for 7 days. AEs were ascertained at each clinic encounter or study visit using a standardized symptom checklist and questionnaire. Any new symptoms or medical problems were logged as AEs. The site medical provider reviewed each event and adjudicated the severity, relatedness, and clas-sification. Because the FB group had fewer contacts with study person-nel, the number of opportunities for reporting AEs was higher for the OP group. To adjust the AE frequency for the number of contacts, rates of AEs were also reported as the number of events per contact.
Analysis
Sample size was calculated primarily to show effectiveness of OP compared with FB on percent weight change at 52 weeks. To obtain 90% statistical power based on a two-sided test assuming α = 0.05, 113 participants per study group were required to detect a mean difference in weight change of 5% with an estimated standard deviation (SD) of
11.5%. With an estimated dropout rate of 30%, we planned to recruit 300 participants to provide 150 participants per study group.
The coprimary outcomes were percent change in body weight from baseline to weeks 26 and 52, tested using a hierarchical procedure. First, we planned to test the week 26 outcome. If this analysis was sta-tistically significant (P < 0.05), then the week 52 end point would be tested at the α = 0.05 level of significance. However, if the week 26 anal-ysis was not statistically significant, then the week 52 analanal-ysis would be exploratory rather than confirmatory.
The primary analysis population was a modified intention-to-treat (mITT) population, consisting of randomized subjects known to have started the study program and have at least one postbaseline assess-ment of body weight. For the primary analysis, we used a repeat-ed-measures model with both random and fixed effects to compare the percent weight change between the OP and FB groups. The lin-ear mixed model included a random intercept for subject, fixed visit effect, fixed treatment effect, and fixed baseline body weight effect, as well as a treatment-by-visit interaction term. The model also included age, race, sex, site, diabetes status, and gender as covariates. The final model was fit using the SAS PROC MIXED procedure using the RANDOM and LSMEANS statements (SAS Institute, Inc., Cary, North Carolina). A sensitivity analysis employed multiple imputation (MI) for missing body weight values at scheduled postbaseline vis-its (weeks 12, 26, 40, and 52) in the mITT population. Imputation
was performed separately (imputations = 50) for each treatment group using the SAS PROC MI procedure. Primary outcomes were then cal-culated from the imputed data sets. For secondary outcomes including body composition and AE frequency, continuous measures were com-pared using standard t tests, while categorical measures were com-pared using χ2 tests.
Results
Study population
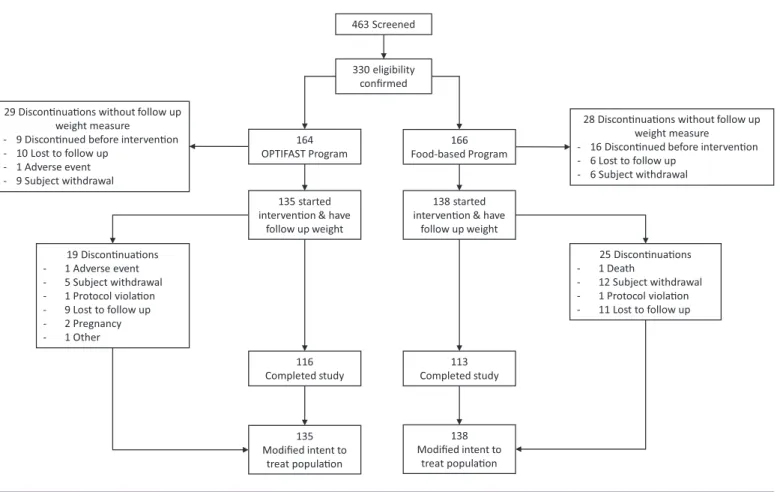
We screened 463 participants and confirmed eligibility on 330 participants (164 randomized to OP and 166 randomized to FB). There were 57 partic-ipants who either declined further participation in the study after learning their randomization assignment (9 OP; 16 FB) or discontinued participa-tion without a follow-up weight (20 OP; 12 FB); these participants were de-mographically similar to the mITT population, except they were younger (42.5 years; P = 0.006) and reported less weight loss on average with prior attempts (0.1 kg; P < 0.001). The remaining 273 participants (135 OP; 138 FB) made up the mITT study population (82.7% of randomized partici-pants; Figure 1). In the mITT study population, there were 19 participants in the OP group (14.1%) and 25 (18.1%) in the FB group who discontinued participation. Participants were typically middle-aged (47.1 ± 11.2 years), predominately female (82%), and white (71%) (Table 1). Fifty-two percent had prediabetes or diabetes, 33% were being treated for hypertension, and
Figure 1 CONSORT diagram.
463 Screened
330 eligibility confirmed
164
OPTIFAST Program Food-based Program166
135 started intervenon & have
follow up weight
138 started intervenon & have
follow up weight 19 Disconnuaons - 1 Adverse event - 5 Subject withdrawal - 1 Protocol violaon - 9 Lost to follow up - 2 Pregnancy - 1 Other 25 Disconnuaons - 1 Death - 12 Subject withdrawal - 1 Protocol violaon - 11 Lost to follow up 116 Completed study 113 Completed study 135 Modified intent to treat populaon 138 Modified intent to treat populaon
28 Disconnuaons without follow up weight measure
- 16 Disconnued before intervenon - 6 Lost to follow up
- 6 Subject withdrawal 29 Disconnuaons without follow up
weight measure - 9 Disconnued before intervenon - 10 Lost to follow up
- 1 Adverse event - 9 Subject withdrawal
21% were being treated for dyslipidemia. OP and FB participants attended 53.5% and 46.2% of weekly group behavioral sessions, respectively.
Weight-loss outcomes
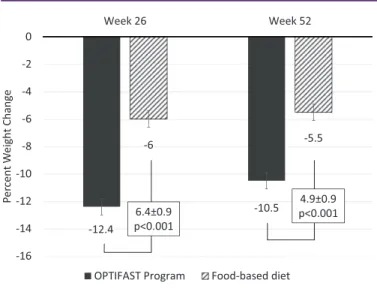
Both treatment groups lost weight at 26 and 52 weeks (Figure 2). Percent weight loss at 26 weeks was 12.4% ± 0.6% for OP compared with 6.0% ± 0.6% for FB (difference 6.4% ± 0.9%; P < 0.001). At 52 weeks, percent weight loss was 10.5% ± 0.6% for OP versus 5.5% ± 0.6% for FB (difference 4.9% ± 0.9%; P < 0.001) (Figure 2). Sensitivity analyses showed similar estimates for percent weight loss. Using MI to handle missing data showed a weight loss of 12.1% ± 0.6% and 10.1% ± 0.7% for OP at 26 and 52 weeks, respectively. Comparatively, FB had weight loss of 6.0% ± 0.6% and 5.5% ± 0.7% at 26 and 52 weeks. All differences between OP and FB remained significant at P < 0.001. At week 52, higher proportions of OP participants achieved 5% (63.7%) and 10% weight loss (43.7%) compared with FB (42% and 21.7%, respectively; P < 0.001) (Figure 3). The percentage of people who lost 15% or more of their initial weight was more than double in OP than FB
(30% vs. 12%; P < 0.001). We also examined the proportion of partici-pants who were nonresponders to assigned treatments, defined by a fail-ure to lose ≥ 3% of their initial body weight. At week 26, 15.6% of OP and 39.1% of FB participants were nonresponders. By week 52, 23.7% of OP participants were nonresponders versus 43.5% of FB participants.
Changes in body composition
Changes in body composition outcomes are shown in Table 2. Changes in waist circumference paralleled weight loss in both treatment groups; however, there were greater reductions for the OP group compared with FB at both 26 and 52 weeks. Changes in body composition measured by dual-energy x-ray absorptiometry followed a similar pattern. By week 52, mean total fat mass was decreased by 9.7 ± 10.4 kg for OP partic-ipants. The mean reduction in total fat mass for FB participants was 3.5 ± 6.6 kg at 52 weeks. Both treatment groups also had decreases in lean mass. The absolute difference was statistically significant; how-ever, the proportion of weight loss from lean mass at 52 weeks was similar (23% for OP; 25.5% for FB). There was no difference in change in total bone mineral density by treatment group.
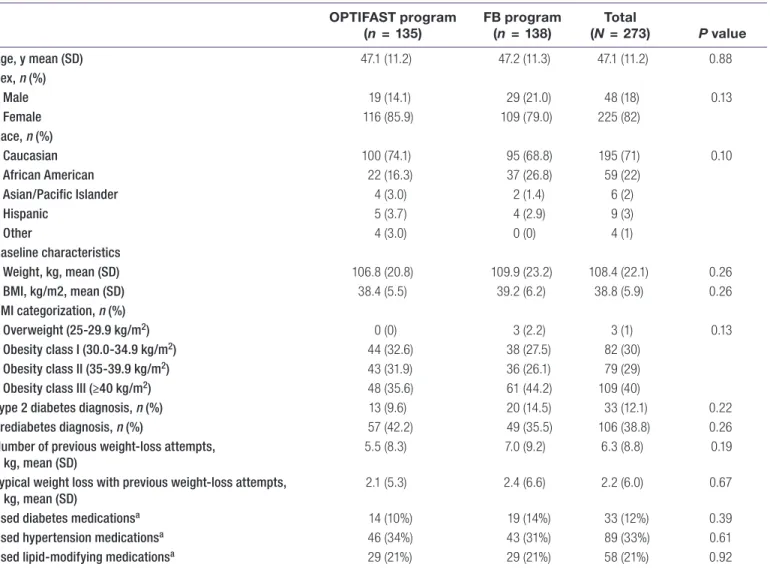
TABLE 1 Summary of demographic and baseline characteristics according to treatment groups
OPTIFAST program
(n = 135) FB program(n = 138) (NTotal = 273) P value
Age, y mean (SD) 47.1 (11.2) 47.2 (11.3) 47.1 (11.2) 0.88 Sex, n (%) Male 19 (14.1) 29 (21.0) 48 (18) 0.13 Female 116 (85.9) 109 (79.0) 225 (82) Race, n (%) Caucasian 100 (74.1) 95 (68.8) 195 (71) 0.10 African American 22 (16.3) 37 (26.8) 59 (22) Asian/Pacific Islander 4 (3.0) 2 (1.4) 6 (2) Hispanic 5 (3.7) 4 (2.9) 9 (3) Other 4 (3.0) 0 (0) 4 (1) Baseline characteristics Weight, kg, mean (SD) 106.8 (20.8) 109.9 (23.2) 108.4 (22.1) 0.26 BMI, kg/m2, mean (SD) 38.4 (5.5) 39.2 (6.2) 38.8 (5.9) 0.26 BMI categorization, n (%) Overweight (25-29.9 kg/m2) 0 (0) 3 (2.2) 3 (1) 0.13 Obesity class I (30.0-34.9 kg/m2) 44 (32.6) 38 (27.5) 82 (30) Obesity class II (35-39.9 kg/m2) 43 (31.9) 36 (26.1) 79 (29)
Obesity class III (≥40 kg/m2) 48 (35.6) 61 (44.2) 109 (40)
Type 2 diabetes diagnosis, n (%) 13 (9.6) 20 (14.5) 33 (12.1) 0.22
Prediabetes diagnosis, n (%) 57 (42.2) 49 (35.5) 106 (38.8) 0.26
Number of previous weight-loss attempts, kg, mean (SD)
5.5 (8.3) 7.0 (9.2) 6.3 (8.8) 0.19
Typical weight loss with previous weight-loss attempts, kg, mean (SD)
2.1 (5.3) 2.4 (6.6) 2.2 (6.0) 0.67
Used diabetes medicationsa 14 (10%) 19 (14%) 33 (12%) 0.39
Used hypertension medicationsa 46 (34%) 43 (31%) 89 (33%) 0.61
Used lipid-modifying medicationsa 29 (21%) 29 (21%) 58 (21%) 0.92
Continuous variables compared using standard t test. Categorical variables compared using χ2 test with the exception of race, which used Fisher exact test because of small cell counts.
aMedication use includes use prior to study with continuation during study or medication use that started during study and either continued throughout study or ended before study completion.
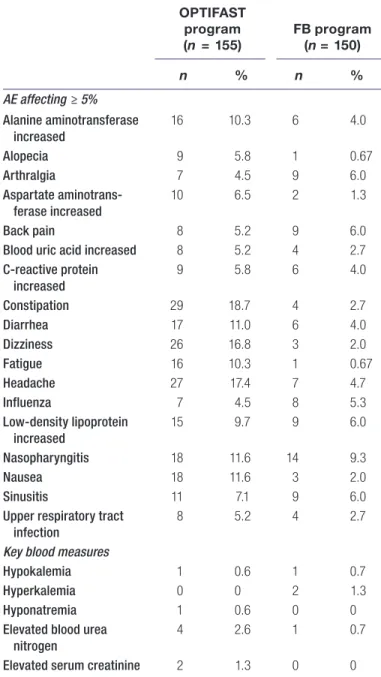
AEs
Mild or moderate AEs were reported by 76.8% of OP and 62.7% of FB participants (Table 3). Serious AEs were reported by 4.5% (7/155) of OP and 3.3% (5/150) of FB participants. Serious AEs in OP included knee pain, seventh cranial nerve paralysis, cholelithiasis, a third-de-gree burn, abdominal pain, pyelonephritis associated with acute liver failure, and pancreatitis associated with cholelithiasis. In FB, serious AEs included postconcussion syndrome following a motor vehicle accident, pneumonia, vascular surgery to repair a ruptured arterial vessel with subsequent death, depression with suicidal ideation, and a wound abscess. Discontinuation rates were not statistically different between groups (29.3% OP; 31.9% FB; P = 0.60). Main reasons for dis-continuation were subject request to no longer participate in the pro-gram (11.0% OP; 18.7% FB) or lost to follow-up (11.0% OP; 9.6% FB). There was a total of 695 AEs reported by OP participants and 356 AEs reported by FB participants. When adjusted for the number of contacts at which participants reported symptoms or other potential AEs, the number of AEs per contact was 0.17 for OP and 0.24 for FB (P = 0.014).
Discussion
This clinical trial compared two behavioral weight-loss strategies, OP versus a modified version of DPP. Participants in the OP treatment arm lost 10.5% of their initial weight by 52 weeks, representing a near doubling of the effect on body weight seen with FB. A larger propor-tion of participants lost 5%, 10%, or 15% of their body weight with OP, and a greater percentage of people responded with at least 3% weight loss to OP. The OP participants had greater losses of fat mass, and OP was well tolerated and safe. Overall, OP proved to be a more effective treatment than FB.
Previous trials of interventions using TMR, typically in the form of VLCD, suggested that short-term weight loss was much greater
than no treatment controls or low-calorie diets. However, once the TMR was discontinued, weight regain led to only modest differ-ences between the treatment arms with longer follow-up (3,12). In a meta-analysis of six randomized trials comparing VLCD with low-calorie diets with at least 1 year of follow-up, weight loss was 6.4% ± 2.7% greater for VLCD used on average for 12.7 weeks. However, longer-term weight loss (mean follow-up 1.9 ± 1.6 years) was not significantly different between the groups (VLCD 1.3% greater weight loss; P > 0.2) (12). The 2013 AHA/ACC/TOS Obesity Guidelines included four VLCD trials that met the inclusion criteria for the systematic review. Weight losses from 14 to 17 weeks ranged from 14.2 to 21.1 kg; during observational follow-up, weight regain was 3.1 to 3.7 kg through 38 weeks. In two of the trials that tested interventions for weight-loss maintenance, weight regain was 5.9 to 9.7 kg through 33 months (3).
In OPTIWIN, OP achieved greater weight loss through 12 months, experiencing less of the weight regain previously seen in TMR inter-ventions. One difference from prior trials that may account for sus-tained weight loss after TMR in our study is the presence of an active strategy for weight-loss maintenance, including continued behav-ioral therapy coupled with recommendations to use one to two MRs per day. Continuation of behavioral treatment is recognized as a crit-ical component for improving maintenance of weight loss; however, ongoing modification of calorie intake to achieve energy balance in a weight-reduced state continues to be a major challenge for weight-loss maintenance. Following TMR with ongoing use of MR for weight-loss maintenance may be advantageous because of the characteristics of MR associated with lower energy intake (e.g., portion control, low calories, reduced choice) and because of changes in an individual’s subjective cravings and desire for food, which have been objectively supported by functional magnetic resonance imaging showing contemporaneous changes in the brain regions responsible for regulation of food intake and reward (6).
Two prior studies lend some support to the idea that continued treat-ment and use of MR can be important for ongoing maintenance of lost weight. Vazquez et al. showed in a randomized trial of adults who lost at least 5% of their weight in 6 months using diet alone that use of one MR as a substitute for dinner was effective for maintaining
Figure 2 Relative weight change by treatment group at 26 weeks and 52 weeks.
Percent weight change values are calculated from a least square means from a linear mixed model. The linear mixed model contains a random intercept subject effect, fixed visit effect, fixed treatment effect, fixed baseline body weight effect, treatment-by-visit interaction term, and covariates including age, race, sex, site, and reported baseline diabetes status.
-12.4 -10.5 -6 -5.5 -16 -14 -12 -10 -8 -6 -4 -2 0 2 5 k e e W 6 2 k e e W Pe rc ent We ight Change
OPTIFAST Program Food-based diet 6.4±0.9
p<0.001
4.9±0.9 p<0.001
Figure 3 Proportion of participants who lost at least 5%, 10%, or 15% of initial body
weight at weeks 26 and 52. *Significantly different from FB group at P < 0.001. 0% 20% 40% 60% 80% ≥5% ≥10% ≥15% ≥5% ≥10% ≥15% 26 weeks 52 weeks Proporon of Study P arcipants OPTIFAST Food-Based * * * * * *
weight loss over the next 6 months (83.9% of participants) compared with diet alone (58.1%) (13). The importance of continuing active treatment can be highlighted by comparing results from a study by Argas et al. in which OPTIFAST was used to induce weight loss, and those who achieved 5% weight loss were randomized to one of four maintenance strategies involving use of regular or prepackaged foods. After 12 weeks of TMR, participants achieved approximately 15 kg of weight loss (14). Behavioral intervention continued for 9 months after the TMR phase, and weight loss for all treatment groups was 12.1 to 15 kg, suggesting continued maintenance of weight loss. However, after discontinuation of the behavioral treatment, signifi-cant weight regain was noted at 18 months post randomization in all groups (14).
Nutritional differences in OPTIWIN may have affected weight-loss maintenance as well. The OP caloric prescription has increased over time. Previously, all patients would be initiated on 420 kcal/d. Currently, the lowest recommended calorie prescription is 800 kcal/d with allowances for additional calories for higher initial body weight. The OP diet also provided a higher percentage of calories from pro-tein compared with the FB diet. The higher percentage of calories from protein may have contributed to the observed maintenance of weight loss, as higher protein intakes have been associated with greater satiation, leading to better weight-loss maintenance (15). Additional research is needed to quantify how much these dietary fac-tors influence loss maintenance and the durability of weight-loss differences beyond 12 months, as this is relatively early in the weight-maintenance process.
This is the largest randomized controlled trial of TMR in the United States, which allowed us to recruit a broad population of individu-als with obesity. The length of intervention and generalizable study population help to address the acceptability of TMR as part of a
behavioral weight-loss strategy. In our study population, attrition was approximately 25% (229/305 participants who started intervention). However, the discontinuation rate was similar for OP and FB, sug-gesting a TMR strategy is an acceptable strategy for those actively seeking to lose weight. The rate of AEs was slightly lower for the OP group, indicating that the increased weight loss from TMR may not result in more safety concerns. A suitable contemporary compar-ison to OPTIWIN is The Diabetes Remission Clinical Trial from the United Kingdom (16). In this 12-month intervention, individuals with type 2 diabetes and BMI 27 to 45 were assigned to TMR (n = 149) or standard of care (n = 149) to assess impact on diabetes remission. At 1 year, the intervention group had a mean weight change of −10.0 ± 8.0 kg and a net of control weight loss of 8.8 kg (95% CI: 10.3-7.3). The Diabetes Remission Clinical Trial had a similar rate of discontinu-ations from active treatment (21%) and serious AEs (4% of partici-pants) as OPTIWIN (16).
The clinical impact on weight of the OP intervention relative to FB requires some consideration of cost-effectiveness. As a result of ana-lyzing interventions like DPP, we know that high-intensity lifestyle interventions to promote weight loss can be cost effective. In years 1 to 3, the DPP lifestyle intervention was associated with the most direct medical care cost per participant ($2,780) compared with metformin ($2,542) and placebo ($79) (17). However, prevention of new onset diabetes in individuals with impaired glucose tolerance led to gains in quality-adjusted life years at a significantly lower cost than with the use of metformin or placebo (18). The near doubling of effect on body weight for OP was achieved at a higher overall cost than FB because of the additional medical monitoring and individual counseling. While we did not directly study cost effectiveness in this analysis, we are aware of other research that has suggested the potential for this type of inter-vention to be cost effective. Rothberg et al. reported clinical outcomes and per-member per-month (PMPM) costs for University of Michigan
TABLE 2 Change in body composition outcomes from baseline
Outcome OPTIFAST program (n = 135) FB program(n = 138) P value Mean (SD) Waist circumference (cm) Baseline 116.6 (14.0) 119.5 (15.2) 0.10 Change at 26 weeks −12.0 (16.0) −7.7 (8.3) 0.011 Change at 52 weeks −11.9 (12.1) −7.2 (9.3) 0.0011
Total body fat mass (kg)
Baseline 49.8 (11.8) 49.7 (11.7) 0.96
Change at 26 weeks −11.3 (7.5) −4.4 (5.9) <0.0001
Change at 52 weeks −9.7 (10.4) −3.5 (6.6) <0.0001
Total body lean mass (kg)
Baseline 51.6 (9.6) 53.5 (12.1) 0.15
Change at 26 weeks −2.3 (2.8) −1.1 (3.3) 0.008
Change at 52 weeks −2.9 (5.8) −1.2 (5.9) 0.043
Bone mineral density, total (g/cm2)
Baseline 1.2 (0.1) 1.3 (0.1) 0.026
Change at 26 weeks −0.01 (0.04) −0.006 (0.03) 0.28
Change at 52 weeks −0.01 (0.04) −0.01 (0.03) 0.95
(UM) Weight Management Program participants (n = 153) compared with other insurance-covered lifestyle interventions or no treatment (19). The UM program utilized a treatment protocol similar to OP, including TMR as part of the initial dietary intervention. On average, participants in the UM program decreased their BMI from 40.4 ± 5.3 to 36.2 ± 6.1 in 12 months of follow-up. The UM program was associ-ated with an adjusted per-member per-month cost increase of only 4% compared with a 10% increase for Weight Watchers, 16% for a walking program, and 29% for those not participating in any program. The cost per unit BMI reduction was $146 to $148 less for the TMR program compared with Weight Watchers and the walking programs. Similarly, a recent study using event-driven decision analysis models suggested
that OP over a 3-year period would be cost-saving compared with lira-glutide or naltrexone/bupropion in individuals with class I to II obesity (20). Ultimately, additional research is needed to understand the health economic impact in the OPTIWIN trial.
The results of this trial should be interpreted within the context of the limitations of the study design. This study was designed as a test of OP, not just the use of a MR; as such, conclusions about effectiveness are limited to the program, which included a comprehensive high-inten-sity behavioral intervention with a weight-maintenance strategy. Future studies could isolate the effect of MR by matching calorie prescriptions between TMR and an FB diet.
The frequency of individual clinical visits was higher for OP, and this could bias results in favor of OP. The high frequency of contact is a fea-ture of OP, and because the contact protocols were not equal between groups, we cannot make specific inferences about the individual effect of the TMR diet on the observed outcomes. The higher frequency of contact also led to ascertainment bias for AEs, potentially increas-ing the frequency of AEs reported for the OP group. Alternatively, in some cases, more frequent visits may have actually prevented potential AEs in the OP group, whereas the FB group had more time to develop AEs between visits. When adjusted for the frequency of contact, we observed a lower rate of AEs for the OP group. However, it is possible that the absolute rate of AEs would be higher in the OP group even if ascertainment had been equal between groups.
Lastly, even though the FB group received a stipend to defray the cost of food, it may not have completely matched the perceived value of the MR as done in OP. This could have affected engagement in favor of OP.
Conclusion
This multicenter clinical trial using OP demonstrated that a compre-hensive behavioral weight-loss intervention with TMR led to greater clinically significant weight loss at 26 and 52 weeks compared with a well-established FB behavioral intervention. It also showed the feasi-bility of such an intervention for motivated individuals.O
© 2018 The Obesity Society
References
1. Gardner CD, Trepanowski JF, Del Gobbo LC, et al. Effect of low-fat vs low-carbo-hydrate diet on 12-month weight loss in overweight adults and the association with genotype pattern or insulin secretion: the DIETFITS randomized clinical trial. JAMA
2018;319:667-679.
2. Sacks FM, Bray GA, Carey VJ, et al. Comparison of weight-loss diets with different compositions of fat, protein, and carbohydrates. N Engl J Med 2009;360:859-873. 3. Jensen MD, Ryan DH, Donato KM, et al. Guidelines (2013) for managing overweight
and obesity in adults. Obesity (Silver Spring) 2014;22(S2):S1-S410.
4. Heymsfield SB, van Mierlo CAJ, van der Knaap HCM, et al. Weight management using a meal replacement strategy: meta and pooling analysis from six studies. Int J Obes Relat Metab Disord 2003;27:537-549.
5. Keogh JB, Clifton PM. The role of meal replacements in obesity treatment. Obes Rev
2005;6:229-234.
6. Kahathuduwa CN, Davis T, O’Boyle M, et al. Effects of 3-week total meal replace-ment vs. typical food-based diet on human brain functional magnetic resonance im-aging food-cue reactivity and functional connectivity in people with obesity. Appetite
2018;120:431-441.
7. Heymsfield SB. Meal replacements and energy balance. Physiol Behav
2010;100:90-94.
8. Clinical guidelines on the identification, evaluation, and treatment of overweight and obesity in adults: executive summary. Expert panel on the identification, evaluation, and treatment of overweight in adults. Am J Clin Nutr 1998;68:899-917.
9. Diabetes Prevention Program Research Group. The Diabetes Prevention Program (DPP): description of lifestyle intervention. Diabetes Care 2002;25:2165-2171. TABLE 3 AEs affecting more than 5% of either treatment group
and key blood measures by treatment group
OPTIFAST program (n = 155) FB program(n = 150) n % n % AE affecting ≥ 5% Alanine aminotransferase increased 16 10.3 6 4.0 Alopecia 9 5.8 1 0.67 Arthralgia 7 4.5 9 6.0 Aspartate aminotrans-ferase increased 10 6.5 2 1.3 Back pain 8 5.2 9 6.0
Blood uric acid increased 8 5.2 4 2.7
C-reactive protein increased 9 5.8 6 4.0 Constipation 29 18.7 4 2.7 Diarrhea 17 11.0 6 4.0 Dizziness 26 16.8 3 2.0 Fatigue 16 10.3 1 0.67 Headache 27 17.4 7 4.7 Influenza 7 4.5 8 5.3 Low-density lipoprotein increased 15 9.7 9 6.0 Nasopharyngitis 18 11.6 14 9.3 Nausea 18 11.6 3 2.0 Sinusitis 11 7.1 9 6.0
Upper respiratory tract infection
8 5.2 4 2.7
Key blood measures
Hypokalemia 1 0.6 1 0.7
Hyperkalemia 0 0 2 1.3
Hyponatremia 1 0.6 0 0
Elevated blood urea nitrogen
4 2.6 1 0.7
Elevated serum creatinine 2 1.3 0 0
AEs reported in population of patients who were randomized and started the assigned intervention (n = 305).
10. Kramer MK, Kriska AM, Venditti EM, et al. Translating the Diabetes Prevention Program: a comprehensive model for prevention training and program delivery. Am J Prev Med 2009;37:505-511.
11. Knowler WC, Barrett-Connor E, Fowler SE, et al. Reduction in the incidence of type 2 diabetes with lifestyle intervention or metformin. N Engl J Med 2002;346: 393-403.
12. Tsai AG, Wadden TA. The evolution of very-low-calorie diets: an update and me-ta-analysis. Obesity (Silver Spring) 2006;14:1283-1293.
13. Vazquez C, Montagna C, Alcaraz F, et al. Meal replacement with a low-calorie diet formula in weight loss maintenance after weight loss induction with diet alone. Eur J Clin Nutr 2009;63:1226-1232.
14. Agras WS, Berkowitz RI, Arnow BA, et al. Maintenance following a very-low-calorie diet. J Consult Clin Psychol 1996;64:610-613.
15. Leidy HJ, Clifton PM, Astrup A, et al. The role of protein in weight loss and mainte-nance. Am J Clin Nutr 2015;101:1320S-1329S.
16. Lean ME, Leslie WS, Barnes AC, et al. Primary caled weight management for re-mission of type 2 diabetes (DiRECT): an open-label, cluster-randomised trial. Lancet
2017;391:541-551.
17. Herman WH, Brandle M, Zhang P, et al. Costs associated with the primary preven-tion of type 2 diabetes mellitus in the diabetes prevenpreven-tion program. Diabetes Care
2003;26:36-47.
18. Diabetes Prevention Program Research Group. The 10-year cost-effectiveness of life-style intervention or metformin for diabetes prevention: an intent-to-treat analysis of the DPP/DPPOS. Diabetes Care 2012;35:723-730.
19. Rothberg AE, McEwen LN, Fraser T, et al. The impact of a managed care obesity in-tervention on clinical outcomes and costs: a prospective observational study. Obesity (Silver Spring) 2013;21:2157-2162.
20. Nuijten M, Marczewska A, Araujo Torres K, Rasouli B, Perugini M. A health economic model to assess the cost-effectiveness of OPTIFAST for the treatment of obesity in the United States. J Med Econ 2018;21:835-844.