Cmf
Event No. 305.1^-PENETROMETER APPLICATION, SANDS, PERTH
B. CLEGG, B.E., Ph.D., F.I.E. Aust., Senior Lecturer, Civil Engineering, University of Western Australia
SUMMARY This paper reviews the introduction and application of penetrometers to site investigation and compaction control in sands of Perth area. It deals principally with the 9 kg, 600 mm drop, 16 mm dia. rod penetrometer. A survey has shown extensive use of this device as an alternative to field density testing. Influence of sand type, depth and moisture content on penetration resistance are discussed. Comparison is made with other penetrometers. Recent field and laboratory observations indicate its possible application to settlement analysis by correlation with moduli! from screw plate bearing and bore hole pressure meter tests.
1 INTRODUCTION
The expansion of the Perth Metropolitan Area has led to extensive use of the light (9kg)penetrometer as presented by the author together with Mr. Graham Click just 14 years ago at the I.E.Aust. Conference in Perth. (Click and Clegg 1965).
A large proportion of the light structures, princi-pally houses, are founded on sand and also, where clay and other soils are encountered near the Darl-ing escarpment and in the ranges, it is now common practice to excavate and replace with a "sand pad". The compaction requirements in these situations are now almost invariably expressed directly in terms of driving resistance of this penetrometer. At times the density is inferred by a calibration of density with driving resistance but this is genera-lly confined to major projects for a specific pur-pose. At the same time there has been a swing away
from what was the traditional limestone block strip footings with suspended timber floors to concrete strip footings and "slab on the ground" construct-ion. This has required uniform compaction over the whole site and as a result rapid compaction with use of vibratory devices has also become common. Rapid assessment of the compaction achieved has been essential, hence the acceptance of the penetrometer. Local authorities now require compaction certifi-cates for house sites and these are generally accepted on the basis of penetrometer tests.
In view of the considerable increase in its applica-tion this paper reviews the historical background; assesses its current useage; reports some research and comments on future possibilities, particularly as a means of estimating settlement.
2 HISTORICAL BACKGROUND
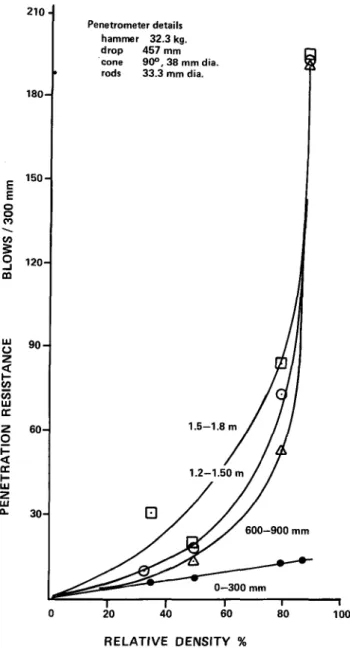
Soon after taking up the position as first full time lecturer in Soil Mechanics at the University of Western Australia, Department of Civil Engineering, the author included projects on the use of penetro-meters as final year thesis topics. The emphasis was then on their use for site investigations. The first penetrometer consisted of 'E' type 33.3 mm dia. diamond drill rods fitted with a 38.1 mm dia. 90° cone and driven by a 32.3 kg mass dropping 457 mm. This penetrometer was calibrated in a 3 m length of 495 mm diameter pipe with the results as shown in Figure 1 and Table 1 (Yim 1957). This
device was used on a number of small site investi-gations. One of particular interest is that at St. George's College Chapel (Fernie 1957). Typical penetration resistance with depth profiles at this site are shown in Figure 2. It is of interest to note that the test marked 'g1, taken in the vicinity of a badly cracked area of the building, shows approximately constant driving resistance below about 2 m whereas the other tests show a definite increase with depth. About the same time the stand-ard Penetration Test was introduced to Perth for the site investigation for the proposed Chevron Hotel -where the Perth Concert Hall is now located. (Clegg and Smith 1965) .
In the early 1960's the Department of Civil Engineer-ing offered the only commercial soil testEngineer-ing in Perth as an extension of its general testing facili-ties established many years previously. When the demand for field density tests in sand fill became excessive the need for a simple rapid test became evident. About this time the Main Roads Department had acquired from the Country Roads Board Victoria a Scala Penetrometer (Scala 1960). Using only a 9kg mass this device was considerably more portable than the 32kg mass being used and appeared to be more useful since there was only a need for shallow probing. Experiments showed that the conical point was not necessary in the find sand. The Scala pene-trometer was therefore modified slightly to a blunt end, 16 mm diameter rod, driven with a 9kg mass dropping 600 mm. This rod was calibrated by Pihu
(1961). In his study he investigated such factors as the effect of conical tip versus blunt ended, height of drop, depth of penetration and moisture content. One of the first projects on which it was used was the 1962 Empire Games Village at City Beach. The growing demand for field density testing of sand prompted the author to persuade a local machinery merchant to have the device manufactured and readily available in his showroom. Its use spread rapidly with "8 blows per foot" becoming the specification for good compaction. This value was determined between the 150 mm and 450 mm depth, since the cali-bration had shown a linear blows vs depth over this range. The suggestions for compaction control and site investigations put forward by Click and Clegg (1965) became generally accepted and its use wide-spread. By 1975 a review of the use of this pene-trometer seemed appropriate and a "state of the art" report was undertaken by Hewitt (1975). He followed this with some field and laboratory investigations
Event No. 305.1 210 180-g E § 150-GO 3 120 m UJ u
OT
w
UJ rr < cc UJ Q. 90- 60- 30-Penetrometer details hammer 32.3 kg. drop 457 mm cone 90°,38mmdia rods 33.3 mm dia. 0-300 mm 20 40 60 RELATIVE DENSITY ' 80 100Figure 1. Calibration, 32.3 kg penetrometer show-ing influence of depth (Yim 1957)
TABLE 1
Data for calibration 32.3 kg penetrometer showing influence of submergence (Yim 1957)
Depth m 0 - 0.3 0.6- 0.9 1.2- 1.5 1.5- 1.8
Relative Density, Moisture, 0 dry
\
37 dry 8 8 12 32 56 dry 9 14 18 18 80 dry 14 53 74 85 85 4.5% 7 190+ 190 + 190+ 85 sub-merged 8 38 50 56Figures indicate number of blows per 300 mm.
,Note effect of submergence and rapid increase in blows at higher relative densities. For details of penetrometer see Figure 1 (Yim 1957)
BLOWS/300mm 10 15 20 25 I 30I 35 T Q. UJ Q 1- 2- 3- 4-
5-Figure
For details of penetrometer see Figure 1
2. Application, 32.3 kg penetrometer, St.George's College Chapel (Fernie 1957)
as described in later sections of this paper. In 1970 the CSIRO Symposium on Foundations on Interbedded Sands held in Perth included several papers that should be referred to. Clegg (1970) reviewed the question of "Coastal Plain Dune Sand as a Foundation Material". Others discussed more specifically the use of SPT and Static Cone penetro-meters for estimating bearing capacity and settle-ment. (D'Appolonia and D'Appolonia 1970), (Hollings-worth and Wood 1970), (Greenwood and Tait 1970). This interest in penetrometers for settlement estim-ates led the author to investigate a project using the penetrometer for determination of an in-situ modulus of deformation. (Dumas 1978).
3 EXTENT OF USE
In order to obtain an overall picture of the pene-trometer 's use in Perth, Hewitt (1975) carried out a survey by questionnaire.
Of the 419 forms sent out 117 were returned with 90 organisations indicating either possessing or having access to one of the devices. The distribution among the various categories of users was found to be as follows : Architects Consulting Engineers Local Authorities Contractors Government 33 28 12 10 7 90"
Informal enquiries around the firms manufacturing the penetrometer suggest that some two thousand have been produced. Even allowing for its consum-able nature it appears that many small contractors and builders make use of it.
The questionnaire also showed that the expectancy varies from simply an assessment of uniformity of a site to predicting per cent compaction. The
recogni-Event No. 305.1 tion that for most domestic construction purposes
broad categories of density i.e. "loose", "medium" and "dense" are all that is required, has led to the achievement of a specific blow count, generally 7 or 8 for 300 mm as indicating good compaction. However the returns indicated some concern about the influence of the following factors :
- variation with sand type - influence of depth
- influence of moisture content
In view of this concern Hewitt (1975) carried out a limited programme of laboratory and field testing concentrating on the first two of these. The third aspect, the moisture content, was found to be too difficult for the kind of study being undertaken
and this awaits possible future investigation. ^
>
4 INFLUENCE OF SAND TYPE, DEPTH, MOISTURE CONTENT £j The variation in sand types in the Perth area may
best be seen in relation to the Soil Association of the Swan Coastal Plan (Bettenay, McArthur, Kingston 1960). The associations of particular interest are as follows. They roughly parallel the coastline. Quindalup - calcareous dunes, along the coast. Cottesloe - yellow and brown over limestone,
Spearwood dune system.
Karrakatta - leached yellow and brown over limestone Spearwood dune system.
Bassendean - grey highly leached,dunes.
While this pedalogical classification may not be considered the most desirable from the point of view of penetrometer calibration it is considered a reasonably sound basis from which to proceed. Information about the gradings of these sands is given by Clegg (1962), Beattie (1964).
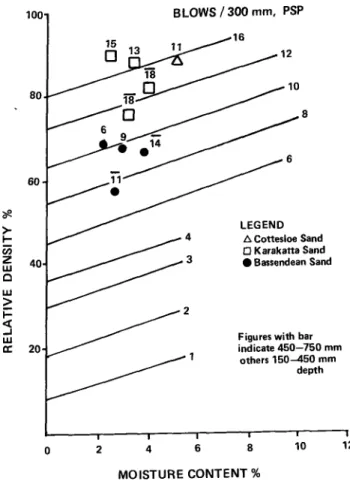
For his studies Hewitt chose two test areas in each of the above Associations, one north and one south of the Swan River. At his test sites, in terms of grading, the Quindalup sand was found to be much finer than the other three having D5Q of 0.2 mm compared to D of 0.35mm to 0.45 mm for the others. This difference was also evident in the range of densities from minimum to maximum, 1.1 to 1.3 Mg/m3 for Quindalup and 1.4 to 1.8 Mg/m3 for the others. He did however encounter the well recognised prob-lem with respect to the laboratory test methods for determining the maximum and minimum densities on which the relative density is based. He obtained a much better correlation between blows and minimum density and therefore doubted the reproducibility of the maximum density test procedure of vibrating wet under a surcharge. This aspect needs careful consideration since the original correlation of Pihu (1961) appears to have produced higher maximum densities and consequently lower relative densities for the same blow count. He therefore adjusted his data to the earlier study with results as shown in Figures 3 and 4. From this study it was concluded that there was essentially no difference between the Cottesloe, Karrakatta and Bassendean Associat-ions and that Quindalup Association appeared to give lower density for a given number of blows, but this needed further substantiation.
With respect to a depth, the Hewitt study confirmed the general observations that there is frequently an increase in driving resistance with depth, at least down to 90 mm and that, (as illistrated in Figure 4) this need not correspond to an increase in density. He suggested that the influence of depth may become complicated near the surface
100 80 60 Q LU 5 LU CC 20 15 BLOWS/300mm, PSP 16 13 LEGEND A Cottesloe Sand D Karakatta Sand • Bassendean Sand
Figures with bar indicate 450-750 mm others 150-450 mm depth -1 1 1 I 2 4 6 8 MOISTURE CONTENT % 10 12
Figure 3. Field data on laboratory calibration (Hewitt 1975) 100 80 >• I UJ LU cc 60 40 20 150—450 mm depth Laboratory calibration at 4% m.
(G LICK & CLEGG 1965)
450-750 mm depth
5 10
PSP BLOWS/300 mm
15
Figure 4. Comparison field and laboratory, relative density vs. penetration resistance.
Event No. 305.1
because o:f the compaction modifying the stress history so that the driving resistance may not be influenced by the overburden stress alone. Experi-ments with friction on the rod suggested that it was not a factor to be concerned with at least down to the depth used when testing for compaction control.»
The original calibration (Pihu 1961) indicated a decrease in driving resistance for an increase in moisture content. Attempts to verify this in the field were not successful. The free draining characteristics of these sands is such that they very quickly adjust after wetting to their field capacity. Also, excessively low moisture contents do not occur until after prolonged dry periods.
5 COMPARISON WITH OTHER PENETROMETERS
In view of the possible extension of the applicat-ion of the penetrometer to site investigatapplicat-ion and settlement estimates it is appropriate to consider it in relation to other similar devices.
The penetrometer closely resembles the Scala Pene-trometer with the two important differences. As previously mentioned it uses a blunt ended rod instead of a cone and the second is that the height of drop is 600 mm instead of 500 mm. The difference in driving resistance between these two penetrome-ters appears to be related mainly to the height of drop with 20% more blows being required for the Scala Penetrometer. The blunt ended rod is much easier to manufacture and is in fact easier to remove and this has become virtually the "standard model". It is possible that the sand trapped below the blunt end provides a "natural" cone with some clearance.
The status of penetration testing in Australia was reported by Holden (1974). The shallow probing devices for depths down to about one metre were said to be not relevant to his study. However, the penetrometer was included, presumably because of
the possible use of extension rods and its adaptat-ion to site investigatadaptat-ions. He made an interesting comment to the effect that the use of the penetro-meter should be discouraged because of the unknown effect of the skin friction on the rods.
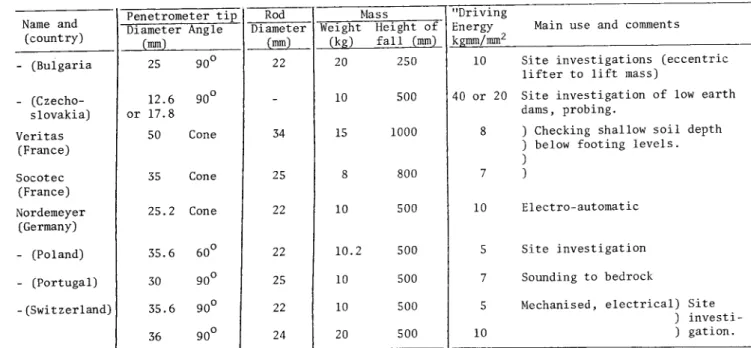
Similar penetrometers are in use elsewhere, particu-larly in Europe. Details of some of these are given in Table II. It should be noted that all of these devices have conical ends with larger diameters than the rods while hammer masses of 10kg and drop heights of 500 mm are common. Thus again,the blunt end is the unique feature of the penetrometer under discussion. A more comprehensive review is given by Sanglerat (1972).
Of particular interest in relation to the present discussion is the relationship between the SPT and the penetrometer. The SPT while not used for shallow density control probing is used extensively for site investigations and if the penetrometer is to be used for this purpose it would be helpful to have a correlation between them. Assuming that the SPT "cone" is the full cross sectional area of the sampler, it is of interest to note that the "driving energy" would be 24 kg.mm/mm2 compared with the penetrometer at 27 of these units. Gibbs and Holz (1957) reported the effect of surcharge on SPT as obtained from comprehensive laboratory studies. Their suggested relationship between SPT and relative density for "zero" overburden stress is very close to the penetrometer for damp sand with the SPT requiring slightly more blows for the same relative density. From some shallow SPT tests Chodorowski (1964) undisturbed "typical Perth sand" at a relative density of about 45% has an SPT blow count N of about 4 - the same as the penetrometer for this relative density. It is worth noting here that Chodorowski also reported the use of the pene-trometer consisting of a 60° solid cone on the end of the SPT sampler. This device has since been used extensively around Perth for site investi-gations. It appears to give slightly higher N values than the SPT.
TABLE II
Details of various light penetrometers (Hewitt 1975)
Name and (country) - (Bulgaria - (Czecho-slovakia) Veritas (France) Socotec (France) Nordemeyer (Germany) - (Poland) - (Portugal) - (Switzerland) Penetrometer tip Diameter (mm) 25 12.6 or 17.8 50 35 25.2 35.6 30 35.6 36 Angle 90° 90° Cone Cone Cone 60° 90° 90° 90° Rod Diameter (mm) 22 -34 25 22 22 25 22 24 Mass Weight (kg) 20 10 15 8 10 10.2 10 10 20 Height of fall (mm) 250 500 1000 800 500 500 500 500 500 "Driving Energy kHmm/mm2 10 40 or 20 8 7 10 5 7 5 10
Main use and comments
Site investigations (eccentric lifter to lift mass)
Site investigation of low earth dams, probing.
) Checking shallow soil depth ) below footing levels.
)
Electro- automatic
Site investigation
Sounding to bedrock
Mechanised, electrical) Site ) investi-) gation.
The "driving energy" is introduced as a measure of comparison of the different penetrometers.
,,, . . ,, mass x height of fall "driving energy" = >f . &—5
Event No. 305.1 6 CORRELATION; WITH SOIL rMODULUS
There has developed in recent years an interest in predicting settlement on sand based on in-situ modulus determinations from bearing tests or inferrence from penetration tests such as the Static Cone or> SPT.
Schmertman (1970) presented a study of the use of the static cone for settlement estimates by corre-lating with a modulus derived from a 230 mm dia. screw plate bearing test. From his observations he considered that the static cone was more desirable than the SPT although the latter could be used if the only field data available. In view of the apparent correlation between SPT and the penetro-meter the project of Dumas (1978) was undertaken. This consisted of some preliminary experiments aimed at establishing a correlation with the screw plate as used previously by Simpson (1972). The results are shown in Figure 5. The modulus, E , was derived from the load settlement data by first calculating a secant modulus E' and converting this to a representative modulus for the zone down to a depth of twice the diameter, B, of the plate using Schmertman's equation, that incorporates a vertical strain influence factor I and correction factors
viz.: z
Ap 2B
I
o Az
The constant cj, used to account for the reduced settlement to be expected at high ratios of over-burden stress to net foundation pressure increase was taken as unity in accordance with Shultze and Sherif (1973). The constant C2, to allow for creep was also taken as unity so that the relationship used became
E = 0.6 E'B
or ES ~ 0.14 E' (MPa)
It should be noted that the field screw plate tests were over a depth from about 1.0 m to 2.5 m, the laboratory tests from 150 mm to 600 mm and the pressuremeter tests were all at about 1 m depth. While these tests may be seen as preliminary only the possibility of using the penetrometer for settlement analysis is evident.
Correlation with the modulus as obtained from bore hole pressure meter tests is also indicated. Schultz and Bierdam (1977) presented the results of compre-hensive study of the pressuremeter-penetrometer relationships. Three types of sounding apparatus were considered, heavy, light and SPT. The light penetrometer used had two variations but would be basically similar to that of Nordmeyer of Germany as indicated in Table 2. The pressuremeter used was of the Menard type. Excellent correlations were established between the penetration resistance and lateral modulus of deformation. In view of this it is of interest to note the results of Van der Meer (1973). While not seeking a correlation he performed bore hole pressuremeter tests and used the penetrometer at the same sites. Data from his work is also plotted on Figure 5.
7 DISCUSSION
From the foregoing it can be seen that the penetro-meter was introduced and developed out of necessity. Its usefulness is amply demonstrated by its almost universal acceptance in the Perth area as the basis for compaction assessment. Its simplicity has resulted in it being used extensively by the "man on the job". Its reliability has resulted in it
20 Q § CO
u
I
I
O 15 10 LEGEND A Screw plate, field O " " Jab.(DUMAS 1978) G] Pressuremeter, field
(VAN DER MEER 1973)
O
5 10
PSP, BLOWS/300mm
15
Figure 5. Penetration resistance vs. equivalent Young's Modulus Es,from screw plate bearing and bore hole pressure meter tests.
being specified by "those in control". Basically it is little different from other penetrometers and may in fact be seen as merely another variety adapted to a particular local environment. It is suffering a little at the moment from lack of a standard name. It seems logical that this should embrace both "penetrometer" and "sand" or even "fine sand". While those associated with its introduction may well deserve recognition it has been the ready acceptance by the "technologists" of Perth that has led to its adaption to this part-icular soil environment. Thus "Perth Sand Penetro-meter" or "PSP" is perhaps the most appropriate title together with possibly the use of symbol N to denote the driving resistance.
Among the problems that have arisen with its appli-cation, the influence of sand type seems to have been the most prominent but, readily accounted for by recognition of departures from the "typical Perth sand", such as in the case of the finer Quindalup sand near the coast. It seems desirable to report a description of the sand type or at least an indication of the precise location of the site or origin of any imported sand.
The influence of depth should only arise when using extension rods. Provided the 150 to 450 mm inter-val is used consistently there should be no problem in this regard for compaction control. However evidence is that the penetration resistance in-creases with depth, principally due to the increase in overburden stress. There is also the possibil-ity that "compaction history" may be a factor due to its effect on the lateral earth pressure cond-itions. It seems safe to assume that a cons'tant or
Event 305.1
lowering of driving resistance with depth means lower relative density or alternatively that the water table has been reached.
With respect to the effect of moisture content, apart from the saturated, submerged and completely dry conditions, this appears to be minimal in a practical sense and is largely ignored. It may make a slight difference but the usual requirement for about 8 blows/300 mm probably has within it sufficient margin of safety to allow for this.
In relation to other penetrometers the fact that the penetrometer is blunt ended instead of conical and that the height of drop is 600 mm instead of 500 mm must be recognised. The lower drop height instruments are manufactured in Australia and while they may be used the results will certainly be different. In case of the comparison with SPT there is some evidence of a similarity between the penetrometer and SPT 'N' values for nominally zero overburden stress. The need to confirm this may become more important as the use of the penetro-meter for site investigation becomes more wide-spread.
The prediction of settlement on sand is not usually considered as important as with clay soils but there seems to be a growing need to properly assess level of compaction that is in fact necessary. Is for instance 8 blows/300 mm too high for most situ-ations? The suggested correlations with the modulii obtained from bore hole pressure meter tests and the screw plate bearing tests look very promising and well worth pursuing. A possible approach in applying this correlation would be to use the relationship of Schultz and Sherif (1973) viz that settlement, s = 0 . 6 p/JT and to estimate a
E
s
suitable value for E
Sfrom the penetrometer so that
s = 0.6 pSS . A very interesting result is.8 Np + 2.5
obtained when applying this to the settlement data for the Department of Main Roads building as given by Click (1970). The sand beneath the 12 footings was reported as having been compacted to between 12 and 16 blows/300 mm. Using 14 blows/ 300 mm and the above equation an Es of 13.7 MPa is obtained. With an average footing width of 4.3 m and an average pressure of 132 (MPa the settlement is estimated as 12 mm which is the same as the average of the observed settlements for the 12 footings at 20 months after construction. Dumas (1978), using the relationship that Np = 1.2 NSPT (Clegg 1970), obtained good agreement between predicted and observed settlements for the 22 sites considered by Schultz and Sherif (1973), further supporting this suggested procedure.
One of the difficulties that has arisen but not yet been considered is the rather more philosophical question of who should conduct the tests and make the judgement. Should this alway be a qualified Engineer? The device is so simple that very little skill is required to obtain values. "Why pay for someone else to perform such a test when the device can be purchased for under $100 and you can do it yourself?" appears to be a common attitude. There appears to be a definite need to have some form of "code of practice" particularly to indicate the required minimum number of tests and whether deeper probing is required.
8 CONCLUSION
The penetrometer (or PSP?) is now so well estab-lished in the Perth area that one has to conclude that it is here to stay. It may become modified
in time to meet a changing "environment" but as a basic tool for compaction in sand it should remain for some time.
It is used so widely by so many different people and at so many different levels of technical knowledge that some form of code of practice now seems desirable.
There is a need to be aware of the differences that can occur through variations in sand type, with depth of penetration and also of changing moisture and groundwater conditions. These appear to be important but nevertheless ignoring them doesn't appear to have created any unsurmountable problems.
The possible application of the penetrometer to settlement estimates along the lines being consid-ered elsewhere suggests that there is scope for the extension of its use in these more technically sophisticated areas.
9 ACKNOWLEDGEMENT
The author wishes to acknowledge the invaluable contribution made by those Engineers who, as under-graduates, attacked with enthusiasm the various projects reported in this paper and as listed in the references.
10 REFERENCES
BEATTIE, R.B. (1964). Flexible pavements built on sand subgrades in the Perth Area, Western Australia. Australian Road Research, Vol. 1, No. 10, pp.30-48.
BETTENAY, E. , McARTHUR, W.M., HINGSTON, F.J., (1960) The soil associations of part of the Swan Coastal Plain, W.A., C.S.I.R.O. Soil and Land Use Series, No. 35.
CHODOROWSKI, T., (1964). Correlation of two types of penetrometers in yellow sand. Thesis, Depart-ment of Civil Eng. , University of IT. A. Unpublished.
CLEGG, B., (1970). Coastal plain dune sand as a foundation material. Proc. C.S.I.R.O. Symposium Foundations on Interbedded Sands, Perth.
CLEGG, B., (1962). Flexible pavements on Perth Sands. Proc. Jnl. I.E. Aust., Vol. 34, No. 4-5.
CLEGG, B. , and SMITH, B. (1965). Site investigation for a multi-storey building in Perth. Proc. Jnl. I.E. Aust., Vol. 37, No. 1-2.
D'APPOLONIA, D.J., and D'APPOLONIA, E. (1970). Use of the SPT to estimate settlement of footings on s and. Proc. C.S.I.R.O. Symp. Foundations on Interbedded Sands, Perth.
DUMAS, R.F., (1978). Uniwest penetrometer to tiredict the settlement of shallow foundations on sand. Hons. thesis Dept. Civil Eng., University of W.A. Unpublished.
FERNIE, G.N., (1957). Structural stability of St. George's College Chapel and retaining wall. Thesis, Dept. Civil Eng., University of W.A. Unpublished.
GIBBS, H.J., and HOLTZ, W.G., (1957). Research on determining the density of sands by spoon pene-tration testing. Proc. 4th Int. Conf. Soil Mech.
CLICK, G.L. (1970). Settlement study of Main Roads Department building. Proc. C.S.I.R.O. Symp. Foundations on Interbedded Sands, Perth.
CLICK, G.L. and CLEGG, B., (1965). Use of a penetrometer for site investigation and compaction control at Perth, W.A. Civil Eng. Trans. I.E. Aust. Vol. CE7, No. 2.
GREENWOOD, D.A. and TAIT, J.B. (1970). Prediction of settlements of Foundations on sands. Proc. C.S.I.R.O. Symp. Foundations on Interbedded sands, Perth.
HEWITT, G.M. (1975). The Uniwest penetrometer. Hons. Thesis Dept. Civil Eng., University of W.A. Unpublished.
HOLDEN, J.C., (1974). Current status of penetrat-ion testing in Australia. Research Report, Country Road Board of Victoria.
HOLLINGSWORTH, P., and WOOD, C.G., (1970). Investi-gation and design of footings on sand. Proc. C.S.I.R.O. Symp. Foundations on Interbedded sands, Perth.
PIHU, 0., (1961). Calibration of a sounding rod for Perth yellow sand. Report, Dept. Civil Eng., University of W.A. Unpublished.
SANGLERAT, G., (1972). The
Event No. 305.1
Penetrometer and Soil Exploration, Amsterdam, Elsevier.
— •- /
SCALA, A.J., (19-60). Simple methods of flexible pavement design using cone penetrometers. Proc. 2nd ANZ Conf. S.M. and F.E. Sydney.
SCHMERTMAN, J.H. (1970). Static cone to compute static settlement over sand. Jnl. Soil Mech. and Fdts. Div. ASCE. Vol. 96, Part 1, No. SMS, pp.1011-1043.
SCHULTZE, E., and BIEDERMANN, B., (1977). Pressure-meter, penetroPressure-meter, and oedometer tests. Proc. 9th Int. Conf. Soil Mech. and Fdt. Eng. Vol. 1. Tokyo, pp.271-276.
SCHULTZE, E., and SHERIF, G. (1973). Prediction of settlements from settlement observations on sand. Proc. 8th Int. Conf. Soil Mech. and Fdt. Eng., Moscow, Vol. 1-3, pp.225-230.
SIMPSON, R.N., (1972). Use of screw anchors for reaction in plate bearing tests. Hon. Thesis, Dept. Civil Eng. University of W.A. Unpublished.
VAN DER MEER, A.T. (1973). A feasibility study of the use of lime piles for compaction of sand at depth. M. Eng. Sc. Thesis, Dept. Civil Eng., University of W.A. Unpublished.