286
© Global Society of Scientific Research and Researchers http://asrjetsjournal.org/
Streamflow Forecasting Using Artificial Neural Network
and Support Vector Machine Models
Rana Muhammad Adnan
a, Xiaohui Yuan
b*, Ozgur Kisi
c, Yanbin Yuan
da,bSchool of Hydropower and Information Engineering, Huazhong University of Science & Technology, 430074 Wuhan, China
c
Center for Interdisciplinary Research, International Black Sea University, Tbilisi, Georgia d
School of Resource and Environmental Engineering, Wuhan University of Technology, China aEmail: [email protected]
bEmail: [email protected] cEmail: [email protected] dEmail: [email protected]
Abstract
This paper investigates the ability of two soft computing methods including artificial neural network (ANN) and support vector machine (SVM) models in modeling monthly streamflow. The results of ANN and SVM models are compared on basis of determination coefficient (R2), root mean square error (RMSE) and mean absolute error (MAE) to evaluate the performance of the applied models. Comparison of results indicates that the SVM models with RMSE = 147.01 m3/s, MAE = 86.68 m3/s and R2 = 0.872 in test period is superior in forecasting monthly streamflows than the ANN models with RMSE = 161.59 m3/s, MAE = 94.87 m3/s and R2 = 0.869, respectively. It is found that SVM models can be successfully used in predicting monthly streamflows.
Keywords: Streamflow; Soft computing models; ANN; SVM.
1. Introduction
Water scarcity, high demand of electricity consumption, water requirement for the irrigation and the drinking purposes are the key factors that compelled researchers to predict streamflow precisely for efficient usage of water resources.
--- * Corresponding author.
287
Prediction of streamflow plays a key role in economic development of a catchment. Traditionally, streamflow prediction of a river basin is performed using physical and conceptual based models. Hydrological models have been categorized on the basis of their goals and their structures. Data driven models extensively used to model many variables in the field of hydrology, such as prediction of extreme events ( e.g. peak and low flows), streamflow or suspended sediment forecasting, reservoir inflow forecasting, precipitation or temperature prediction, evaporation or groundwater or water quality forecasting and rainfall runoff modeling. Artificial neural network (ANN) and support vector machine (SVM) are most popular and extensively used data driven models. These models have ability to incorporate the nonlinear behavior of hydrological time series.There is a plethora of literature on ANN model’s applications in the field of hydrology. Many researchers used ANN models to model different variables in the field of water resources. Thus, a complete review of all those application in this paper is not possible. ANN is selected in this study due to its better performance over conventional data driven models in the field of hydrology [1, 2]. An ANN model is applied to forecast river flow in comparison of an analytic power model [3]. They found the neural network model perform better than analytic power model. A neural network model is utilized to forecast river discharges in comparison of a conventional method [4]. They found that ANN prediction results were better than the conventional model. Daily river flows were predicted by using neural network mode [5]. ANN models were utilized in monthly river discharges prediction in comparison of conventional statistical model [6]. He explored that ANN model outperformed the statistical model in predicting streamflow. Different artificial neural network models were applied in comparison of conventional statistical model to predict the streamflow at the Jinsha river basin, China [7]. They found that the ANN models performed better than statistical model. Cigizoglu and Kisi [8] predicted daily streamflow by using ANN models with different training algorithms. In the last decade, support vector machine (SVM) which is one of the soft computational techniques has been successfully used in hydrology and proved as a better alternative to overcome some of the basic lacunae in application of ANN models. Khan and Coulibaly [9] used SVM models to predict lake water levels in comparison of multilayer perceptron (MLP) and multiplicative seasonal autoregressive model (SAR). They found that SVM prediction accuracy is better than the other two models for multi month ahead streamflow prediction. SVM model was applied to forecast long-term streamflow [10]. The river stage was forecasted by using the SVM model [11]. Daily suspended sediments were estimated by using SVM model [12]. Kisi and Cimen [13] predicted daily reference evapotranspiration through SVM model. For optimized reservoir operation, SVM model was successfully applied [14]. Monthly streamflows were predicted by using SVM model [15]. In precipitation downscaling problem, SVM model was utilized. In the literature many researchers used SVM models in comparison of ANN models. Guo and his friends [16] predicted monthly river discharges. They explored that the SVM outperformed than the ANN models. The SVM model was utilized to estimate the removal efficiency of settling basins in canals in comparison of ANN models [17] and found that SVM reduced the root mean square error of ANN from 5.736 to 5.712 due to its use of the structural risk minimization principle. SVM is used to forecast flood stage by Liong and Sivapragasam [18] in comparison of ANN models.
They found that predicted error by SVM for forecasted flood stage is less in comparison of ANN models. The purpose of this paper is to investigate the performance of SVM model for monthly streamflow forecasting and to compare this with the performance of ANN models.
288
2. Study Area and Data
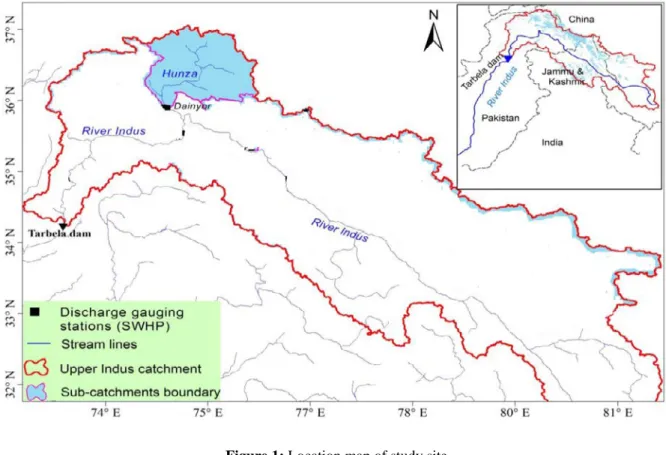
Dainyor hydraulic station is selected in this research to test the predicting ability of the ANN and SVM models. Dainyor hydraulic gauging station is an important gauging station of upper Indus Basin and covers a drainage area of 13,734 Km2. Map of Dainyor gauging station is explained in Fig. 1. The monthly streamflow data of Dainyor gauging station from 1968 to 2006 is used in this study to forecast monthly streamflow. For the monthly streamflow forecasting applications, the monthly observed data of Dainyor station from 1968 to 1997 is used as training and from 1998 to 2006 is used as testing. The observed monthly streamflows show high positive skewness (1.347). The auto-correlations are quite low showing low persistence (e.g., lag1= 0.734, lag2= 0.223).
Figure 1: Location map of study site
Table 1: Monthly statistics of streamflow data sets
Data Set Min Max Mean S.deviation Skewness Lag1 Lag2 Lag3 Whole data set 34.38 1850 281.1 325.5 1.347 0.734 0.223 -0.206 Training data set 35.25 1759 360.5 471.3 1.121 0.693 0.165 -0.216 Testing data set 34.38 1850 285.6 347.9 1.533 0.714 0.196 -0.204
3. Methodology
289
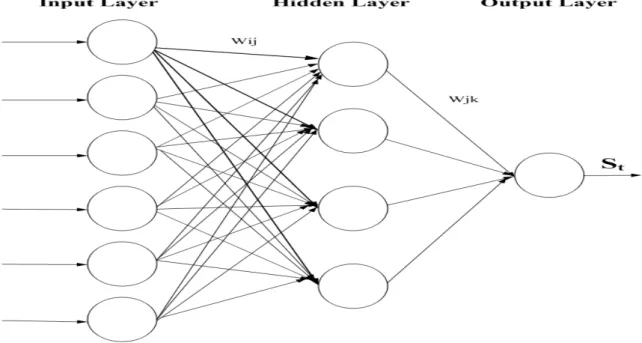
Arificial neural network (ANN) models are biologically inspired computational models and the development of these models originated with understanding the brain’s way to perform tasks. ANN models are biologically inspired computational models and the development of these models originated with understanding the brain’s way to perform tasks. The research on ANN models started with a classic paper by McCulloch and Pitts [19] in which they designed a neural model. A major development in the field of ANNs models was found in 1949,when Hebb [20] proposed many ANN architectures and also developed the learn rule known as “postulate of learning”. However, these both researches was biologically focused, not focus the computationally ability of ANN models. Later in 1960s, Rosenblatt [21] focused this issue in his studies by contributing the perceptron learning theorem i.e. commonly known as single layer feed forward neural network (FFNN) these days. However, Minsky and Papert [22] exposed the limits of this theorem due to having no extra layer to model complex functions. The most significant development in the field of NN models was the re-discovery of back propagation algorithm after 1980 by adding extra layer to single layer perceptron, which has emerged as the most popular learning algorithm for multilayer perceptrons. Back propagation algorithm was firstly developed by Werbos [23] in his Ph.D. thesis in 1974. However, his research was unknown for over a decade and gained popularity after the research work of Rumelhart and his companions [24]. The multilayer perceptrons or FFNN model is the most generally used ANN model [25]. Figure 2 illustrate a three-layer neural network consisting of layers i, j, and k, with the interconnection weights Wij and Wjk between layers of neurons. Initial estimated weight values are progressively corrected during a training process that compares predicted outputs to known outputs, and back-propagates any errors (from right to left in Fig. 2) to determine the appropriate weight adjustments necessary to minimize the errors.
Figure 2: The structure of ANN
3.2 SVM
290
has been developed by Vapnik [26]. Support vector regression (SVR) is used to describe regression with SVMs in the open literature. In regression estimation with SVR we attempt to estimate a functional dependency of y(x) on x inputs. The regression estimation with SVR is to estimate a function according to a given data set (x,y), where x denotes the input vector; y denotes the output (herein, the input vectors (x) refer to lagged values of streamflow, whereas the target values (y) refer to forecasted values). The regression function uses the following function:
b
x
x
y
(
)
=
ω
Tϕ
(
)
+
(1)where
ϕ
(.)
is a nonlinear function by which x is mapped into a feature space, b and x denote a weight vector and a coefficient that have to be estimated from the data.4. Results and Discussion
In this study, the SVM and ANN models were tested in one month ahead streamflow forecasting. Three input combinations based on lagged monthly streamflow values were selected in this study. Let assume that the SFt represents the flow at time t, the input combinations selected in the study are; (i) SFt-1,(ii) SFt-1, SFt-2, (iii) SFt-1, SFt-2 and SFt-3. The models performance was evaluated with respect to root mean square errors (RMSE), mean absolute errors (MAE) and determination coefficient (R2) statistics for each input combination. The RMSE , MAE and R2 can be expressed as;
2 1
)
(
1
f N t oSF
SF
N
RMSE
∑
=−
=
(2)=
MAE
∑
=−
N t f oSF
SF
N
11
(3) 2 1 2 2 1 2)
(
)
(
)
(
)
(
−
−
−
−
=
∑
∑
= = N t f f o o N t f f o oSF
SF
SF
SF
SF
SF
SF
SF
R
(4)Where N is the total number of observations, SFo is observed flow, SFf is forecasted streamflow,̅SFo is average of streamflow and ̅SFf is average forecasted flow.
Before testing the data, the architecture of ANN and the parameters for the SVM model (C and sigma) determined by using trial and error procedure. However, the trial and error procedure for SVM’s parameters determination converges very quickly while ANN took more time to obtain optimal architecture for the given training set. Table 2 shows the test results of the SVM models using the different input combinations for the
291
Dainyor station.Table 2: The RMSE, MAE and R2 statistics of SVM models using different streamflow input combinations
Model inputs Training period Testing period
RMSE MAE R2 RMSE MAE R2
SFt-1 219.32 170.97 0.561 238.81 176.15 0.539 SFt-1, SFt-2 147.91 102.56 0.869 151.36 105.42 0.859 SFt-1, SFt-2, SFt-3 140.43 91.75 0.896 147.01 86.68 0.872
According to the performance of the SVM models, the SVM model provides give better accuracies for the input combinations (iii) than the input combination (i) and (ii). The test results of the ANN models using the different input combinations for the Dainyor station is given in Table 3. It is clear from the table that ANN models also gives better forecast results for the input combination (iii) in comparison of input combination (i) and (ii). However, the input combination (i) shows worse results for both soft computing models.
Table 3: The RMSE, MAE and R2 statistics of ANN models using different streamflow input combinations
Model inputs Training period Testing period
RMSE MAE R2 RMSE MAE R2
SFt-1 229.36 159.24 0.579 240.53 159.42 0.559 SFt-1, SFt-2 193.01 125.62 0.851 174.39 109.21 0.853 SFt-1, SFt-2, SFt-3 167.08 100.17 0.888 161.59 94.87 0.869
292
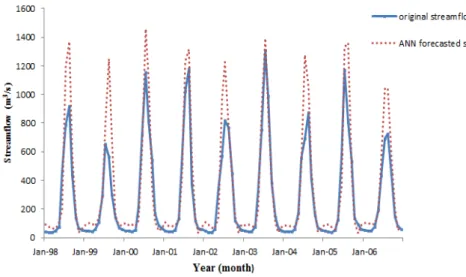
Figure 4: Flow hydrograph between original streamflow and forecasted streamflow using ANN
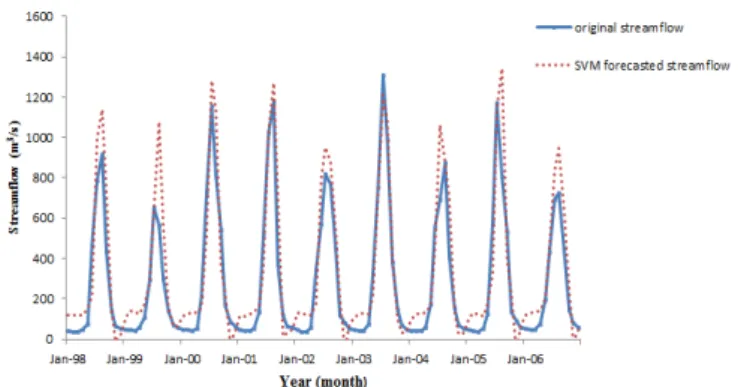
Comparison of Tables 2 and 3 reveals that SVM models perform better than ANN models during the training and testing period for all the input combinations. The average RMSE accuracies of the ANN models for the training and testing data sets were increased by 12.7–11.6 %, respectively using the SVM models for the Dainyor station. The hydrographs between original and forecasted streamflows by the SVM and the ANN models are presented in Figs.4 and 5, respectively. It is also evident from the hydrographs that the predicted streamflow by SVM is in good fit with the original streamflow in comparison of that ANN model.
Figure 5: Scatter plots of forecasted streamflow using SVM and ANN models
The observed and forecasted monthly streamflows by the SVM and ANN models for the input combination (iii) data are shown in Fig. 5 in the form of scatterplot. It is clear from the scatterplots that the fit line coefficients a and b (assume that the fit line equation is y=ax+b) of the SVM model are respectively closer to the 1 and 0 with a higher R2 value than that of ANN model.
293
5. Conclusions
In this paper, the performance of SVM and ANN models is compared in predicting of monthly streamflows. According to the results, it was found that SVM models for all different input combinations provided better prediction results in comparison of the ANN models for monthly streamflow prediction. The SVM model improved the average error value (RMSE) with respect to the ANN model by 12.7 and 11.6 % for the training and testing data sets, respectively. The results indicated that the SVM performed better than the ANN models. It is due to SVM's inherent properties i.e. no specific architecture requirement for SVM model at training stage and also by using structural minimization principle that helps it to avoid get local minima. Thus, SVM models could be successfully used in predicting monthly streamflows at this study site.
References
[1]. Toth E, Brath A, Montanari A: Comparison of short-term rainfall prediction models for real-time flood forecasting. Journal of hydrology 2000, 239:132-147.
[2]. Hsu Kl, Gupta HV, Sorooshian S: Artificial neural network modeling of the rainfall‐runoff process. Water resources research 1995, 31:2517-2530.
[3]. Karunanithi N, Grenney WJ, Whitley D, Bovee K: Neural networks for river flow prediction. Journal of computing in civil engineering 1994, 8:201-220.
[4]. Zealand CM, Burn DH, Simonovic SP: Short term streamflow forecasting using artificial neural networks. Journal of hydrology 1999, 214:32-48.
[5]. Sivakumar B, Jayawardena A, Fernando T: River flow forecasting: use of phase-space reconstruction and artificial neural networks approaches. Journal of hydrology 2002, 265:225-245.
[6]. Kişi Ö: River flow modeling using artificial neural networks. Journal of Hydrologic Engineering 2004, 9:60-63.
[7]. Tayyab M, Zhou J, Zeng X, Adnan R: Discharge Forecasting By Applying Artificial Neural Networks At The Jinsha River Basin, China. European Scientific Journal 2016, 12.
[8]. Cigizoglu HK, Kişi Ö: Flow prediction by three back propagation techniques using k-fold partitioning of neural network training data. Hydrology Research 2005, 36:49-64.
[9]. Khan MS, Coulibaly P: Application of support vector machine in lake water level prediction. Journal of Hydrologic Engineering 2006, 11:199-205.
[10]. Lin J-Y, Cheng C-T, Chau K-W: Using support vector machines for long-term discharge prediction. Hydrological Sciences Journal 2006, 51:599-612.
[11]. Wu C, Chau K, Li Y: River stage prediction based on a distributed support vector regression. Journal of hydrology 2008, 358:96-111.
[12]. Cimen M: Estimation of daily suspended sediments using support vector machines. Hydrological Sciences Journal 2008, 53:656-666.
[13]. KIŞI, OZGUR, and Mesut Cimen. "Evapotranspiration modelling using support vector machines/Modélisation de l'évapotranspiration à l'aide de ‘support vector machines’." Hydrological sciences journal 54.5 (2009): 918-928.
294
and support vector machine. Advances in water resources 2009, 32:1588-1600.
[15]. Chen S-T, Yu P-S, Tang Y-H: Statistical downscaling of daily precipitation using support vector machines and multivariate analysis. Journal of Hydrology 2010, 385:13-22.
[16]. Guo J, Zhou J, Qin H, Zou Q, Li Q: Monthly streamflow forecasting based on improved support vector machine model. Expert Systems with Applications 2011, 38:13073-13081.
[17]. Singh K, Pal M, Ojha C, Singh V: Estimation of removal efficiency for settling basins using neural networks and support vector machines. Journal of Hydrologic Engineering 2008, 13:146-155.
[18]. Liong SY, Sivapragasam C: Flood stage forecasting with support vector machines1. Wiley Online Library; 2002.
[19]. McCulloch WS, Pitts W: A logical calculus of the ideas immanent in nervous activity. The bulletin of mathematical biophysics 1943, 5:115-133.
[20]. Hebb D: The organisation of behavior Wiley. New York 1949.
[21]. Rosenblatt F: The perceptron: A probabilistic model for information storage and organization in the brain. Psychological review 1958, 65:386.
[22]. Minsky M, Papert S: Perceptrons: An essay in computational geometry. Cambridge, MA: MIT Press; 1969.
[23]. Werbos P: Beyond regression: New tools for prediction and analysis in the behavioral sciences. 1974. [24]. Rumelhart D, Hinton G, Williams R: Learning internal representation by back propagation. Parallel
distributed processing: exploration in the microstructure of cognition 1986, 1. [25]. Gallant SI: Neural network learning and expert systems. MIT press; 1993.