Arts
2017
Lessons Learned from a Faculty-Led Project: Using
Learning Analytics for Course Design
Matt Farrell
Fanshawe College, mfarrell@fanshawec.ca
Follow this and additional works at:
http://first.fanshawec.ca/
famd_languageliberalarts_facultystaffpublications
Part of the
Educational Assessment, Evaluation, and Research Commons
,
Educational Methods
Commons
,
Other Education Commons
, and the
Scholarship of Teaching and Learning Commons
This Conference Proceeding is brought to you for free and open access by the School of Language & Liberal Arts at FIRST: Fanshawe Innovation, Research, Scholarship, Teaching. It has been accepted for inclusion in Faculty & Staff Publications - Language & Liberal Arts by an authorized
Recommended Citation
Farrell, M. (2017) Lessons Learned from a Faculty-Led Project: Using Learning Analytics for Course Design. In Shehata, S. & Tan, J.P-L. (Eds.) Practitioner Track Proceedings of the Seventh International Learning Analytics & Knowledge Conference (LAK17). Simon Fraser University, Vancouver, Canada, (March 13-17). SoLAR
Lessons Learned from a Faculty-Led Project: Using Learning
Analytics for Course Design
Matt Farrell
Fanshawe College mfarrell@fanshawec.ca
ABSTRACT: This showcase describes a project that used student activity data from the Learning Management System (LMS) to inform course design decisions in a blended learning context. Two blended courses were offered in the General Education curriculum at a community college, with each course employing a different design configuration. Student activity was tracked and compared across both classes to determine whether one design resulted in more engagement with the online course materials. The two courses shared similar subject matter, and were taught by the same instructor. Initial results indicated that student engagement and performance were higher in the frontloaded configuration compared to the bookend design. Findings were then applied to a course redesign aimed at increasing online student engagement in the underperforming course. The secondary comparison also found higher levels of engagement and performance in the redesigned course. The results offer a potential template for faculty and course designers to make use of data generated by student activity in the online environment.
Keywords: learning analytics, blended learning, course design, evidence-based teaching
1 DEPLOYMENT
In 2015, an Ontario community college introduced a number of elective courses in a blended format. Some courses had been offered previously in a face-to-face (F2F) format, while others were new courses. Many faculty members expressed concern over the new format, feeling that students would simply ignore the online portion of their coursework. Additionally, there was uncertainty over how to best to design courses for the blended context. One faculty member sought to use learning analytics to explore whether some course design configurations proved more effective than others. As learners interact with the Learning Management System (LMS) they leave a trail of data which can provide “actionable intelligence” for guiding pedagogical decisions (Campbell, Peter, & Oblinger, 2007). By using this data, a process which Vivolo (2014) calls “pocket data analytics”, courses could be designed to utilize the most effective elements. Moreover, a successful application of learning analytics could provide a template for faculty in future course design initiatives.
2 IMPLEMENTATION
The project began in the fall term of 2015 by comparing two elective blended courses. Each course utilized online learning modules, readings, instructor screencasts, low-stakes online quizzes, and active-learning
Student activity data and performance data were tracked to determine if the completion of course material differed between courses.
2.1 Course Characteristics
Two different designs were compared. Course A used a frontloaded design, whereby students completed the online portion prior to the in-class session. Course B employed a bookend structure, in which students completed online elements before and after their in-class meeting. Both courses, shown in Table 1, were General Education elective courses in the same discipline16.
Table 1: Courses used for initial comparison.
Course Course Name & Code Enrolment Design
A POLI-1022 – Rights & Freedoms 58 Frontload B POLI-1015 – Canadian Politics 44 Bookend
Students in group A were resident in a variety of different vocational programs, while group B students were all from the same program cohort.
2.2 Data Collection
The courses were compared using measures of students’ activity data and performance data. Activity data includes LMS clickstream data which can be used to track page views, assignment submission, and participation in collaborative activities such as discussion forums (Vivolo, 2014). This project examined online page views, instructor screencast views, and completion of weekly content quizzes. While page views in an LMS activity log do not necessarily correspond to task completion, they can be indicators of engagement and comprehension (Little, et al., 2016). The performance data – grades – were included in an attempt to measure comprehension as well as completion.
The Brightspace Learning Management System was used to track how many students, as a percentage of the total, had viewed the course material each week. The same metric was used to track completion of weekly content quizzes. YouTube analytics were also used to track views of lecture screencasts17. Both indicators would reveal if there were differences in the levels of interaction across the two courses. Additionally, student performance was compared using weekly quiz scores and final grades.
16 College students in Ontario are required to take a minimum of 1 elective course that lies outside of their core subject area.
These are known as General Education electives.
17 Screencast videos – approximately 10 minutes long, were hosted on YouTube and embedded in the LMS. This enabled the use
2.3 Initial Analysis
The frontloaded design used in course A outperformed course B’s bookend design across all indicators. 2.3.1 Activity Data
Figures 1, 2, and 3 show the differences in online engagement across the two courses. Students in course A viewed more of the course material than the students in course B, as shown in Figure 1.
Figure 1: Activity data | Weekly content
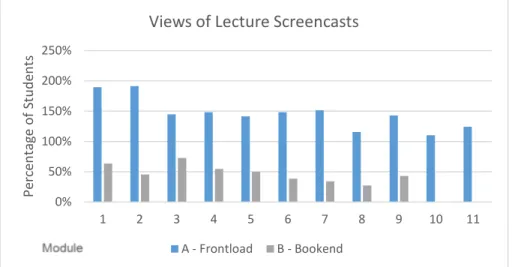
On average, 78% of the students in course A viewed the weekly content module, compared to 47% of the students in course B. A similar pattern, shown in Figure 2, was observed when comparing YouTube viewing data. The videos in course A were viewed more than once per student each week, whereas the average video in course B was viewed 21 times despite having 44 students.
Figure 2: Activity data | Weekly lecture videos
0% 20% 40% 60% 80% 100% 1 2 3 4 5 6 7 8 9 10 11 12 13 Total Avg P e rc e n ta g e o f S tu d e n ts
Completion of Weekly Content Modules (% of students)
A - Frontload B - Bookend 0% 50% 100% 150% 200% 250% 1 2 3 4 5 6 7 8 9 10 11 P e rc e n ta g e o f S tu d e n ts
Views of Lecture Screencasts
Figure 3: Completion of weekly quizzes
2.3.2 Performance Data
Similar to the activity data, students in course A outperformed their counterparts in course B across both performance indicators. Figure 4 highlights the differences in quiz scores and final grades across the two groups.
Figure 4: Performance measures
0% 10% 20% 30% 40% 50% 60% 70% 80% 90% 100% 1 2 3 4 5 6 7 8 9 10 11 12 P e rc e n ta g e o f S tu d e n ts
Number of Quiz Attempts (% of class)
A - Frontload: Number of Submissions (Avg. 51/58 - 88%) B - Bookend: Number of Submissions (Avg. 31/44 - 70%) Quiz Number 79% 72% 69% 61% 0% 10% 20% 30% 40% 50% 60% 70% 80% 90%
Avg. Quiz Score Avg. Final Grade
G ra d e ( p e rc e n ta g e )
Performance Measures - Initial Comparison
Students in the frontloaded course scored a full letter grade higher on their weekly quiz attempts and on their final grades.
2.4 Observations
The Initial comparison provided actionable data that could be easily accessed by the instructor. The data revealed clear differences in activity and performance, with the frontloaded design outperforming the bookend design. A higher percentage of students in the frontloaded group were participating in the course and they achieved greater mastery of the course content as demonstrated through weekly content quizzes and final grades.
Despite the apparent difference in engagement between the two course design configurations, the project was constrained by one key factor: structural differences in student groups. Given the elective nature of course A, students had actively chosen to enroll in the course. They chose their elective course out of a list of options, while the group B course was a mandatory elective - students were forced to take the course18. It is possible that the compulsory nature of the elective, or other inherent difference in student groups, may have contributed to the differing levels of engagement and performance. To more fully understand the effect of course design on student engagement, the project would need to be replicated using similar student groups.
3 REDESIGN
In an attempt to more accurately assess the effect of course design, course B was redesigned to incorporate the frontloaded structure. The subsequent offering of course B – Fall 2016 – was delivered with the new design. The same comparison was then conducted using both versions of course B, which offered two groups that, while still of different composition, would be structurally more alike than the groups used in the initial comparison.
Table 2: Courses used for secondary comparison.
Course Course Name & Code Enrolment Design
B15 POLI-1015 – Canadian Politics (Fall 2015) 44 Bookend B16 POLI-1015 – Canadian Politics (Fall 2016) 24 Frontload The two groups were then compared using the same measures of activity and performance.
18 Despite being a mandatory course, POLI-1015 was classified as an elective. Students could place-out of the course if they had
As in the initial comparison, the frontloaded design produced higher levels of engagement across all activity measures: content completion, video views, and quiz completion, and higher performance compared to the bookend format.
3.1.1 Activity Data
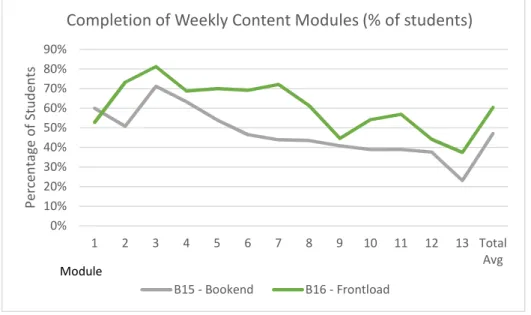
As Figure 5 illustrates, the redesigned, frontloaded version of the course produced higher levels of completion for the weekly modules, with one exception in the introductory week of the term.
Figure 5: Activity data | Weekly content
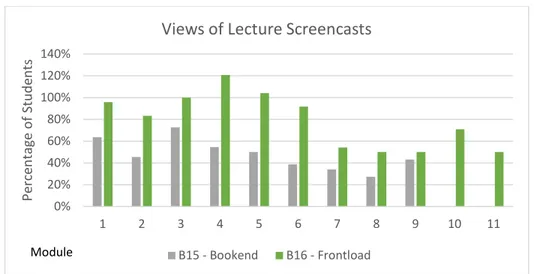
On average, there were 13% more students viewing the content modules each week. Similarly, as shown in Figure 6, the updated19, frontloaded course design elicited more video views from the class with 79% of the students viewing the weekly lecture videos, including two weeks where each lecture video was viewed more than once per student. This level was never reached in the previous offering, with only 48% of students watching videos each week.
19 The actual lecture screencasts were substantively similar. Minor updates were made to some videos to account for a change
in government, which produced different names of the office holders being studied. 0% 10% 20% 30% 40% 50% 60% 70% 80% 90% 1 2 3 4 5 6 7 8 9 10 11 12 13 Total Avg P e rc e n ta g e o f S tu d e n ts
Completion of Weekly Content Modules (% of students)
B15 - Bookend B16 - Frontload Module
Figure 6: Activity data | Weekly lecture videos
Quiz completion, shown in Figure 7, also increased by 5% over the previous year.
Figure 7: Completion of weekly quizzes
3.1.2 Performance Data
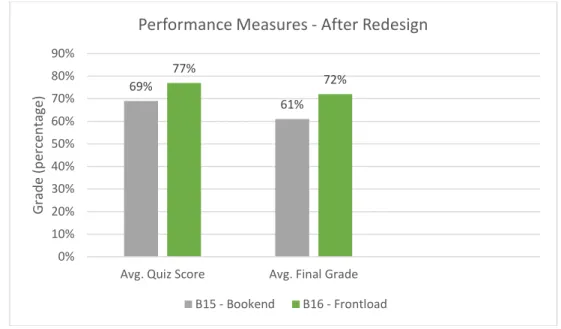
Students performed better in the redesigned, frontloaded offering. Performance on both the weekly content quizzes and final grades had improved compared to 2015, as shown in Figure 8.
0% 20% 40% 60% 80% 100% 120% 140% 1 2 3 4 5 6 7 8 9 10 11 P e rc e n ta g e o f S tu d e n ts
Views of Lecture Screencasts
B15 - Bookend B16 - Frontload Module 0% 20% 40% 60% 80% 100% 120% 1 2 3 4 5 6 7 8 9 10 11 12
Number of Quiz Attempts (% of Class)
B15 - Bookend: Number of Submissions (31/44 - 70%) B16 - Frontload: Number of Submissions (20.5/24 - 85%)
Figure 8: Performance measures
4 LESSONS LEARNED
In this project, student activity and performance data were used to determine that a specific course design configuration produced higher levels of engagement and performance in the online portion of a blended course. Evidence from the initial comparison was then incorporated into a course redesign to determine if there would be a corresponding increase in engagement and performance. The results were positive, as the redesigned course outperformed its prior offering. While it is difficult to draw conclusions as to what specific elements of the frontloaded design were superior (if at all), the more useful observations pertain to the potential for using pocket data analytics at the faculty level to improve course design, and, ideally, outcomes.
The instructor used accessible user data from the LMS, without the use of specialty applications or dashboards, and no data was gathered using administrator access. The Information used was available to all faculty at the institution. There is tremendous potential for using such readily available data in the context of evidence-based education. For instance, faculty and, as appropriate, instructional design staff can use activity and performance data from the LMS to assess the effectiveness of course components in the online environment. Most learning platforms make use of similar tools and features, including checklists, surveys, discussion boards, and quizzes, in addition to a variety of content display options. If a given tool is observed to elicit more student engagement, or greater mastery of content, then courses can be designed – and redesigned – to bolster engagement. Similarly, ineffective tools and techniques can be phased out. 69% 61% 77% 72% 0% 10% 20% 30% 40% 50% 60% 70% 80% 90%
Avg. Quiz Score Avg. Final Grade
G ra d e ( p e rc e n ta g e ) B15 - Bookend B16 - Frontload
REFERENCES
Campbell, J. P., Peter, D., & Oblinger, D. (2007). Academic Analytics: A New Tool for a New Era. Educause Review, 42(4), 40-57.
Little, R. W., Rocchio, R., Arnold, K., Bayer, I., Brooks, C., & Shehata, S. (2016). The Predictive Learning Analytics Revolution: Leveraging Learning Data for Student Success. EDUCAUSE Center for Analysis and Research (ECAR).
Vivolo, J. (2014). Pocket Data Analytics: An Introduction to Practical Applications of Course Analytics in Online Learning. Paper presented at the Proceedings of the International Conference on Analytics Driven Solutions, Ottawa, ON (pp. 102-110). England, UK: Academic Conferences and Publishing International Limited.