R
ANDOM
ROADSIDE
DRUG‐TESTING
PROGRAM
IN
V
ICTORIA
1.1
Background
In 2006, the State Government of Victoria in Australia passed the Road Safety (Drugs) Bill 2006 that proposed amendments to the Road Safety Act 1986 [1]. The primary purpose of this bill was to authorise the implementation of a program that randomly selected motorists for mandatory roadside drug tests (RDT). Under the amended Act, any motorists tested positive to cannabis, methamphetamine or methylenedioxy‐methamphetamine1 (MDMA) at any detected level by the tests will be prosecuted for ‘drug driving’. Accordingly, driving a motor vehicle in the presence of any detectable level of the drugs prescribed under the Act [1] is referred to as ‘drug driving’ hereafter. The RDT program was first commenced in December 2004 as a legislative trial for a 12‐month period under the provisions of the Road Safety (Drug Driving) Act 2003. The antecedent of this program was an ‘impairment‐based program’ introduced in 2000, the aim of which was to detect and prosecute drug driving only when motorists exhibited observable impairment according to the standardised field sobriety tests [2]. Following the Victorian RDT model, all other jurisdictions in Australia, except the Australian Capital Territory, have introduced similar programs [3]. The Australian Capital Territory is currently reviewing its Road Transport (Alcohol and Drugs) Act 1977 with a view to adopting a similar program [4].
The Victorian RDT program is enforced by Victoria Police as part of the Government’s ‘Arrive Alive’ strategy [5]. It is implemented as an independent program alongside the well‐established program of random breath testing for alcohol (RBT). The rationales underpinning the RDT and RBT programs are similar, that is, to reduce road trauma due to substance‐induced psychomotor impairments. According to a literature review conducted as part of this evaluation (reference can be requested from the author), there is now a converging body of evidence that cannabis and other illicit drug use can significantly impair psychomotor functions. These impairments increase the risks of both fatal and non‐fatal road traffic accidents to the driver and others. The risks are potentiated when alcohol and other drugs are also present.
The RDT program can be conceptualised as a type of ‘secondary’ prevention [6]. It prevents drug‐ related road traffic accidents through the timely detection of individuals who are at higher risk of causing road trauma. It also aims to deter cannabis users from engaging in the high‐risk behaviour of drug driving. Indeed, one of the main objectives of the RDT program is to produce both specific deterrence and general deterrence [7]. For specific deterrence, the RDT program aims to prevent recidivism by imposing penalty unit fines and demerit points upon detected offenders. Currently, a confirmed ‘drug driver’ is fined up to 12, 60 or 120 penalty units2 for the first, second or third offence, respectively. These fines are imposed in addition to cancellation of driver’s license for up to 6 months for the first offence, and up to 12 months for the second or third offence [1].
More important to public health is the potential general deterrent effect of such testing. In this case, drug users, who otherwise would have driven under the influence of drugs in the absence of a RDT program, may refrain from drug driving either by the fear of being apprehended or by being informed about the dangers of driving while intoxicated. In order to achieve a general deterrent effect, the RDT operation needs to be highly visible to create a sense of certainty of being detected and punished. It is also usually implemented in conjunction with a media campaign that alerts the public to the existence of the program and the hazards of drug driving. It is worth noting that the RDT program does not explicitly aim to reduce overall cannabis and other drug consumption. Rather, it is to prevent people from both using these drugs and driving a motor vehicle.
The feasibility and effectiveness of the Victorian RDT program have been evaluated during its operation from 2004 to 2005 [8] and from 2004 to 2006 [9]. These evaluations provided important information about the operation of RDT and the prevalence of drug driving amongst screened motorists in Victoria. However, the deterrent effects of the RDT program were not ascertained as part of these evaluations. From a policy perspective, an important question is whether such a program constitutes an efficient use of scarce resources. Indeed, Hall and Homel [10] argued that “the success of Australian roadside drug testing needs to be evaluated thoroughly to see if it reduces drug driving at an acceptable social and economic costs” (p.1918). In view of this, the objective of this study is to examine the economic credentials of the RDT program in Victoria. The Victorian RDT program was selected because it was the first program in the world that randomly selected drivers for a mandatory roadside drug test. Its effectiveness has also been formally evaluated and reported in peer review journals [8, 9]. Evaluations of the RDT programs in other Australian jurisdictions have either not been conducted or not been made available publicly.
1.1.1
The
intervention
The RDT program in Victoria has two components – random roadside drug testing for drug detection in oral fluids and a media campaign to publicize both the program and the hazard of drug driving.
1.1.1.1
Random
roadside
drug
testing
The RDT program is conducted in various locations across metropolitan Melbourne and regional areas in Victoria. The location and time of the RDT operation are decided by the police based on contemporary intelligence [9]. There are three potential intervention target groups from an operational viewpoint in order to maximise detection. These groups are motorists in areas of high drug use prevalence, high‐risk drug users associated with the road transport industry and high‐risk drug users associated with the ‘dance and rave’ setting [9].
Drug testing is conducted by randomly intercepting small groups of drivers from the traffic passing through the police checkpoints. The size of each randomly selected group is dependent on the availability of police officers on the testing site, i.e. as random as practically possible. There are three stages in the testing procedure for drivers intercepted during a RDT operation, as illustrated in Figure 1 (p.4). First, a preliminary breath test for alcohol is conducted to determine whether legally prescribed limits for the equivalent blood alcohol concentration (BAC) has been exceeded. The current BAC limit in Australia for a full licensed driver is 0.05g/100mL and a zero limit for drivers holding a commercial or probationary license [1]. For those who fail the first screening test, a second evidential breath test for alcohol is conducted in a police vehicle, commonly known as the ‘booze/drug’ bus. The driver is not further tested for the presence of drug if a positive test for alcohol is confirmed. This is because the judiciary process for drink‐driving prosecution is quicker, simpler and more cost‐effective and at the same time resulting in the same road safety outcome i.e. the suspect is sanctioned for the errant behaviour.
For those drivers who test negative to alcohol, a preliminary test is conducted to detect the presence of cannabis (THC), methamphetamine (MA) and MDMA in the saliva. This is done using a device known as DrugWipe® II. This device indicates the presence of drugs by showing a clear band after swiping the top of the tongue and being incubated for 5 minutes in a capped device. Drivers with a negative DrugWipe® test are allowed to continue driving without further test. Drivers with a positive test are required to provide 1mL of saliva sample for the second test in a police vehicle.
Figure 1: Procedure of conducting random roadside drug testing in Victoria
The police members from the
dedicated testing unit travel to
the testing location and set up
RDT station.
Police team leader
at the dedicated
testing unit
arranges the staff
and selects the
location of testing.
Police member commence random
testing of drivers after 15 minutes
of setting up the testing station
Police officer directs driver to stop
vehicles in designated spot on side
of road
Driver is under limit and
is allowed to continue
driving
1. Alcohol breath test
Police officer explains reason
they've been stopped and takes
Breath sample (2 minutes)
Driver is drug free and is
allowed to continue
driving
2. Drug Test I ‐
DrugWipe II Twin
Police officer perform first test for
drug on DrugWipe (5 minutes)
Driver is drug free and is
allowed to continue
driving but collected
sample is sent to lab for
verification
*Not prosecuted if tested
+ve in lab after ‐ve Cozart
3. Drug Test II – Cozart/Rapiscan
Police officer takes 2nd saliva
sample on Cozart (Drug free drivers
take 2‐10 minutes and 6 min result
reading; Drug affected takes 20‐30
and reading takes about 10 min)
Driver is asked to step out of
the vehicle and officer asks
further questions & conducts
further evidential
investigation for alcohol.
Send half of the collected
saliva sample (or collect blood
sample if saliva is not
available) to laboratory for
evidential verification Person appears in court at least 2 weeks later to defend charge. Media campaign +ve Random roadside drug testing +ve +ve ‐ve ‐ve ‐ve ‐ve NO FURTHER DRUG TEST ‐ve +ve
For the second on‐site test, a device known as Cozart® is used to collect and dilute a 1mL saliva sample to 3mL. An aliquot of this diluted sample is analysed in an instrument called Rapiscan®, which indicates the presence of drugs electronically. For drug‐free drivers, the average time for saliva collection is 2 to 10 minutes and reading takes a further 6 minutes. For drug‐affected drivers, the test may take 20 to 30 minutes for saliva collection and 10 minutes for reading [8]. Note that blood specimens are collected from individuals unable to provide adequate amount of saliva sample by an ‘on‐call’ nurse from a contracted agency.
Drivers with a negative Rapiscan® result are allowed to continue driving, but their saliva samples are sent to the laboratory for verification purpose. Note that drivers who are later found to be positive to drugs by the laboratory tests despite passing the onsite Cozart/Rapiscan test (i.e. false negative) are not prosecuted. Those drivers who are tested positive following a Cozart/Rapiscan test are prohibited from driving for 4 to 12 hours, depending on the detected substance. These drivers will be formally prosecuted once the evidential laboratory tests confirm the presence of the prescribed drugs in saliva or blood.
1.1.1.2
Media
campaign
A media campaign is an essential part of a RDT program because it publicizes the program’s existence, operation and the hazards of drug driving. The rationale for the media campaign on drug driving is based on the theory of deterrence. The effectiveness of similar campaigns in the random breath testing program for alcohol have been demonstrated [11].
To date, four phases of the advertising campaign on drug driving have been implemented in Victoria by the Transport Accident Commission (TAC) [12]. These phases of advertising campaign were launched approximately biennially since the program inception in December 2004. The first two phases of the campaign aimed to communicate the RDT agenda, whereas the third and fourth were to educate the public about the danger of ‘drug driving. The first phase of campaign coincided with the legislative trial period in 2004‐2005. As a trial, it advertised drug testing activities to the public only through radio, printed press and outdoor media at various locations such as transport depots and long‐haul truck stops. Advertising on commercial televisions were introduced in subsequent phases of the campaign. Advertising materials and the full campaign history can be found on the TAC website: www.tacsafety.com.au.
1.1.1.3
Effectiveness
1.1.1.3.1 Detection
During the 12‐month legislative trial [8], Victoria Police performed 13,176 roadside drug tests. A total of 330 saliva or blood specimens were sent to the laboratory for confirmatory tests. Of these samples, 313 Victorian drivers were confirmed as positive cases of driving under the influence of drugs. In addition, 128 drivers were found to have alcohol above the legally permissible level (Table 1). There were 17 cases of inconsistent results amongst the 330 samples sent to the laboratory due to false positives by one or both of the on‐site devices. This corresponded to a positive predictive value3 (PPV) of 0.948. Negative predictive value3 cannot be calculated because onsite false negative rate of DrugWipe® II is not known.
Table 1: Prevalence of drug driving in Victoria
Substance type Small vehicle drivers
(n=9,202)
Large vehicle drivers
(n=3,974) All drivers (n=13,176) Drugs 257 (2.8%) 56 (1.4%) 313 (2.4%) THC* 77 10 87 MA‡ 215 54 269 MDMA§ 170 0 170 Amphetamines + THC 70 8 78 Alcohol† 123 (1.1%) 5 (0.1%) 128 (1.0%) *Cannabis; ‡Methamphetamine; §Methylenedioxy‐methamphetamine; †Drugs may be present in these drivers as positive alcohol breath test precluded subsequent drug tests Source: Drummer and colleagues [8].
In the trial, a majority of those confirmed to have driven under the influence of drugs were males (81%) [8]. The age distribution for confirmed ‘drug drivers’ was skewed to the right, with a mean age of 28.2 years [8]. The annual prevalence of drug driving amongst screened drivers during the trial period was approximately 2.4%. The types of drug detected amongst intercepted drivers, in descending order of prevalence, were Methamphetamine, MDMA and THC (Table 1). Similar findings were reported by Boorman and Owens [9], who analysed the data collected from 2004 to 2006. With a total of 25,317 drivers tested for drugs during the 2‐year period, the prevalence of drug driving in the screened population was approximately 2.2% (565 persons). The PPV for the test device was estimated as 0.982 (565/575). Again, ‘drug drivers’ were predominantly males and aged
3
Positive predictive value (PPV) measures the precision of the test in accurately identifying individuals with the condition
of interest. Negative predictive value (NPV) measures the precision of the test in accurately identifying individuals without
between 18 to 25 years. Methamphetamine was the illicit substance most often detected, followed by MDMA and THC [9].
It is important to note that the observed prevalence of drugs detected in intercepted drivers was inconsistent with the prevalence of their use in the general Australian population [13], their detection amongst Australian drivers who were fatally injured in drug‐related road traffic accidents [14], and with the self‐reported prevalence of drug driving amongst 781 motorists in Queensland [15]. In all three of these contexts, the prevalence of cannabis was higher than that for MA and MDMA.
There are at least three possible explanations for this discrepancy. First, drug driving might have been more prevalent amongst amphetamines users than cannabis users, as indicated by data from the RDT trial. Second, drivers targeted by the RDT operation might have been different from the general drug‐driving population. Finally, the on‐site sequential tests might be more sensitive to the presence of amphetamines than cannabis. The first explanation is unlikely because the propensity to engage in risky behaviour is most probably similar between amphetamines users and cannabis users. In fact, in the analyses presented by Drummer and colleagues [14], cannabis was the drug most commonly implicated with fatal road accidents in Australia. The second explanation might partly explain the discrepancy because large vehicle drivers and those who attended ‘dance and rave’ party were more likely to use MA and MDMA [16, 17]. The inconsistency might be also due to the different sensitivities of the device in detecting various drug groups. Davey and colleagues [18] noted preliminary evidence that amphetamine type substances were more easily detected by Cozart/Rapiscan than THC because of the lower detection threshold and the longer time that they remained in oral fluid. Thus, it is likely that drivers under the influence of cannabis were under‐ detected by the current devices and/or screening method.
1.1.1.3.2 Deterence
The deterrent effect of the Victorian RDT program has not been estimated. Specific deterrence could be estimated by determining the re‐arrest rates amongst first‐ever offenders. To date, there is no such study reported for the Victorian program. A study by Holmgren and colleagues [19] conducted in Sweden found that, despite having a zero‐tolerance law for driving under the influence of all licit and illicit psychoactive drugs, a high proportion (37.7%) of the arrestees for drug driving from 2001 to 2004 were repeat offenders. On the other hand, parallel evidence from the RBT program for alcohol suggested that punitive measures and adequate publicity about the certainty of punishment have reduced ‘drunk driving’ [7, 20, 21]. For the general deterrence of the RDT program, precise
ascertainment is impossible because the counterfactual of who would have driven in the absence of a RDT program is not known. General deterrence could, however, be inferred from research that examined self‐reported perceptions and experience of the RDT program.
Degenhardt and colleagues [16] reported a study that surveyed the risk perceptions towards drug driving amongst 273 attendees of four nightclubs in Victoria. A majority of the volunteered respondents were aware (70%) and supportive (65%) of the RDT program. Thirty nine percent of the respondents reported that the presence of the program would change their drug‐driving behaviour by either not driving or not taking drugs [16]. Mallick and colleagues [22] reported an internet‐based survey about drug driving in Australia. Table 2 presents the age‐ and gender‐specific prevalence of drug driving amongst respondents of this internet survey [22]. The survey found that the percentage of drivers who had driven under the influence of alcohol was much lower than that of drug driving. This indicated that the level of deterrence was much higher amongst alcohol drinkers than drug users. Note however that the actual number of drunk drivers was higher than drug drivers because of the higher prevalence of alcohol use.
Table 2: Percentages of drug drivers amongst users of sample size (n), by age group and substance
Age groups
Driving under the
influence of: 16‐19 20‐29 30‐39 40‐49 50‐59 60+ Alcohol 17.5 (n=234) 21.4 (n=1923) 11.7 (n=1546) 10.6 (n=1230) 8.3 (n=928) 4.1 (n=368) Cannabis 57.5 (n=97) 49.5 (n=748) 49.0 (n=498) 60.0 (n=251) 47.3 (n=91) 10.0 (n=234) Ecstasy (MDMA) 47.4 (n=76) 42.0 (n=633) 27.4 (n=259) 26.0 (n=77) 50.0 (n=15) ‐ Methamphetamines 58.5 (n=53) 55.7 (n=533) 44.0 (n=225) 53.0 (n=72) 54.0 (n=13) ‐ Source: Mallick and colleagues [22]
The reasons for not drug driving were also explored in this study [22]. More than 50% of the internet respondents who had used at least one illicit drug reported that the main reasons for not drug driving were the perceived impairment following consumption, and concerns for the safety of oneself and others. “Worried about getting caught by the police” was the reason given by 38.5%, 45.4% and 41.5% of drivers who reported using cannabis (n=225), methamphetamines (n=114) and ecstasy (n=170), respectively [22]. These findings suggested that drug users may refrain from drug driving for various reasons, not solely fear of being apprehended by the police [22].
While this study provided valuable insights into drug driving in Australia, several caveats should be noted. Sampling biases were a major validity issue because the recruitment was based on self‐ selection through the internet, which required the participants to have access to the internet and to be computer literate. In fact, these selection biases resulted in a sample with higher educational attainment than that in the general Australian population [22]. The recruited participants were also more likely to be employed, and to be employed in communications, finance/insurance, the government and health sectors. In addition, common to all cross‐sectional internet‐based surveys, this study was dependent on self‐reported information that could not be verified against the actual identity and status of the participants [22]. Thus, the findings were probably not representative of a typical drug‐using and drug‐driving population.
In summary, it is difficult to accurately ascertain the deterrent effects of an RDT program. Whilst cross‐sectional surveys were informative about the approximate level of deterrence, there were significant levels of uncertainty in estimating the effect because of concerns about the research methodology. It is also important to note that the deterrent effects of a program may vary significantly with respect to time and context. Homel [20] noted that “deterrence is inherently an unstable psychological process” (p.30). It is highly dependent on a myriad of factors such as the continuity of the program, severity of the punitive measure, perceived certainty of being apprehended and perceived moral disapproval from friends and community if apprehended [7, 15]. Therefore, it is anticipated that the overall deterrence of the RDT program may fluctuate from time to time, and from one context to another.
1.1.2
Aim
Given the dynamic nature of deterrence and that the absence of information on the deterrent effects of the Victorian RDT program, this study conducted a threshold analysis that examined the effects of various hypothetical levels of deterrence on the incremental cost‐effectiveness of the RDT program. The comparator was a scenario where the RDT program was not implemented in Victoria in 2004‐2005. As mentioned earlier, prior to December 2004, Victoria Police only had the authority to perform sobriety tests on individuals who exhibited aberrant driving behaviour. Therefore, the detection rate in randomly intercepted drivers observed during the trial period reflected the incremental changes of introducing the RDT program.
1.2
Method
1.2.1
Model
structure
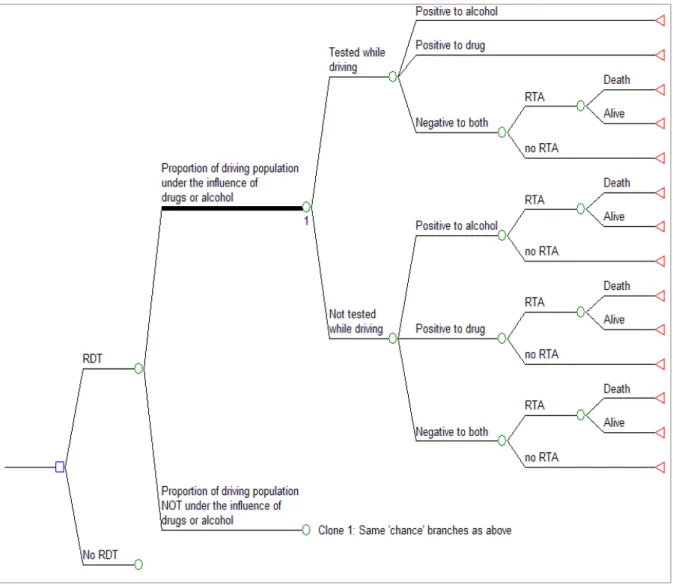
A decision‐analytic model was constructed to evaluate the incremental costs and effects with and without the RDT program. The model was applied for a single cohort of individuals aged 18 to 60 years in 2005 according to the trial [8]. The structure of the decision tree is displayed in Figure 2. This decision model first assesses the probability of being impaired by drugs or alcohol in the general driving population in Victoria. It then assesses the effectiveness of the RDT program in screening and detecting impaired drivers. Finally, the model assesses the likelihood of road traffic accidents (RTA) and related fatalities according to the increased risks of RTAs in drivers who are affected by drugs or alcohol. Note that the RDT program aims to prevent drug users from driving while being affected, rather than preventing drug use per se.
Figure 2: Decision‐analytic model for random roadside drug testing (RDT) in Victoria
Key: RDT: Random roadside drug testing; RTA: Road traffic accidents
1.2.2
Model
parameters
1.2.2.1
Age
‐
specific
prevalence
of
drug
or
alcohol
in
the
Victorian
driving
population
Two factors were taken into account in this model when estimating the prevalence of drug or alcohol in the Victorian driving population – the prevalence of alcohol and drug use at different levels of use, and the levels of deterrence on drug or drunk driving. The method used to estimate the prevalence of drug driving is described below using cannabis as an example. The same method was applied to methamphetamine, MDMA and alcohol.
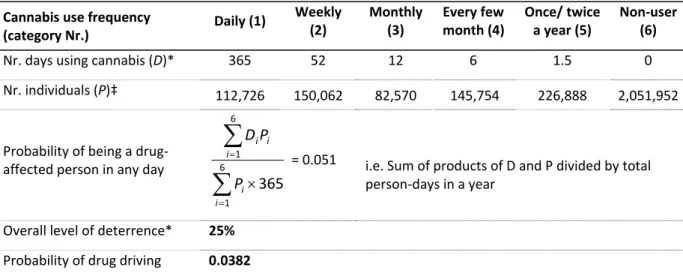
The first step was to determine the probability of a person being affected by cannabis in any day. Based on the prevalence figures reported in the 2004 National Drug Strategy Household Survey (NDSHS), the total person‐days of using cannabis was calculated by summing the products of the number of days using cannabis and the number of individuals at each level of use (Table 3). The calculated figure was divided by the total population person‐days in 2004, which gave the probability of being a drug‐affected person in any day. Although the estimation was based on prevalence of cannabis use in the general Australian population, the derived probability was assumed to be the same for the Victorian driving population. Hence, this step assumed that patterns of drug use amongst motorists in Victoria were the same to those in the general population in Australia.
Table 3: Estimating the probability of cannabis use in any day for individuals aged 20 to 29 years
Cannabis use frequency
(category Nr.) Daily (1) Weekly (2) Monthly (3) Every few month (4) Once/ twice a year (5) Non‐user (6) Nr. days using cannabis (D)* 365 52 12 6 1.5 0 Nr. individuals (P)‡ 112,726 150,062 82,570 145,754 226,888 2,051,952 Probability of being a drug‐ affected person in any day
6 1 6 1 365 i i i i i P P D = 0.051 i.e. Sum of products of D and P divided by total person‐days in a year Overall level of deterrence* 25% Probability of drug driving 0.0382 * Assumed; ‡2004 National Drug Strategy Household Survey [13]The next step was to incorporate the ‘deterrent factor’. This factor accounted for the fact that some drug‐affected individuals would have abstained from drug driving for various reasons, including their knowledge about the hazard of drug driving and the threats of being apprehended by the police. In
the example shown in Table 3, assuming 25% of the drug‐affected persons were deterred, the overall prevalence of drug driving was estimated at 3.82% in the Victorian drivers aged 20 to 29 years. These steps were repeated to estimate the prevalence of drug and drunk driving in the presence of MA, MDMA and alcohol, for all other age groups. For alcohol, the prevalence above BAC of 0.05g/100mL was estimated by including only those who consumed alcohol at hazardous or harmful levels [13].
Although the abovementioned method provided information about the overall prevalence of individual substances in the driving population, multiple substance use must be adjusted for. This is because concomitant use of multiple substances is common amongst illicit drug users and drug‐ driving cases should not be double counted if they used more than one drug. The prosecution and severity of penalty for drug driving were not dependent on the number of illicit drugs detected. The 2004 NDSHS reported that 86.2% of these drug users had used cannabis at least once at the same time as alcohol [13]. Drug users also reportedly used methamphetamine (27.9%) and MDMA (24.3%) together with cannabis. However, these figures did not indicate the exact frequency of other substances use at the same time when using cannabis i.e. did not ask “how often methamphetamine was used at the same time when using cannabis?” There was only one study in the literature that reported concurrent (during the same period) and simultaneous (at the same time of consumption) drug and alcohol use [23]. However, this study was based on data collected in the 2000 National Alcohol Survey in the United States [23] which was unlikely to be applicable within Australia. Given the lack of information, this model used the maximum probability estimated for individual substances to approximate the overall probability of drug driving. This step assumed that the lesser used substances were subsets of the more commonly used substance.
1.2.2.2
Age
‐
specific
probability
of
being
tested
while
drug
driving
The probability of being tested while drug driving was estimated according the following formula, where n is the total number of roadside drug tests conducted in 2004‐2005, N is the population size in Victoria by age, L the age‐specific proportion of licensed drivers in Victoria, and P is the age‐ specific prevalence of drug driving, estimated in the previous section.
P L N n g DrugDrivin Tested ) | Pr(
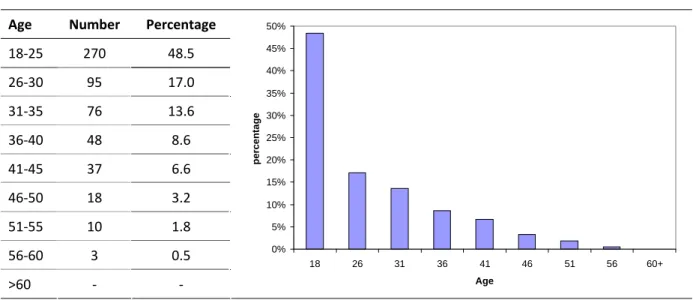
The estimation took into account the observed age distribution of those who were tested positive to drugs (Table 4, p.13) [9].
Table 4: Age distribution of drivers processed for a drug driving offence from Dec 2004 to Dec 2006
Age Number Percentage
18‐25 270 48.5 26‐30 95 17.0 31‐35 76 13.6 36‐40 48 8.6 41‐45 37 6.6 46‐50 18 3.2 51‐55 10 1.8 56‐60 3 0.5 >60 ‐ ‐ 0% 5% 10% 15% 20% 25% 30% 35% 40% 45% 50% 18 26 31 36 41 46 51 56 60+ Age percenta ge Source: Boorman and Owens [9]
1.2.2.3
Precision
of
onsite
sequential
tests
The positive predictive value (PPV) of the onsite sequential tests was estimated to be between 0.95 and 0.98 (section 1.1.1.3). While a high PPV is important to minimise unwarranted resource use associated with processing false positive cases, a high negative predictive value (NPV) is more important from a prevention perspective. This is because false negative cases (i.e. screened but undetected drug drivers) may later cause road trauma that could/should have been prevented. However, the NPV of the onsite sequential tests is currently unknown. For simplicity, this model assumed that the sequential tests are perfect and have a 100% PPV and 100% NPV. Nonetheless, this evaluation tested this assumption in sensitivity analysis using a PPV and NPV of 0.95.
1.2.2.4
Risks
of
road
traffic
accidents
and
case
fatality
rate
The baseline risks of road traffic accidents (RTA) and the RTA case‐fatality rates were estimated based on the data reported in the 2003 Australian Burden of Disease and Injury (BoD) study [24]. For those drivers who were under the influence of drugs and alcohol, the increased risks of RTA were estimated according to the estimates reported by Drummer and colleagues [14]. This case‐control study involved 3,398 fatally‐injured drivers in three states of Australia during various periods in the 1990s. It was found that drivers who were under the influence of any drugs had 1.68 (95% CI: 1.29‐ 2.18) times the odds of being culpable of causing the accidents than drivers who were drug‐free. It also found that drivers who had greater than 0.05g/100mL of blood alcohol concentration had 6.0 (95% CI: 4.0‐9.1) times the odds of being culpable of causing the accidents than drivers who were alcohol‐free [14].
1.2.3
Model
inputs
and
key
assumptions
All model inputs are listed in Table 5. To reiterate, the two key assumptions applied in this model were:
I. The prevalence of drug use in the Australian general population was the same as drug use in the Victorian driving population;
II. The onsite sequential drug tests were perfectly accurate – 100% PPV and NPV
Table 5: Model input data
Age 2005 Vic Populationa Licensed driverb Baseline % DUID*c % DUID testedd % non‐DUID testedd Tested +ve drugd Tested +ve alcohold RTA† Incidencee RTA case fatalitye Incident YLD‡e
HALE§f RTA costg
18 68,898 63.0% 1.7% 1.8% 1.4% 71.0% 29.0% 0.00202 0.06048 0.2896 27.0 $13,062 19 70,324 26.8 20 71,750 80.8% 3.8% 1.8% 1.4% 71.0% 29.0% 0.00304 0.06114 0.2858 26.6 $13,062 21 71,049 26.4 22 71,770 26.3 23 71,982 26.1 24 71,385 25.9 25 70,133 88.9% 3.8% 1.8% 1.4% 71.0% 29.0% 0.00243 0.05258 0.4684 25.6 $13,087 26 69,486 0.8% 0.7% 25.4 27 69,092 25.2 28 69,083 25.0 29 69,691 24.8 30 71,839 93.6% 2.6% 0.8% 0.7% 71.0% 29.0% 0.00189 0.06335 0.2266 24.5 $13,087 31 74,380 0.7% 0.5% 24.3 32 75,932 24.0 33 79,669 23.8 34 81,581 23.5 35 77,988 93.6% 2.6% 0.7% 0.5% 71.0% 29.0% 0.00189 0.06335 0.2894 23.2 $15,155 36 77,765 0.4% 0.3% 23.0 37 75,109 22.7 38 73,382 22.4 39 73,691 22.1 Table 5 continues next page
Table 5 (continues) Age 2005 Vic Populationa Licensed driverb Baseline % DUID*c % DUID testedd % non‐DUID testedd Tested +ve drugd Tested +ve alcohold RTA† Incidencee RTA case fatalitye Incident YLD‡e
HALE§ RTA cost
40 74,311 94.5% 1.8% 0.4% 0.3% 71.0% 29.0% 0.00156 0.06397 0.2026 21.8 $15,155 41 75,982 0.3% 0.2% 21.5 42 77,065 21.2 43 76,660 20.8 44 76,112 20.5 45 74,473 94.5% 1.8% 0.3% 0.2% 71.0% 29.0% 0.00156 0.06397 0.2058 20.1 $15,630 46 73,797 0.1% 0.1% 19.8 47 71,627 19.4 48 70,044 19.1 49 70,115 18.7 50 67,602 92.8% 1.6% 0.1% 0.1% 71.0% 29.0% 0.00130 0.07202 0.2133 18.3 $15,630 51 65,847 18.0 52 65,750 17.6 53 63,602 17.2 54 63,190 16.8 55 62,279 92.8% 1.6% 0.1% 0.1% 71.0% 29.0% 0.00130 0.07202 0.1997 16.3 $19,926 56 60,329 0.0% 0.0% 15.9 57 61,458 15.5 58 63,450 15.1 59 53,620 14.6 60 ‐ ‐ ‐ ‐ ‐ ‐ ‐ ‐ ‐ ‐ ‐ ‐ Keys: * Driving under the influence of drugs; † Road Traffic accidents ‡ Years lived with disability § Health adjusted life expectancy Sources: a Australian Bureau of Statistics [25] b Ausroads [26] c Calculated based on assumed baseline deterrence levels as specified in (Table 6, p.18) d Drummer and colleagues [8] e Beggs and colleagues [24] e Calculated based on life table and Beggs and colleagues [24] g Mathers and colleagues [27]
1.2.4
Analysis
1.2.4.1
Benefits
As the common metric to evaluate health benefits in the ACE‐Prevention project, the Disability Adjusted Life Year (DALY) was used to quantify the intervention effect of the RDT program in Victoria. The DALY is a composite population health measure that sums the Years of Life Lost due to premature mortality (YLL) and the equivalent ‘healthy’ Years Lost due to Disability (YLD) [24].
In this model, the YLL and YLD were calculated according to the modelled incidence of drug‐related road traffic accidents, with and without the RDT program. The YLL was calculated using the following formula:
YLL = D e D*L 1
whereexpectancy D is the in the annual Australian discount population rate (3%) of and 2003 L is at the the health age of‐adjusted death life
The disability associated with non‐fatal road traffic accident (RTA) was estimated by applying the age‐specific ‘incident YLD’ due to RTA to each incident RTA case. The ‘incident YLD’ was estimated from the 2003 Australian BoD study [24], by dividing the total YLDs estimated for RTA by the total number of non‐fatal RTA cases reported in 2003.
1.2.4.2
Costs
A gross‐costing approach was used to estimate the costs of conducting the drug‐testing operation and the running of media campaign in 2004‐2005. The cost data associated with the RDT operation was collected in a semi‐structured interview with an officer from Victoria Police who was experienced in the implementation of the RDT program. This interview has been approved by Victoria Police (Project Number: RCC 543). The costs associated with the media campaign were sourced from the Transport Accident Commission (TAC) in Victoria through personal communication.
1.2.4.2.1 Costs included
During the trial period, operation of the RDT program in Victoria was implemented by a specialised unit within Victoria Police. All resources, including human resources and equipments, were dedicated solely for the purpose of conducting the RDT program. The main resources required for the program implementation included one sergeant and eight lower ranking police officers, one fully equipped ‘drug bus’, two police vehicles and drug test devices. Resources were also needed for the
storage, transport and forensic testing of collected samples. According to Victoria Police, the operation of the 2004‐2005 operation cost $1.3 million for the testing and an additional $1.0 million for human resources. All prices were nominal prices in 2004‐2005.
The Phase I media campaign on drug driving was run between December 2004 and June 2005 by TAC to publicise the launching of the RDT program. A range of advertising media were employed – press, radio, community television, convenient locations (e.g. automated teller machine, truck stops), and outdoor media. The total reported costs for this phase of the campaign were $485,518. It is important to note that there was no advertisement on commercial televisions during the Phase I campaign, which would increase the cost substantially. Advertising on commercial televisions was only implemented in Phase II (December 2006), Phase III (August 2008) and Phase III (July 2009) of the campaign.
This study also included the anticipated health‐sector costs associated with road traffic accidents that would have incurred in the absence of the RDT program (i.e. cost offsets). The figures were obtained from the Disease Costs and Impacts Study [27] undertaken by the Australian Institute of Health and Welfare (AIHW). The AIHW adjusted the figures to costs in 2003 by applying the relevant inflators, which accounted for inflation in healthcare costs and for population growth over time.
1.2.4.2.2 Costs excluded
This evaluation did not estimate the opportunity costs of motorists’ time when they were being tested for alcohol and drugs. For motorists who were negative to both alcohol and drugs, the amount of time needed for the tests was minimal, with the alcohol breath test taking about 30 seconds and the DrugWipeII test taking 5 minutes. The opportunity cost of time would be minimal because it would have been valued as ‘leisure time’ given that most of the tests were conducted from the evening into early hours of the morning [8]. For drug positive motorists, the sequential tests took much longer to complete but it is reasonable to assume that the opportunity cost of time for intoxicated individuals is nil.
The ACE‐Prevention methodology also specified that all interventions were evaluated as operating in a ‘steady state’. This means that the RDT program was evaluated from a long‐run perspective where it was implemented with its full efficacy potential. Accordingly, the costs associated with the training of police officers, the development of media materials were excluded in this evaluation. Given the primary focus on health‐sector outcomes, this evaluation also excluded consideration for the economic costs associated with court proceedings, license suspension, as well as productivity gains
1.2.4.3
Threshold
analysis
A threshold analysis was performed to assess the impacts of different hypothetical levels of deterrence on the incremental cost‐effectiveness ratio of a RDT program. The levels of deterrence were estimated based on the study by Mallick and colleagues [22], which reported the age‐specific proportions of drug and drunk drivers amongst the internet respondents who had used drugs or alcohol. The levels of deterrence were calculated as one minus the proportions of drug or drunk drivers, reported previously in Table 2 (p.8). Lower figures were assumed for the baseline deterrence level to ‘adjust’ for self‐selection bias in the study of Mallick and colleagues [22], as discussed previously in section 1.1.1.3.2. Note also that, in another survey of a convenience sample of regular ecstasy users in Victoria (n=100), 71% of respondents reported they had driven within one hour of taking drugs in the preceding 6 months [28]. This model assumed a stable deterrence level for alcohol because the random breath‐testing program for alcohol has been in place for many years and operating on a much larger scale than the RDT program for drug driving.
Table 6: Levels of deterrence
Deterrence levels for drug driving*
Age
group
Deterrence
for drunk
driving† Baseline Baseline+0% +5% +10% +15% +20%
18‐19 83% 25% 25% 30% 35% 40% 45% 20‐29 79% 25% 25% 30% 35% 40% 45% 30‐39 88% 35% 35% 40% 45% 50% 55% 40‐64 89% 35% 35% 40% 45% 50% 55% †Source: Mallick and colleagues [22] *Source: assumed figures with reference to the figures of Mallick and colleagues [22]
1.2.4.4
Uncertainty
Monte Carlo simulation with 2,000 iterations was implemented to determine the uncertainty of costs and effects as a result of parametric variations. Table 7 (p. 19) shows the distributions of uncertainty around input parameters. Note that although historical costs were used when costing the RDT program, 20% variations were assumed around the median values for the costs of RDT operation, human resource and media campaign to reflect the potential variations in costs across different jurisdictions in Australia due to different standards of living.
A scatter plot and cost‐effectiveness ‘acceptability curves’ (CEACs) were plotted according to the results of uncertainty analysis. The CEACs evaluated the intervention’s probability of being cost‐ effective when assessed against different willingness‐to‐pay thresholds.
Table 7: Distributions of uncertainty around input parameters
Parameter Distribution Median
[Uncertainty range] Sources
OR‡ of RTA† for drug affected drivers Lognormal [Ln(se)=0.133] Ln(1.68) Drummer and colleagues
[14]
OR of RTA for alcohol affected drivers Lognormal [Ln(se)=0.213] Ln(6.0) Drummer and colleagues
[14]
RDT§ operating costs Triangular $1,300,000 [ 20%] Median: Victoria Police
Assumed uncertainty range
RDT human resource costs Triangular $1,000,000 [ 20%] Median: Victoria Police
Assumed uncertainty range Costs for media campaign Triangular $485,519 [ 20%] Median: Transport Accident Commission Assumed uncertainty range ‡Odds Ratio; †Road traffic accidents; §Random roadside drug testing
1.3
Results
1.3.1
Prevalence
of
drugs
or
alcohol
in
Victorian
driving
population
Table 8 shows the estimated prevalence of drugs or alcohol in the driving population in Victoria aged between 18 to 59 years, at different levels of assumed deterrence. The estimated prevalence was the highest amongst those aged 20 to 29 years. The prevalence declined as the levels of deterrence increased from the baseline level to 20% above the baseline level for those aged 18 to 39 years. For those aged 40 years and above, the prevalence was not affected by the level of deterrence for drug driving because many fewer used drugs than drank alcohol. A stable level of deterrence for drunk driving was assumed following the introduction of the RDT program because the random breath‐ testing program for alcohol has been in place since late 1970s and has been implemented consistently on a much larger scale than the RDT program. Therefore, while the RDT program might reduce the prevalence of drugs in drivers aged above 40 years, they might still be caught for drunk driving.
Table 8: Prevalence of drugs or alcohol in Victorian driving population at different levels of deterrence for
drug driving
Level of deterrence for drug driving
Age group Baseline* Baseline*+5% +10% +15% +20%
18‐19 0.017 0.016 0.015 0.014 0.013 20‐29 0.038 0.035 0.033 0.030 0.028 30‐39 0.026 0.022 0.020 0.018 0.016 40‐49 0.018 0.018 0.018 0.018 0.018 50‐59 0.016 0.016 0.016 0.016 0.016 *Refer to Table 6 (p.18)
1.3.2
Cost
‐
effectiveness
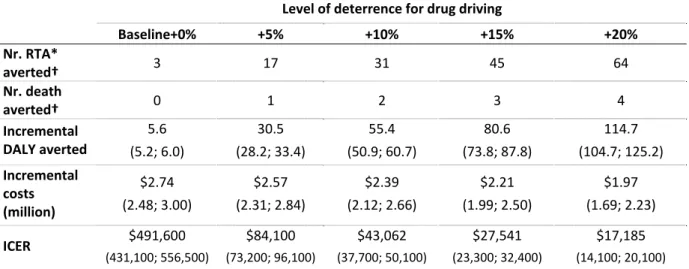
Table 9 shows the cost‐effectiveness results of the RDT program in Victoria. The evaluation estimated that, if there were no incremental deterrence following the introduction of the RDT program, only 3 cases of accident would be averted through the detection of drug drivers. The number of RTA cases averted would increase significantly to 64 cases if the program attained 20% incremental deterrence above the baseline level. When modelling the number of deaths, this evaluation did not find that the RDT program would prevent a significant number of fatal RTAs attributable to drug use. With a 20% increment in deterrence, only 4 cases of drug‐related road fatality would be averted.
Table 9: Cost‐effectiveness results of the random roadside drug‐testing program in Victoria‡
Level of deterrence for drug driving
Baseline+0% +5% +10% +15% +20% Nr. RTA* averted† 3 17 31 45 64 Nr. death averted† 0 1 2 3 4 Incremental DALY averted 5.6 (5.2; 6.0) 30.5 (28.2; 33.4) 55.4 (50.9; 60.7) 80.6 (73.8; 87.8) 114.7 (104.7; 125.2) Incremental costs (million) $2.74 (2.48; 3.00) $2.57 (2.31; 2.84) $2.39 (2.12; 2.66) $2.21 (1.99; 2.50) $1.97 (1.69; 2.23) ICER $491,600 (431,100; 556,500) $84,100 (73,200; 96,100) $43,062 (37,700; 50,100) $27,541 (23,300; 32,400) $17,185 (14,100; 20,100) ‡Figures are reported here as median and 95% uncertainty range in brackets *RTA: road traffic accidents; DALY: Disability adjusted life years; ICER: incremental cost‐effectiveness ratio
†Although uncertainty analysis did include variations around the relative risks of being involved in a RTA under the
influence of drugs or alcohol, no variations were observed because both RTA and road fatality were relatively rate events.
When summarising the overall impacts using Disability Adjusted Life Years (DALYs), the RDT program in Victoria would prevent only 5.6 DALYs if assuming a 0% incremental deterrence. The estimated DALYs averted increased substantially to 114.7 years if the program could deter 20% of the potential drug drivers. These effects were achieved at an estimated total incremental cost of $1.97 million to $2.74 million. The incremental costs were dependent on the assumed levels of deterrence, which resulted in different totals of cost savings from the number of accidents prevented.
In comparison to the scenario where the RDT program was absent, this evaluation found that implementing the RDT program in Victoria was likely to be cost‐effective, if it deterred at least 10% of potential drug drivers in the Victorian population from driving while intoxicated (Table 9). At 10% incremental deterrence, the ICER was estimated to be $43,062 ($37,700; $50,100). This ICER could
be considered as cost‐effective using the commonly assumed value‐for‐money threshold of $50,000 per DALYs averted in Australia. This threshold was used as the indicative willingness‐to‐pay threshold for a DALY averted for the Australian policy makers, according to the recommendations by the World Health Organization [29]. The findings from the analyses were further illustrated in the scatter plot of Figure 3 and the cost‐effectiveness acceptability curve in Figure 4. The cost‐effective findings did not differ much (ICER=$44,600, 95% UI: $38,300; $51,900) when PPV and NPV were assumed as 0.95, because of the relatively small number of tests conducted.
Figure 3: Uncertainty analysis
Figure 4: Cost‐effectiveness acceptability curves
1.4
Discussion
This study applied decision‐analytic modelling to examine the effects of varying hypothetical levels of deterrence on the cost‐effectiveness of the RDT program in Victoria. The Victorian RDT program was selected as the basis of this evaluation because the effectiveness of this world‐first program has been formally evaluated and the results reported in peer reviewed journals [8, 9]. The RDT programs in other Australian jurisdictions have either not been formally evaluated or the results of such evaluations not been made publicly available. Nevertheless, findings from this evaluation may be used to inform decision making in other jurisdictions where similar programs are in place.
This study estimated that the prevalence of drugs and alcohol in the Victorian driving population ranged from 1.6% in those aged 40 years and above, to 3.8% in those aged between 20 and 29 years. These figures were consistent with the prevalence of drugs (2.4%) and alcohol (1%) amongst screened drivers in the 1‐year RDT operation.
This evaluation indicates that economic value of the RDT program depends critically on the incremental level of deterrence it attains, rather than the number of drug drivers it detects. At the current scale of implementation, the detection of drug drivers alone probably averts only a small number of road traffic accidents. However, the number of accidents averted increases significantly if the program achieves incremental deterrent effects above the baseline level. According to the threshold analysis, the Victorian RDT program would need to deter an additional 10% of potential drug drivers in order to be a cost‐effective intervention. However, even if the RDT deterred an additional 20% of drug‐affected persons from driving, its overall impacts on the number of road fatalities would be minimal.
The findings of this study raise an important question: How likely is it that an additional 10% of potential drug drivers will be deterred by the current scale of RDT and media campaign? Whilst experience from the alcohol random breath‐testing (RBT) program has demonstrated that 10% increase in the level of deterrence is a reasonably realistic goal (e.g. [30, 31]), some points of difference between RBT and RDT need to be noted. As discussed previously, two important factors that influence the level of deterrence are the perceived certainty of being ‘punished’ and the continuity of the program. The success of the RBT program for alcohol has been in part because of its consistently large‐scale implementation. Currently, the RBT program for alcohol conducts screening tests at a frequency that is 100 times greater than that for the RDT program. Although the RDT program may benefit from the high ‘visibility’ of the RBT operation, the objective of creating
certainty of punishment may not be achieved because a larger proportion of drug drivers remain untested and un‐penalised.
This raises another pertinent question: should the current RDT operation be expanded to emulate the scale of the RBT program such that sufficient level of deterrence can be achieved? The main obstacle with this proposition is that current drug testing technology does not permit the RDT program to be expanded at reasonable economic costs. Firstly, the current drug‐testing procedure takes at least 5 minutes and as long as 30 minutes per test. This is substantially longer than the alcohol breath test, which takes less than half a minute for each test. This means that a considerably larger police workforce is required to screen as many drivers for drugs as for the alcohol. This increases the total program costs substantially. Screening a larger driving population for drugs may also impose significant time costs upon drivers, most of whom do not use drugs and drive.
In addressing these issues, the Australian State of Tasmania has attempted to reduce testing time by using a ‘trace particle detection test’ as the preliminary test that precedes the oral fluid tests [32]. This screening test only takes about 15 seconds. However, this test is not currently supported by evidence. It is unclear whether the trace particle detection tests correlate with the drug use status of the driver at the time of driving. Therefore, the addition of this preliminary test may in fact increase the overall testing time and cost, with the possibility of reducing detection rate if the correlation is poor. The financial costs of the sequential drug tests are also significantly higher than the costs of conducting the alcohol breath test. For all these reasons, any expansion of the RDT program will have significant budgetary impacts, which in turn, will diminish the cost‐effectiveness of this intervention if anticipated additional benefits are not realised. In view of this, it can be argued that resources may be better used in enhancing the RBT program rather than expanding the RDT program, because drunk driving continues to be a significant problem despite the existing RBT program.
Attention should also be given to other factors that may enhance the deterrent effects of RDT. As mentioned earlier, it is known that perceived moral disapproval from friends and community is an important factor in deterring drug driving. Media campaign could potentially play a larger role in increasing social disapproval of drug impaired driving. Whilst internal research done by the Transport Accident Commission provided useful information about the level of exposure to the media campaigns, future evaluation should aim at investigating the impacts that these media campaigns have on drug‐driving behaviour of individuals and tolerance of it among peers.
Much may also be gained from improving the technical efficiency of drug testing. For example, given the costs and time required to conduct a drug test, improved devices that can test the presence of drug at much shorter time and at much lower costs will improve the overall technical efficiency of RDT. In addition, as discussed in section 1.1.1.3.1, drivers under the influence of cannabis appeared to be under‐detected by the current technology and screening method.
In summary, this economic evaluation suggests that the economic merits of the RDT program are contingent upon the level of incremental deterrence it attains, rather than on the number of drug driver it detects. The RDT program could be a cost‐effective intervention if it deters an additional 10% of potential drug drivers. Although 10% of incremental deterrence may not be an unrealistic goal, it is unclear whether it is being realised to present, and uncertain whether it can be realised given the limited size and current costs of the program, and limits on additional police resources. Notwithstanding these uncertainties, this evaluation found that the RDT program will have minimal impacts on the overall number of road deaths. Future research should focus on monitoring the level of deterrence alongside the program implementation, conducting empirical studies to ascertain the reduction in drug‐related road traffic accidents attributable to the RDT program, and improving accuracy of drug testing devices at reasonable costs. If the program continues, attention will need to be given to achieving deterrence, and improving the accuracy and reducing the time required of drug‐testing devices at reasonable costs.
1.5
Second
‐
stage
filters
analysis
Cost per DALY
averted Strength of evidence Equity Acceptability to stakeholders Feasibility of implementation Sustainability Relevance to Indigenous population
‘Other effects’ (not
captured in modelling) Incremental deterrence achieved: 0%: $491,600 5%: $84,100 10%: $43,000 15%: $27,500 20%: $17,200 “May be effective” – The effectiveness of
detection was based
on a Level IV study
and parallel
evidence for
outcome from the
random breath
testing for alcohol
Unlikely to be of
concern
Highly acceptable for
government and
community at the
current scale of
implementation
Program has been
feasibly implemented at current scale. However, the program is unlikely to be able to be expanded at reasonable cost if current scale of implementation
does not attain
adequate level of deterrence Implementation likely to be sustainable at current scale. The sustainability of the deterrent effect is unclear. Unlikely to be sustainable at
much larger scale.
Injuries resulting from
road traffic accidents
are higher in the
Indigenous population.
However, it is unclear
to what extent these
accidents were related
to drug driving.
Positive: Promoting
general road‐safety
messages
Negative: May reduce
confidence in the value
of program if it fails to
detect drug drivers or
fails to demonstrate a meaningful reduction in road fatality Decision point: Cost‐effective if at least 10% incremental deterrence were achieved Further evidence on deterrence, behavioural changes and reduction in
road traffic accident Not an issue Not likely to be an issue Feasible at current
size but not feasible
in large‐scale expansion without incurring significant costs Sustainable for current scale although unclear about deterrent effects
May be relevant to the
Indigenous population
if the high road injury
rates were related to
drug driving
Potentially having
positive benefits in
promoting general
road‐safety messages.
Public confidence needs
to be strengthened
through demonstration
of program effects
Policy considerations: At current scale of program implementation, the Victorian RDT program is likely to be cost‐effective if it could deter 10% of potential drug drivers in addition to the baseline level of deterrence. Its effectiveness and sustainability in deterring drug driving are critically dependent on the scale and the continuity of program implementation. Currently, there is an absence of evidence in demonstrating the deterrent effects of the intervention. Whilst the program is very likely to be feasible, acceptable and sustainable at current scale of implementation, the program is unlikely to have the capacity to be expanded at reasonable costs should additional levels of deterrence be required. It is important for future research to demonstrate the level of deterrence of the current program, the actual change in drug‐driving behaviour, a reduction in drug‐related road traffic accidents and improving the drug‐testing technologies.