Zackenberg Ecological Research Operations
11
th
Annual Report, 2005
Danish Polar Center 2006
11 Annual Report, 2006. – Copenhagen, Danish Polar Center, Ministry of Science, Technology and Innovation, 2006.
© 2006 Danish Polar Center
Editors Anne B. Klitgaard, Morten Rasch and Kirsten Caning Layout Special-Trykkeriet Viborg a-s
Printed by Special-Trykkeriet Viborg a-s Impression 800
Paper 80 g recycled
Front cover: DeHavilland DHC-6 Twin Otters from Iceland have connected
Zackenberg Research Station to the outer world since the start in 1995. Photo Henning Thing. Back of cover: A curious Arctic fox (Alopex lagopus) investigating the shoelace palatability of the photographer. Photo Kristian Albert.
ISBN 87-90369-81-5
This book is free of charge and may be ordered from Danish Polar Center
Strandgade 102
DK-1401 Copenhagen K Tel. (+45) 32880100 Fax (+45) 32880101 Email: dpc@dpc.dk
Contents
Executive summaryby Hans Meltofte, Charlotte Sigsgaard and Morten Rasch . . . . 5
1 Introduction . . . 9
2 Zackenberg Basic:The Climate Basis and GeoBasis programmes by Charlotte Sigsgaard, Dorthe Petersen, Louise Grøndahl, Kisser Thorsøe, Hans Meltofte, Mikkel Tamstorf and Birger Ulf Hansen . . . . 11
3 Zackenberg Basic:The BioBasis programme by Hans Meltofte (ed.) . . . . 36
3.1 Vegetation by Line A. Kyhn and Mikkel P. Tamstorf . . . . 36
3.2 The ZERO line and northern limit species by Christian Bay . . . . 42
3.3 Lichens by Eric Steen Hansen . . . . 44
3.4 Arthropods by Steen K. Frank and Jannik Hansen . . . . 53
3.5 Birds by Jannik Hansen and Hans Meltofte . . . . 57
3.6 Mammals by Line A. Kyhn . . . . 68
3.7 Lakes by Kirsten Christoffersen and Erik Jeppesen . . . . 74
4 Zackenberg Basic:The MarineBasis Programme by Mikael K. Sejr, Tage Dalsgaard, Søren Rysgaard, Egon Frandsen and Peter B. Christensen . . . . 77
5 Research projects . . . . 89
5.1 Effects of climate manipulations on processes and organisms in high arctic terrestrial ecosystems by Anders Michelsen, Susanne M. König, Lotte Illeris, Marie F. Arndal, Kristian R. Albert, Mikkel P. Tamstorf and Helge Ro-Poulsen . . . . 89
5.2 Studying effects of current UV-fluxes on high arctic vegetation (UV-B exclusion experiments) by Kristian R. Albert, Marie Frost Arndal, Anders Michelsen, Mikkel P. Tamstorf, Helge Ro-Poulsen and Teis N. Mikkelsen . . . . 90
5.3 Habitat-dependent availability of nutrients and ground water for Arctic willow growth by Niels M. Schmidt, Claudia Baittinger, Johannes Kollmann and Mads C. Forchhammer . . . . 91
5.4 Holocene vegetational and climatic changes at Zackenberg by Bent Fredskild . . . . 92
5.5 The World Herbivory Project – Zackenberg sites by Angela Moles, Line Kyhn et al. . . . . 94
5.6 Arthropod emerging patterns in the High Arctic by Niels Martin Schmidt and Toke Thomas Høye . . . . 94
5.7 Genetics analysis of dunlin in northern Europe by Liv Wennerberg and Gunnhild Marthinsen . . . . 95
5.8 Coupling freshwater run-off from catchment area of the Young Sund/ Tyrolerfjord with fjord circulation and exchange with the Greenland Sea (OPHAV) by S. Rysgaard, J. Bendtsen and S.H. Mernild . . . . 96
5.9 The origin, concentration and bioavailability of dissolved organic carbon in Young Sound. by Mikael Sejr and Colin Stedmon . . . . 98
5.10 ITACA2 Dayside aurora joint observations in the Greenland-Svalbard sector by Stefano Massetti . . . . 99
5.11 Mites at Zackenberg by Olga Makarova . . . . 100
6 Disturbance in the study areaby Jannik Hansen . . . . 102
9 Publicationscompiled by Vibeke Sloth Jakobsen . . . . 108 10 References . . . 110
In 2005, Research Station Zackenberg was open for 106 days from 19 May to 30 Au-gust. In this period 31 scientist and five lo-gisticians and staff from Danish Polar Cen-ter worked from the station. The station was visited in August by Rear Admiral Niels Wang, Royal Danish Navy, and four other guests. The field season was extend-ed due to the researchers experiences that spring melt occurs earlier and earlier at Zackenberg. Zackenberg´s branch facility at the old weather station in Daneborg was used by one scientist and one logisti-cian from 18 to 25 July, and by six scien-tists from 2 to 23 August. The total num-ber of person days at Zackennum-berg and Daneborg was 1091.
During the last four years, we have ex-perienced again and again the beating of parameter records. 2005 was no exception, as snow and ice melt was much earlier than recorded before, due to exceptionally high temperatures in the early spring. This was not restricted to the Zackenberg area, similar early snow and ice melt was found in all of southern Northeast Greenland.
At the meteorological station, positive diurnal air temperatures were recorded from 18 May and onward with only few exceptions. Monthly mean temperatures in May (–2.5°C) and June (2.7°C) were the warmest recorded during the 10 years of monitoring. July and August had mean monthly temperatures of 6.9°C and 4.7°C, respectively, which is within the range of earlier measurements. The last part of June and first part of July was characterized by relatively cold, cloudy and foggy weather, rain and drizzle. The period was followed by a warm and dry period where a record high temperature of 21.6°C was measured 21 July 18:00. This is the highest maximum temperature measured since the meteoro-logical measurements started in 1995.
During winter a pronounced hot spell was measured 26-27 January 2005 where the temperature reached 10.7°C at the me-teorological station and remained positive for 13 consecutive hours. At the snow and micrometeorological station M3 (420 m a.s.l.) the same event caused temperature
to remain positive for 22 hours with maxi-mum of 6.8°C. This episode was easily rec-ognized in the snow pack throughout most of the valley as an almost continuous ice layer of 1-3 cm. It was also the first winter where episodes of positive air tem-peratures were registered in February.
A continuous snow cover build up only in December 2004 and the main part of the snow fell between 9 December and 12 February during five major events. Maxi-mum snow depth measured at the meteo-rological station was 0.73 m (registered 12 February) almost the same as last year and in the low end of the range (0.49 m in 2000 and 1.30 m in 1999). Snow cover was, however, less extensive than measured be-fore during our 10 years of monitoring. On 10 June, the snow cover was way below previous years in most sub-zones in Zackenbergdalen, and at the meteorologi-cal station snow melt was complete 9 June, which is early compared to previous years where snow has disappeared from the ground below the sensor in the period be-tween 14 June (2004) and 3 July (1999).
During summer a total precipitation of 38 mm was measured which is close to average. Rain events primarily occurred in early and late July whereas June and Au-gust were relatively dry.
In the melting period there was a snow event 2-3 June resulting in about 5 cm of new snow in the valley.
The river Zackenbergelven started to run 3 June as a small stream upon the snow. During the following days the stream increased and from 15 June the river was no longer bordered by snow or ice. On 25 July, after a period of extremely warm and dry weather a large flood from Store Sødal made the river rise dramatical-ly and the hydrometric station was washed away by the water pressure. Prob-ably, this extreme event was caused by drainage of an ice dammed lake/reservoir in the glaciated part of the drainage basin. Due to the flood, the topography of the cross profile changed significantly and the total runoff in 2005 has not been calculated yet, as more manual discharge
measure-Executive summary
ments must be performed in order to establish a new stage-discharge relation. From 3 June to 25 July the runoff from the drainage basin was 144 million m3. Due to
the missing discharge data in the last part of the season, the total seasonal transport of suspended sediment and organic mate-rial can not be presented in this annual re-port. The maximum concentration of sus-pended sediment measured during the flood was 5.7 g/l. In 1998, suspended sedi-ment concentrations of up to 46 g/l were measured in a flood in mid August. The large difference reflects different initia-tions of the events. Whereas the flood in 1998 was initiated by heavy rain and mas-sive overland flow, the flood in 2005 origi-nated from the glaciers in the less erodible area of the drainage basin. After the peak in 2005, the concentration of suspended sediment remained at a level almost the double of before the flood for the remain-ing season, probably because of the large amount of material from the severe ero-sion along the river banks after the flood.
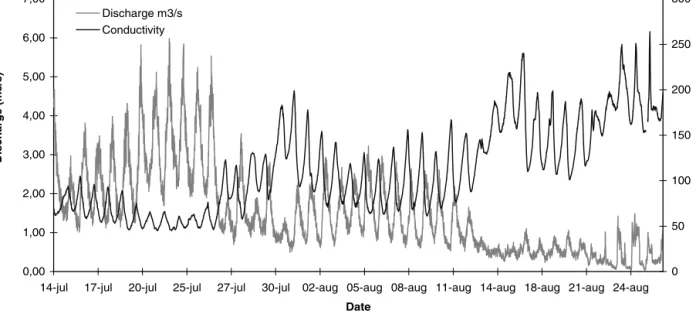
In July, a CTD-diver measuring water level, water temperature and conductivity were installed in the river from Linde-mansdalen near the confluence with Zack-enbergelven. Data from this station show that water from Lindemanselven consti-tutes on average 8 % of the total water dis-charge in Zackenbergelven in the period from 14 July to 25 July.
From 7 July the fiord Young Sund was open all the way to the sea. It is almost ex-actly the same date as the previous two years where the fiord broke up 8 July.
In the well drained Cassiope heath near the meteorological station, the average thaw depth in the gridnet ZEROCALM-1 reached a maximum of 79 cm in the end of August. This is a record so far and like-wise in ZEROCALM-2, where the average maximum thaw depth reached 68 cm. Since 2000, an almost steady increase in the active layer depth has been observed correlating with an earlier snow melt and earlier initiation of soil thaw.
At the micrometeorological station where CO2exchange rates between the
heath and the atmosphere have been mea-sured since 2000, a total of 29.6 g C/m2
ac-cumulated during the period of 21 May to 25 August 2005. This is the highest total accumulation measured so far and reveals that the Cassiope heath acts as a sink of car-bon during the summer. The growing sea-son (the period when assimilation exceeds
respiration) started almost a week earlier than registered before and lasted from 17 June to 18 August resulting in the longest growing season registered. Highest daily uptake of CO2(1.15 gC/m2) was measured
16 July.
The most marked characteristics of the ecosystems at Zackenberg during the 2005 season were the effects of the extremely early spring, which was even earlier than the previous three very early seasons, and the drought during the last few summers. The very early start of the growing season resulted in a prolonged growing season. It also resulted in the earliest flowering re-corded during the 10 years of monitoring for 23 of 28 plant plots, while flowering in four of the remaining plots resembled the earliest hitherto recorded snowmelt. Also for 11 arctic poppy Papaver radicatum, arc-tic willow Salix arcarc-tica and purple saxi-frage Saxifraga oppositifolia plots, the date of 50% open seeds capsules was the earli-est or the same as previous earliearli-est re-cords.
Despite the length of the growing sea-son, 2005 was not a top year with regard to amount of flowers produced. This is due to flower buds being established one or more growing seasons prior to flower-ing. The observed drop in numbers of flowers from 2004 to 2005 in early snow-free Dryas and Salix plots might be as-cribed to water deficiency, as an early snowmelt in conjunction with little precip-itation gave rise to a prolonged, but dry growing season in 2004. For species de-pending on a protective snow-cover, and therefore experiencing late snowmelt such as white arctic bell-heather Cassiope
tetrag-ona, there has been a positive correlation
between length of growing season the pre-vious year and amount of flowers the fol-lowing year since 1999/2000.
In accordance with the past five years, berry production in relation to number of flowers was very low, and the years of top production are concurrent with the years of greatest precipitation in July. The amount of precipitation over summer has been decreasing during recent years.
The culmination of greening in the plant plots occurred extremely early this year and was followed by a second peak two or three weeks later during the normal time span and of approximately the same order as the early peak. A reasonable explana-tion for the early NDVI peak is the very early snowmelt giving rise to an extended
growth period in the beginning of the sea-son. However, the early snow clearance may have caused water depletion, since a heavy rain fall of 22.6 mm during 5-8 July gave rise to a sudden rise in NDVI on 9 July. Greening index data from a satellite image from 25 July 2005 were lower than average for the 1995 to 2005 period, but still higher than the lowest values that oc-curred in 1999. The 2005 season values are similar to the values for 2001 and 2002 al-though they in some areas are slightly lower.
The 6 km long transect, the ZERO line, from the coast of Young Sund to the top of Aucellabjerg was reanalysed in 2005. In all types of plant communities along the line except for salt marsh, an increase in num-ber of species since 2000 was found. The number of species new to the plant com-munities varied from one to eight species with the largest increase in the plant com-munity with high species diversity – Salix
arctica snowbed. There were differences in
the changes of frequency among the dif-ferent life strategies. Woody dwarf shrubs (Cassiope tetragona, Vaccinium uliginosum ssp. microphyllum, Dryas sp. and Salix
arcti-ca) with a long term life strategy, showed
no or only minor changes in frequency, whereas perennials both among herbs and graminoids (i.e. grasses, sedges and rush-es) showed many increases or decreases in frequency.
The reproduction of selected vascular plant species with their northern distribu-tion limit in the study area were checked in the plots established in 2000. For almost all the species and in nearly all the plots there was a marked reduction in the num-ber of flowers or inflorescences of plants growing in moist, wet or dry soils.
With some exceptions, the epigaeic lichens along the ZERO-line had adapted to drier soil conditions since 2000. Mois-ture via melt water and precipitation evi-dently had decreased in the lichen sub-strates since 2000, and strong winds had influenced the lichens to a great extent, which may be associated with more limit-ed snow cover since then. The influence of UV-radiation upon the Cladonia thalli ap-peared to have been at the same level in 2005 as in 2000.
The total number of arthropods caught in the window traps this season (9444) was the second highest since 1996. The chironomids had a very distinct peak one week earlier than average for the years
1996-2004, which could be related to the extraordinary early ice melt on the pond around the traps. Also extremely high numbers of sciarids were caught this year, constituting the highest number ever recorded.
A total of 38,217 arthropods were caught in the pitfall traps. This number is low compared to other years, and was due to a major reduction in number of mites (Acari) and springtails (Collombola). Most other groups were either caught in equal or higher numbers than in recent years. Two groups of flies Syrphidae and Agro-myzidae were caught in higher numbers than in all previous years. The anthomyi-ids and the agromyzanthomyi-ids showed a pro-nounced peak in the beginning of the sea-son. Larvae from both families are plant-parasites, and their early occurrence and high numbers this year could be explained by an early emergence of the plants, in which the adults lay their eggs, due to the extraordinary early thaw. Like last year, the catch of coccoids, calcidoids and the heteropteran Nysius groenlandicus were re-markably high. With 471 individuals,
Ny-sius groenlandicus showed the highest
number ever recorded.
The population size of a number of bird species changed markedly as compared to previous years. Sanderlings and common ringed plovers were recorded in the lowest numbers since the beginning of the monitoring programme. Also, dunlin numbers were lower than the last four years, and the peak seen during 2001-2003 could be coming down. Ruddy turnstones were more numerous than previously, and red knot numbers were in the high end of the range measured in the programme. Nest initiation was early to average. Near-ly 70% of all wader nests were initiated be-fore 15 June, but median first egg dates were later than in 2004, except for dunlin, which had the same median date.
Nest success was very low in 2005, and the number of juvenile waders in the deltas at low tide was by far the lowest recorded at Zackenberg to date. Ruddy turnstone and common ringed plover numbers have previously been lower or equal to this year’s numbers, but dunlin and, in particular, sanderling numbers were well below other years’ figures. The low hatching success and possibly low fledging success in waders may account for the low numbers. However, the con-siderable amounts of sediment washed
out from Zackenbergelven during the days of surge flooding in late July is also likely to have reduced the food availability in the deltas.
2005 was again an early breeding season for the long-tailed skuas. Nests were ini-tiated between 7 June and 20 June, but due to low lemming numbers only a minor proportion of the population attempted to breed. Despite a high number of foxes the skuas’ nest success was around average, but most young were taken very early, and only one chick was still alive at the last check.
The mean brood size in barnacle geese was around average, as was the number of broods. Data from the wintering grounds on Isle of Islay off the western coast of Scotland indicated a poor breeding season with only 6.3% juveniles among Green-land barnacle geese and an average brood size of only 1.67. The line transect revealed approximately 300 moulting barnacle geese in Store Sødal and Morænebakker-ne, which together with birds at the coast of Zackenbergdalen etc. adds up to an esti-mated total of 412 for the entire study area.
Immature pink-footed geese from Ice-land were seen migrating northwards be-tween 11 June and 2 July, when a total of 1319 migrating geese were recorded. Only 53 moulting immature pink-footed geese were recorded in the study area this year. This is the lowest figure so far.
Following the ‘missed’ lemming winter peak of 01/02 and the low of 02/03, a con-tinued growth from the medium peak last winter was expected for the winter 04/05 probably in conjunction with an apparent-ly absent stoat population in winter 03/04. However, the growth did not continue, and the 232 winter nests of 04/05 were medium low for Zackenberg. Again this year, not a single of the examined winter nests was found to have been depredated by stoats. The lemming population has not experienced a full peak since 97/98 and this might explain the absence of stoat pre-dated winter nests in 03/04 and 04/05.
The pattern of musk ox occurrence in
Zackenbergdalen closely matched the pat-tern observed in 2004 with high numbers in May-June, lower in July and again in-creasing to the highest counts in August. This pattern with many oxen in June cor-relates well with the extremely early snowmelt, as last year. In 2005, the num-ber of musk oxen per observation was ex-tremely high and the record so far both within the 40 km2census area and in the
entire visible area of 135 km2. 26% of the
aged animals were calves, and 25% were females active in reproduction. This gives a mother/calf ratio of app. 1:1, which is the double of the expected ratio. In 2004 there were two calves per cow, and the high ratio again this year likely reflects that the last couple of years have provided good conditions for the musk oxen.
2005 was not the best year for foxes as no pups or intense den use indicating off-spring were observed. However, the num-ber of adult foxes recorded was the second highest, which may indicate that many of the minimum of 18 pups produced in 2004 actually made it through the winter.
Totally, a factor 10 more hares were ob-served in 2005 than previous years. The number of arctic hares observed at other sites than Zackenberg mountain was cor-respondingly high this season.
On average three seals per count were hauled out on the fjord ice, which is few compared to a mean of 24 for all years.
Sommerfuglesø and Langemandssø in Morænebakkerne saw the earliest ice-out since the onset of the programme, and wa-ter temperatures were in the upper end of the range recorded since 1997. However, the average values for conductivity, total nitrogen and total phosphorus remained within the normal year-to-year fluctua-tions. In both lakes, the phytoplankton communities were totally dominated by chrysophytes. Regarding the zooplankton community in Sommerfuglesø, the clado-ceran Daphnia pulex was found to occur frequently, while in Langemandssø D.
pulex was absent. This reflects the
In 2005, Zackenberg Research Station was open for 106 days from 19 May to 30 Au-gust. In this period 31 scientist and five lo-gisticians and staff from Danish Polar Cen-ter worked from the station. The station was visited by Rear Admiral Niels Wang, Royal Danish Navy and four other guests in August. The field season was extended due to the researchers experiences that spring melting occurs earlier and earlier at Zackenberg.
Zackenberg´s branch facility in Dane-borg was used by one scientist and one lo-gistician from 18 to 25 July, and by six scientists from 2 to 23 August. The total number of person days at Zackenberg and Daneborg was 1091. A total of 15 research projects worked from the station during this summer.
International cooperation
Zackenberg Research Station is still a member of the networks ENVINET (Euro-pean Network of Arctic-Alpine Environ-mental Research) and SCANNET (Scandi-navian / North European Network of Ter-restrial Field Bases) and is still involved in the establishment of CEON (Circum-Arc-tic Environmental Observatories Net-work). Zackenberg is further involved in a large number of international organiza-tions, programs and networks including Arctic Monitoring and Assessment Pro-gramme (AMAP), Conservation of Arctic Flora and Fauna (CAFF), Arctic Climate Impact Assessment (ACIA), International Tundra Experiment (ITEX), Global Runoff Data Center (GRDC), Global Terrestrial Observing System (GTOS), Circumpolar Active Layer Monitoring Programme (CALM), Arctic Coastal Dynamics (ACD), Arctic Birds Breeding Conditions Survey (ABBCS) and Pan-Arctic Shorebird Re-searcher Network (PASNR).
Extension and restoration of the facilities
The final decision to build a new accom-modation building and a new combined workshop, power station and garage at
Zackenberg, and a boat house in Dane-borg, was taken early in 2005. The new buildings will be erected in 2006 and will be funded by Aage V. Jensen Charity Foundation. Materials for the foundations of the buildings were shipped to Dane-borg in 2005. The building of the three houses will start in mid July 2006, and hopefully they will be ready for use by late August 2006. The houses are not meant to be an extension of Zackenberg Research Station but rather an improve-ment of the facilities. When the houses are ready for use, the weatherhaven shelters which have been used for accommodation since 1995 will be taken down.
Transfer of ownership to the Greenland Home Rule
In cooperation with The Ministry of Sci-ence, Technology and Innovation and the Greenland Home Rule, Danish Polar Cen-ter is planning to transfer the ownership of Zackenberg Research Station to Green-land Home Rule, represented by Asiaq (Greenland Survey). There is a lot of pa-perwork involved in such a transfer, but it is expected that the transfer will take place in early 2006. The transfer of the owner-ship of the station to Greenland Home Rule will not immediately effect the run of the station, as Danish Polar Center and Asiaq will sign a ten year cooperation agreement stating that Danish Polar Cen-ter is obliged to continue running the sta-tion for the next ten years.
Nuuk Basic, a new monitoring program
The Danish Environmental Protection Agency has asked the group of people in-volved in the monitoring program Zack-enberg Basic to design a West Greenland, low arctic equivalent based in the area around Nuuk. This new program should start in the summer of 2006. A working group has been appointed, and Danish Polar Center has accepted to coordinate the work and to act as secretariat for Nuuk Basic.
1 Introduction
‘The Dynamics of a High Arctic Ecosystem in Relation to Climate Variability and Change’
Scientists involved in research at Zacken-berg since 1995 are working on a book about the first ten years of research and monitoring at Zackenberg. The book is planned to be published in autumn of 2007. In 2005, Aage V. Jensens Fonde pro-vided means for appointment of a first ed-itor, Dr. Hans Meltofte, and Elsevier ac-cepted to publish the book. An editor group consisting of Dr. Hans Meltofte, Professor Bo Elberling, Professor Torben Røjle Kristensen, Professor Mads Forch-hammer and Dr. Morten Rasch has been established, and the writing process has started. The book has the working title ‘The Dynamics of a High Arctic Ecosystem in Relation to Climate Variability and Change : Ten years of monitoring and re-search at Zackenberg Rere-search Station, Northeast Greenland’ and is planned to consist of 24 chapters.
Plans for the 2006 field season
In 2006, we expect that the activity level at Zackenberg measured in bed nights spend
at the station during late May – early Sep-tember will be much higher than in 2005, mainly due to the building activities at Za-ckenberg and in Daneborg. The building of the new houses will start in mid-July and the houses are planned to be ready for use in late-August.
Further information
Details about Zackenberg Research Station and the study area at Zackenberg have been given in previous annual reports (Meltofte and Thing 1996, 1997; Meltofte and Rasch 1998; Rasch 1999, Caning and Rasch 2000, 2001, 2003; Rasch and Caning 2003, 2004, 2005) and the information is also available on the Zackenberg website (www.zackenberg.dk). The ZERO Site Manual has information for scientists planning to use Zackenberg Research Sta-tion and is found together with an applica-tion form at the Zackenberg website. The address of the secretariat is: The Zacken-berg Research Station Secretariat, Danish Polar Center, Strandgade 102, DK-1401 Copenhagen K, Denmark, phone (+45) 32880100, fax (+45) 32880101, e-mail mr@dpc.dk.
The objective of GeoBasis and Climate Basis is to provide long term data of cli-matic, hydrological and physical land-scape variables describing the dynamics of the physical and geomorphological envi-ronment at Zackenberg. GeoBasis is oper-ated by the National Environmental Re-search Institute, Department for Arctic En-vironment in co-operation with Institute of Geography, University of Copenhagen. Since 2003, GeoBasis has been funded by the Danish Environmental Protection Agency as part of the environmental sup-port programme Dancea – Danish Cooper-ation for Environment in the Arctic. Cli-mateBasis is funded by the Greenland Home Rule and operated by ASIAQ, Greenland Survey, who operates and maintains the climate station and the hy-drometric station.
The authors are solely responsible for all results and conclusions presented in the report, which does not necessarily reflect the position of the Danish Environmental Protection Agency.
The monitoring includes climatic mea-surements, seasonal and spatial variations in snow cover and local microclimate in the Zackenberg area, the water balance of Zackenbergelven drainage basin, the sedi-ment, solute and organic matter yield of Zackenbergelven, the seasonal develop-ment of the active layer, temperature con-ditions and soil water chemistry of the active layer, and the dynamics of selected coastal and periglacial landscape ele-ments.
More details about the GeoBasis pro-gramme, sampling procedures, instrumen-tation, locations and installations are given in the GeoBasis Manual which is available from the Zackenberg homepage: www. zackenberg.dk. Through this internet homepage all validated data from the Zackenberg Basic monitoring are acces-sible. If some data collected by Climate Basis and GeoBasis are not available
through the database yet, they can be or-dered from ASIAQ (dop@asiaq.gl) or Insti-tute of Geography (cs@geogr.ku.dk).
In the following section, ClimateBasis and GeoBasis monitoring data are sum-marised and the season 2005 is presented. Locations of most GeoBasis and Climate-Basis stations and plots, referred to in the text, are given in Fig. 2.1.
GeoBasis had applied this season for an opening of the station earlier than 1 June, and we ended up being able to start manual measurements in Zackenberg on 19 May, almost two weeks earlier than usual. In the future it will hopefully be
2 Zackenberg Basic:
The ClimateBasis and GeoBasis
programmes
Charlotte Sigsgaard, Dorthe Petersen, Louise Grøndahl, Kisser Thorsøe, Hans Meltofte, Mikkel Tamstorf and Birger Ulf Hansen
508000 510000 512000 514000 516000 518000 E as ting (m) 8262000 8264000 8 266000 8268000 8270000 8 272000 8 274000 8 276000 No rt h in g ( m ) S tore S ødal L in d e m an A u cel la Zac kenberg A uc e lla G ræ n se el v K æ rel v Y oung S und T yrolerfjord Zac kenbergelven UT M G R ID ZONE 27 R ylekæ r P aln atok e T 1 T 2 S 1 P 5 N P 4 P 3M3 M2 H K S Mix S al Dry M1 P 1 L oms ø 2 3 5 6 Fig. 2.1. Location of GeoBasis and ClimateBasis stations and plots. The cli-mate station is marked with an asterix. H= Hydro-metric station. M1= Micrometeorological sta-tion. M2 and M3= New snow- and micrometeoro-logical stations. Triangles = Water sampling sites from tributaries to Zack-enbergelven. N = Nansen-blokken. K, S, Dry, Sal, and Mix = Soil water sites. P1, P3, P4, P5, S1, T1 and T2 = TinyTag temperature sites. Small crosses (x) = Snow stakes 2, 3, 5 and 6.
standard procedure to open in mid May, as the transition period between winter and summer is of great importance for most of the monitored parameters. In or-der to carry out the snow monitoring pro-gramme we also need to be able to be there before onset of the melting.
2.1 Meteorological data
The meteorological station at Zackenberg was constructed in 1995. Technical specifi-cations of the station are described in Meltofte and Thing (1996). Once a year the sensors are calibrated and checked by ASI-AQ, Greenland Survey. In the summer of 2005, a satellite modem was established on the eastern climate mast from which data is transferred once a day and made avail-able on the Zackenberg homepage: www. zackenberg.dk/weather. For the period September to December 2005 there is only
data available from the eastern mast, and the quality control of data is provisional until data from the western mast has been retrieved in the summer of 2006. Some pa-rameters are only measured at the western mast (e.g. precipitation) and will be pre-sented in the next annual report. Some of the data presented in Table 2.1 and 2.2 dif-fer from earlier publications due to re-evaluation of data.
Meteorological data from 2004 In 2004, the mean air temperature mea-sured 2 m above terrain was –8.5°C. This is the highest annual air temperature mea-sured since the meteorological station was installed in 1995. A maximum temperature of 19.1°C was measured 20 June (14:00) and a minimum temperature of –34.0°C was measured 5 February (14:00) (Table 2.1). Pe-riods with frequent temperatures above 0°C started in late May and ended in late
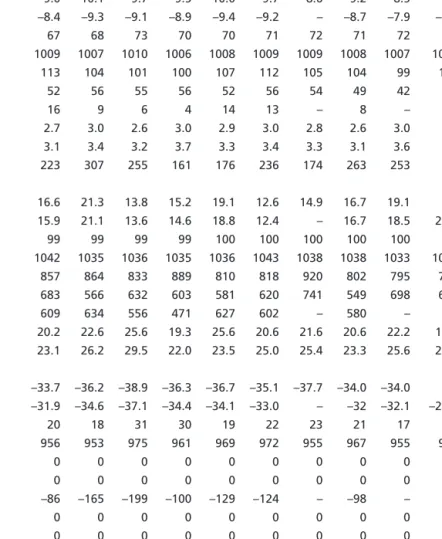
Table 2.1. Annual mean, maximum and minimum values of climate parame-ters 1996 to 2005. Data for 2005 are preliminary. Some of the figures differ from earlier publications due to re-evaluation of data.
1996 1997 1998 1999 2000 2001 2002 2003 2004 2005
Yearly mean values
Air temperature, 2 m above terrain (°C) –9.0 –10.1 –9.7 –9.5 –10.0 –9.7 –8.6 –9.2 –8.5 – Air temperature, 7.5 m above terrain (°C) –8.4 –9.3 –9.1 –8.9 –9.4 –9.2 – –8.7 –7.9 –6.9 Relative air humidity 2 m above terrain (%) 67 68 73 70 70 71 72 71 72 71
Air Pressure (hPa) 1009 1007 1010 1006 1008 1009 1009 1008 1007 1008
Incoming shortwave radiation (W/m2) 113 104 101 100 107 112 105 104 99 101
Outgoing shortwave radiation (W/m2) 52 56 55 56 52 56 54 49 42 43
Net Radiation (W/m2) 16 9 6 4 14 13 – 8 – –
Wind Velocity, 2 m above terrain (m/s) 2.7 3.0 2.6 3.0 2.9 3.0 2.8 2.6 3.0 2.8 Wind Velocity, 7.5 m above terrain (m/s) 3.1 3.4 3.2 3.7 3.3 3.4 3.3 3.1 3.6 3.5 Precipitation (mm w.eq.), total 223 307 255 161 176 236 174 263 253 –
Yearly maximum values
Air temperature, 2 m above terrain (°C) 16.6 21.3 13.8 15.2 19.1 12.6 14.9 16.7 19.1 – Air temperature, 7.5 m above terrain (°C) 15.9 21.1 13.6 14.6 18.8 12.4 – 16.7 18.5 21.6 Relative air humidity 2 m above terrain (%) 99 99 99 99 100 100 100 100 100 99
Air Pressure (hPa) 1042 1035 1036 1035 1036 1043 1038 1038 1033 1038
Incoming shortwave radiation (W/m2) 857 864 833 889 810 818 920 802 795 790
Outgoing shortwave radiation (W/m2) 683 566 632 603 581 620 741 549 698 629
Net Radiation (W/m2) 609 634 556 471 627 602 – 580 – –
Wind Velocity, 2 m above terrain (m/s) 20.2 22.6 25.6 19.3 25.6 20.6 21.6 20.6 22.2 19.0 Wind Velocity, 7.5 m above terrain (m/s) 23.1 26.2 29.5 22.0 23.5 25.0 25.4 23.3 25.6 21.2
Yearly minimum values
Air temperature, 2 m above terrain (°C) –33.7 –36.2 –38.9 –36.3 –36.7 –35.1 –37.7 –34.0 –34.0 – Air temperature, 7.5 m above terrain (°C) –31.9 –34.6 –37.1 –34.4 –34.1 –33.0 – –32 –32.1 –27.9 Relative air humidity 2 m above terrain (%) 20 18 31 30 19 22 23 21 17 22
Air Pressure (hPa) 956 953 975 961 969 972 955 967 955 967
Incoming shortwave radiation (W/m2) 0 0 0 0 0 0 0 0 0 0
Outgoing shortwave radiation (W/m2) 0 0 0 0 0 0 0 0 0 0
Net Radiation (W/m2) –86 –165 –199 –100 –129 –124 – –98 – –
Wind Velocity, 2 m above terrain (m/s) 0 0 0 0 0 0 0 0 0 0
September (Fig. 2.2). Monthly mean tem-perature in February 2004 was colder than previous years, whereas April 2004 was warmer than measured before (Fig. 2.3).
The total amount of measured precipita-tion in 2004 was 253 mm of which only 17 mm fell during the summer period. Rain events occurred primarily in July whereas June and August were rather dry (Table 2.2).
Mean relative humidity was 72% and lowest humidity of 17% was measured 8 July. The mean air pressure was 1007 hPa and the air pressure was more stable dur-ing summer than winter. Monthly mean net radiation was positive in May, June, July and August and negative in January
to April. Unfortunately, net radiation data is not available in the period September 2004 until August 2005.
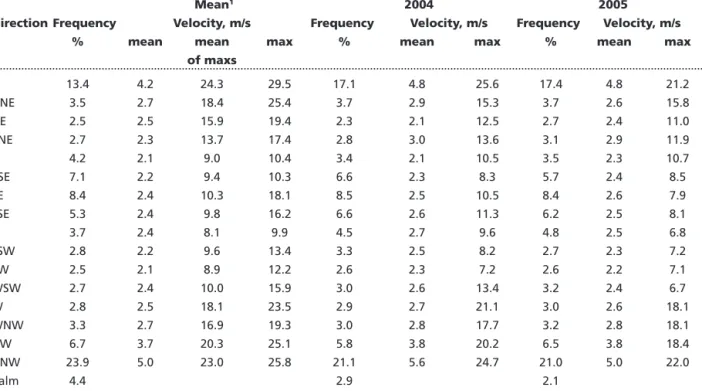
Wind speed measured 2 m and 7.5 m above the ground had an average of 3.0 m/s and 3.6 m/s, respectively. The highest 10 minutes mean value was 22.2 m/s at 2 m above ground and 25.6 m/s at 7.5 m above ground – both measured during a storm 1 January 2004 with wind gusts up to 40 m/s. The wind speeds are generally higher in winter than in summer (Table 2.3). Annual wind statistic for 2004 is in good agreement with the years 1997, 1998, 2000 and 2002. Wind statistics for the re-maining years are not given due to
signifi-Year Month Shortwave Rad. Net Rad. PAR Air temperature PrecipitationWind velocity Vind
W/m2 W/m2 W/m2 µmol/m2/s °C °C °C mm m/s m/s direction
mean mean mean mean mean minimum max total mean max1 dominant
in put 2 m 2 m 2 m 7.5 m 7.5 m 7. 5m Jun 332 133 113 – 1.9 –3.7 13.6 4 1.8 9.9 ESE 1996 Jul 238 24 145 – 5.8 –1.5 16.6 7 2.7 12.1 SE Aug 162 23 74 – 4.4 –4.0 14.1 2 2.9 12.5 SE Jun 222 111 85 – 2.2 –4.4 12.0 23 2.4 14.1 ESE 1997 Jul 225 23 130 – 3.7 –1.0 15.3 28 2.7 13.8 SE Aug 159 20 74 – 5.0 –3.0 21.3 16 2.8 13.3 SE Jun 270 172 51 – 0.9 –3.0 9.6 5 1.6 8.1 SE 1998 Jul 204 20 125 – 4.7 –2.6 13.8 33 2.3 12.1 SE Aug 114 12 64 – 4.6 –1.8 11.5 55 2.4 12.2 ESE Jun 294 206 33 – 1.5 –4.5 10.4 2 2.3 15.0 – 1999 Jul 212 32 123 – 6.2 –0.7 15.1 21 2.6 14.8 – Aug 143 16 73 – 2.9 –2.7 15.2 11 2.5 14.9 SE Jun 294 103 126 – 1.9 –6.2 11.7 10 2.1 15.1 SE 2000 Jul 228 27 141 – 5.3 –1.2 19.1 13 2.9 15.9 SE Aug 153 19 82 – 4.0 –3.5 11.6 0 2.3 13.4 SE Jun 293 168 67 – 2.1 –4.9 11.9 26 2.1 13.3 – 2001 Jul 231 27 146 – 4.9 –1.5 11.8 7 2.9 13.1 – Aug 180 20 84 – 5.8 –0.8 12.6 21 2.9 14.4 – Jun 344 151 113 – 2.6 –2.8 14.9 1 1.6 6.8 SE 2002 Jul 205 23 105 424 5.7 –0.9 13.8 11 2.6 9.9 SE Aug 129 16 51 272 4.9 –3.1 11.6 15 2.8 12.9 SE Jun 294 108 106 612 2.2 –4.8 14.7 7 1.6 5.4 SE 2003 Jul 210 26 96 431 7.7 1.8 16.7 6 2.8 14.2 SE Aug 151 20 56 313 6.6 –0.5 15.4 3 2.5 10.1 SE Jun 279 73 111 571 2.5 –3.4 19.1 3 2.3 13.6 SE 2004 Jul 225 30 95 464 7.2 –0.7 19.0 10 2.8 10.5 SE Aug 150 20 62 302 5.6 –1.4 17.2 4 2.4 12.6 SE Jun 261 53 – 519 2.7 –3.5 13.4 6 2.4 11.8 SE 2005 Jul 215 29 – 428 6.9 –0.6 21.8 28 2.9 13.3 SE Aug 153 20 – 321 4.6 –2.7 14.0 4 3.2 11.0 SE
Table 2.2. Climate param-eters for June, July and August, 1996 to 2005. 1)Wind velocity, max is the maximum of 10 minutes mean values. Some of the figures differ from earlier publications due to re-evaluation of data.
cant periods with missing data. In 2004, the winds were coming from N and NNW 38% of the time, mainly in the winter peri-od, and from ESE to SSE app. 22% of the time, mainly in the summer period (Table 2.3 and 2.4).
Meteorological data from 2005 In 2005, there were some problems with the air temperature sensor 2 m above ter-rain at the east mast and therefore, the an-nual mean can not be given until data from the west mast has been retrieved in summer 2006. Mean air temperature mea-sured 7.5 m above terrain was –6.9°C. This is the highest among the years 1996-2005 and more than one degree higher than in 2004 which was the warmest year so far (Table 2.1).
The winter 2005 was extremely warm and January and February was the warmest recorded so far (Fig. 2.3). The minimum temperature measured 22 Jan-uary was only –27.9°C (Table 2.1).
Positive diurnal air temperatures were recorded from 18 May and the period with
frequent temperatures above 0°C ended in mid September. May and June were also extraordinary warm with mean monthly temperatures of –2.5 °C and 2.7°C, respec-tively (Table 2.3 and Fig. 2.3). The last part of June and first part of July were charac-terized by relatively cold, cloudy and fog-gy weather with rain and drizzle. Then, a very warm and dry period followed (last-ing from 12 July to 26 July) with average diurnal mean temperatures above 10°C. A record high air temperature of 21.8°C was measured during a Föhn wind situation 21 July (18:00).
The high annual mean air temperature in 2005 was mainly due to the unusually warm January and February as well as high monthly temperatures in May and June. In contrast, the extreme year 2002 was mainly due to a warm autumn where-as the winter of 2002 wwhere-as cold compared to other years. In 2004, the high annual mean temperature was mainly due to very high temperatures in April. Fig. 2.3, show the variation in mean monthly air temper-atures from the last ten years. Large year to year variations (up to 20°C) can be ob-served in the winter months, whereas summer temperatures are more stable.
Mean relative humidity was 71% and mean air pressure was 1008 hPa. Unfortu-nately, net radiation data is not available in the period September 2004 until August 2005 due to malfunction of the sensor. Monthly mean net radiation was positive in September 2005 and negative in Octo-ber to DecemOcto-ber.
Mean wind speed 2 m and 7.5 m above the ground was 2.8 m/s and 3.5 m/s, re-spectively. The highest 10 minutes mean value was 19.0 m/s at 2 m above ground and 21.2 m/s at 7.5 m above ground – both measured during a storm 25 January. The annual wind statistics for 2005 is in good agreement with the years 1997, 1998, 2000, 2002 and 2004. Wind statistics for the remaining years are not given due to sig-nificant periods with missing data. In 2005, the winds were coming from N and NNW app. 38% of the time, mainly in the winter period, and from ESE to SSE app. 20% of the time, mainly in the summer pe-riod (Table 2.3 and 2.4).
The total precipitation during the sum-mer 2005 was 38 mm and rain events oc-curred primarily in early and late July whereas June and August were rather dry as in 2004 (Table 2.2).
Positive degree days calculated on a
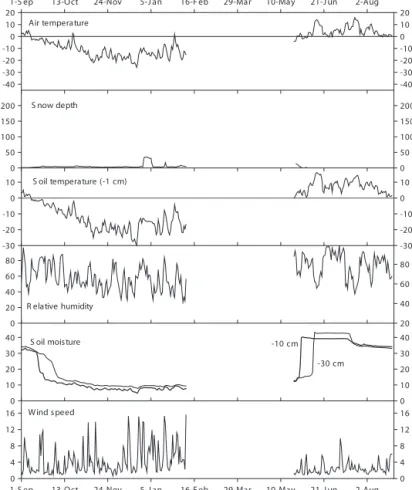
Fig. 2.2. Variation of selected climate parame-ters during 2004 and 2005. From above: Air temperature, relative humidity, air pressure, snow depth, net radiation, incoming short wave radi-ation, outgoing short wave radiation, wind speed and wind direction. Wind speed and direction are measured 7.5 m above terrain; the remaining parameters are measured 2 m above ter-rain.
monthly basis as the sum of daily mean air temperatures above 0°C are shown in Table 2.5. The warm spring in 2005 is illus-trated with May and June having the second highest and the highest sum of de-gree days, respectively. No positive dede-gree day was recorded in November, Decem-ber, January, February and March until the winter 2005, where a Föhn wind situation 26 and 27 January resulted in tempera-tures as high as 10.7°C and constant posi-tive temperatures for a consecuposi-tive period of 13 hours. As a result of this event, an ice layer of up to several centimetres could be recognized in the snow pack throughout most of the valley. Ice layers caused by positive temperature events during the winter are of special concern to animals seeking food below the snow, as ice crusts in the snow pack can impede access to the vegetation. Throughout the winter 2004-2005, additional hot spells (positive tem-perature events with fluctuations of short duration above the freezing point) was recorded 16 and 21 October and again 21 and 28 February, every time in relation with Föhn wind situations.
2.2 Climate gradients, snow, ice
and permafrost
New micrometeorological stations Monthly mean values of selected parame-ters from the new snow- and micrometeo-rological stations M2 and M3 (see section 2.2 in Rasch and Caning 2004) are reported in Table 2.6 and Figs. 2.4 and 2.5. Data are missing from a long period in the winter. The station is powered by solar panels and
-30 -25 -20 -15 -10 -5 0 5 10 1994 1995 1996 1997 1998 1999 2000 2001 2002 2003 2004 2005 2006 Mean mont hly air t e mperat ure ( °C) Jan Apr Mar Feb Aug Jul Jun May Oct Sep Dec Nov
Fig. 2.3. Monthly mean temperatures from September 1995 to August 2005.
Air Temperature Rel. Air Net Rad. Shortwave Rad. Wind Velocity Dominant
humidity Press.
°C °C % hPa W/m2 W/m2 W/m2 m/s m/s Wind Dir.
2.0 m 7.5 m In Out 2.0 m 7.5 m 7.5 m 2004 Jan –20.1 –19.4 66 1009.1 –20 0 0 4.0 4.6 NNW 2004 Feb –22.9 –21.5 65 1008.8 –23 6 6 2.9 3.4 NNW 2004 Mar –17.1 –16.5 72 1005.7 –14 54 46 3.1 3.6 NNW 2004 Apr –7.9 –7.5 75 1009.9 –10 136 114 4.0 4.7 NNW 2004 May –4.5 –4.6 76 1016.5 3 259 202 2.7 3.1 SE 2004 Jun 2.5 2.1 82 1011.4 111 279 73 2.1 2.3 SE 2004 Jul 7.2 6.8 75 1002.8 95 225 30 2.4 2.8 SE 2004 Aug 5.6 5.6 79 1008.6 62 150 20 2.0 2.4 SE 2004 Sept –0.1 0.4 74 1004.8 – 65 10 3.0 3.7 NNW 2004 Oct –8.3 –7.3 68 1009.1 – 14 3 2.7 3.5 N 2004 Nov –18.2 –16.7 65 1008.4 – 0 0 3.0 3.8 NNW 2004 Dec –18.4 –17.2 66 990.9 – 0 0 4.2 5.3 NNW 2005 Jan –14.3 –12.9 62 996.0 – 0 0 5.0 6.0 NNW 2005 Feb –14.1 –12.5 65 1004.6 – 7 6 3.3 4.1 NNW 2005 Mar –18.6 –17.1 68 1014.3 – 62 53 2.4 2.8 NNW 2005 Apr –13.2 –11.9 67 1013.5 – 164 136 2.3 2.7 NNW 2005 May –2.5 –1.8 76 1014.8 – 256 197 2.5 3.1 N 2005 Jun 2.7 2.9 84 1010.2 – 261 53 2.0 2.4 SE 2005 Jul 6.9 7.1 75 1006.3 – 215 29 2.4 2.9 SE 2005 Aug 4.6 4.8 69 1006.7 – 151 20 2.6 3.2 SE 2005 Sept – –1.3 68 1005.8 1 73 15 2.6 3.4 N 2005 Oct – –12.3 67 1010.0 –31 17 6 2.6 3.4 NNW 2005 Nov – –14.7 72 1003.8 –21 0 0 2.7 3.4 NNW 2005 Dec – –13.5 73 1004.4 –18 0 0 3.8 4.4 NNW
Table 2.3. Monthly mean values of climate parame-ters 2004 and 2005. Data for 2005 are preliminary.
the datalogger is programmed to enter sleep mode if the voltage attain a certain low level during the dark period and to start up again as soon as the voltage ex-ceed 10 Volt. Unfortunately, the automatic restart did not work in 2005 and therefore, no measurements are available from February and until field staff arrived in Zackenberg 19 May. Due to the missing data, it has not been possible to calculate monthly mean values for February, March, April and May.
In Fig. 2.6, periods where the tempera-ture is higher at M3 than at M2 (inversion) have a negative value, whereas periods where the temperature are highest at M2 (no inversion) have a positive value. The pattern is not even distributed over the year. In September, inversion takes place less than 10% of the time, whereas in De-cember inversion takes place up to 80% of the time. During June and July it is about 50% of the time. Daily mean temperature variations can be as high as 13°C when the temperature is higher at M3 than at M2, but in periods where temperatures are lower at M3 than at M2 (no inversion), the variation is less than 4°C – corresponding to the dry adiabatic lowering of tempera-ture of 1°C/100 m altitude.
There is a high correlation between the variations in relative humidity and the variations in temperatures. When the
tem-perature is higher at M3 than at M2, the relative humidity is lower (Fig. 2.6). High-est temperature at M3 was 18.5°C mea-sured 21 July (18:00) and at M2 the highest temperature was 21.8°C measured 21 July (19:00). The high temperatures recorded in the valley during the Föhn situation 26 Jan-uary was likewise recorded at M3, where maximum was 6.8°C and temperatures were above freezing in consecutive 22 hours.
Snow depth
In 1997 automatic point measurements of snow depth was started in Zackenberg-dalen near the meteorological station; see Meltofte and Rasch (1998). The snow depth during the winter is summarised for all six winters in Table 2.7 and the accu-mulation for all years is shown in Fig. 2.7 In the winter 2004/2005 only sparse snow-fall was observed before 8 December (Figs 2.2 and 2.7) and the snow depth did not reach 0.1 m before 27 December, which is relatively late. The maximum measured snow depth was 0.73 m. That is approxi-mately the same level as in the winters 2000/2001, 2002/2003 and 2003/2004. Re-latively sparse snow cover and an early snow melt characterized the end of winter situation in 2005. Melting of the snow around the snow mast began mid May
Mean1 2004 2005
Direction Frequency Velocity, m/s Frequency Velocity, m/s Frequency Velocity, m/s
% mean mean max % mean max % mean max
of maxs N 13.4 4.2 24.3 29.5 17.1 4.8 25.6 17.4 4.8 21.2 NNE 3.5 2.7 18.4 25.4 3.7 2.9 15.3 3.7 2.6 15.8 NE 2.5 2.5 15.9 19.4 2.3 2.1 12.5 2.7 2.4 11.0 ENE 2.7 2.3 13.7 17.4 2.8 3.0 13.6 3.1 2.9 11.9 E 4.2 2.1 9.0 10.4 3.4 2.1 10.5 3.5 2.3 10.7 ESE 7.1 2.2 9.4 10.3 6.6 2.3 8.3 5.7 2.4 8.5 SE 8.4 2.4 10.3 18.1 8.5 2.5 10.5 8.4 2.6 7.9 SSE 5.3 2.4 9.8 16.2 6.6 2.6 11.3 6.2 2.5 8.1 S 3.7 2.4 8.1 9.9 4.5 2.7 9.6 4.8 2.5 6.8 SSW 2.8 2.2 9.6 13.4 3.3 2.5 8.2 2.7 2.3 7.2 SW 2.5 2.1 8.9 12.2 2.6 2.3 7.2 2.6 2.2 7.1 WSW 2.7 2.4 10.0 15.9 3.0 2.6 13.4 3.2 2.4 6.7 W 2.8 2.5 18.1 23.5 2.9 2.7 21.1 3.0 2.6 18.1 WNW 3.3 2.7 16.9 19.3 3.0 2.8 17.7 3.2 2.8 18.1 NW 6.7 3.7 20.3 25.1 5.8 3.8 20.2 6.5 3.8 18.4 NNW 23.9 5.0 23.0 25.8 21.1 5.6 24.7 21.0 5.0 22.0 Calm 4.4 2.9 2.1 1) Data from 1997, 1998, 2000, 2002, 2003
Table 2.4. Mean wind statistics based on wind velocity and direction measured 7.5 m above terrain in 1997, 1998, 2000, 2002 and 2003. Furthermore wind statis-tics for the years 2004 and 2005. Calm is defined as wind speed lower than 0.5 m/s. Max speed is maximum of 10 minutes mean values. Mean of maxs is the mean of the yearly maximums. The fre-quency for each direction is given as percent of the time for which data exist. Missing data amount to less than 8% of data for the entire year and less than 20 days within the same month.
and was complete 9 June which is early compared to previous years where snow have disappeared from the ground below the sensor somewhere between 14 June (2004) and 3 July (1999). During the melt period there was a snow event 2-3 June re-sulting in about 5 cm of new snow upon the old snow in the valley.
At M2, the snow pack was more than 100 cm from 27 December and at M3 snow depth reached 43 cm, but most of the snow at M3 was blown away during a storm 5 January (Figs. 2.4 and 2.5). Snow melt was complete 27 May at M3, whereas snow persisted until 13 June at M2.
Between 22 and 24 May 2005, snow depth were measured along two main transects; one starting from Lomsø follow-ing a line along the snow stakes in the val-ley and another following the ZERO-line from the old delta up to M3, 420 m a.s.l. (Fig. 2.1) Snow depths were measured for every 20 meters and data are available along with GPS positions and altitudes for each point. Preferably, these measure-ments should be performed prior to spring melt for a calculation of the end of winter snow accumulation in the valley. This year snow melt started between 14 and 19 May at the meteorological station, – illustrating the importance of being able to start the field season earlier than begin-ning of June.
In Table 2.8, snow depth at the end of
May is given as highest daily average in the period from 21-31 May at some fixed positions representing a transect through the main study area in the valley (Fig. 2.1).
Snow density
Snow densities were measured 20 May at all permanent soil sites covered by snow in order to calculate snow water equiva-lent (SWE). The soil plots; Dry-1 and Sal-1 were free of snow when we arrived. In the
1995 1996 1997 1998 1999 2000 2001 2002 2003 2004 2005 January 1.5 February March April 0.2 1.1 May 1.1 1.3 0.1 3.6 0.5 0.5 18.2 3.3 4.1 5.40 June 63.7 74.6 32.5 52.9 71.8 68.2 81.8 74.2 73.9 84.6 July 181.0 115.4 147.36 192.7 164.4 152.0 175.6 237.2 222.2 214.7 August 140.5 154.2 143.6 89.2 127.3 181.2 152.5 203.2 169.4 130.5 September 11.7 15.3 4.5 11.3 19.7 5.7 31.1 41.2 42.5 41.4 ?? October 1.5 0.3 1.8 November December Sum 11.7 401.7 351.5 334.8 358.0 369.7 433.2 471.18 560.6 514.8 *436.7
Table 2.5. Positive degree days calculated on a monthly basis as the sum of daily mean air tempera-tures above 0°C. Calcula-tions are based on air temperatures from the cli-mate station (2 m above ground). Some of the fig-ures differ from earlier publications due to re-evaluation of data. -40 -30 -20 -10 0 10 20 °C 0 50 100 150 200 cm -30 -20 -10 0 10 °C 0 20 40 60 80 % 0 10 20 30 40 vo l%
1-S ep 13-Oct 24-Nov 5-J an 16-F eb 29-Mar 10-May 21-J un 2-Aug
0 4 8 12 16 m/ s
1-S ep 13-Oct 24-Nov 5-J an 16-F eb 29-Mar 10-May 21-J un 2-Aug
-40 -30 -20 -10 0 10 20 0 50 100 150 200 -30 -20 -10 0 10 20 40 60 80 0 10 20 30 40 0 4 8 12 16 Air temperature S now depth S oil temperature (-1 cm) R elative humidity
S oil mois ture
W ind s peed
-10 cm
-30 cm Fig. 2.4. Daily mean values of selected parameters from
snow- and micrometeorological station M2 (17 m a.s.l.) from September 2004 to August 2005. From above: Air temperature, snow depth, soil temperature 1 cm below surface, relative humidity, soil moisture 10 cm and 30 cm below surface, and wind speed. Due to malfunction, no data are obtained in the period from 6 January to 20 May.
active layer monitoring site ZEROCALM-1, densities were measured on a regular basis throughout the ablation period. Fi-nally, densities were measured 22 May and 5 June along the west facing slope of Aucellabjerg at altitudes of 90, 200, 300 and 400 m a.s.l.
In the seasonal snow patch in ZERO-CALM-2, a profile of 235 cm was excavat-ed 23 May and densities were measurexcavat-ed for layers of 25 cm. At that time, the snow had become isothermal and a thin layer of basal ice was observed. Several ice layers were present throughout the snow as a re-sult of several episodes with positive tem-peratures during winter.
Snow cover
The extent of spring snow cover at Zack-enberg was the lowest recorded during our 10 years of monitoring (Table 2.9). On 10 June, the snow cover was way below previous years in most sub-zones in Zack-enbergdalen, and only in sub-zone 12, the coverage was close to average. Snow cover was particularly limited below 150 m a.s.l. On the other hand, snow depth at the be-ginning of the melt season in the second half of May was not much different from several other years (Table 2.8). This indi-cates, that it was the record high spring temperatures, which caused the rapid snow melt.
Photos from the digital cameras on Nansenblokken (477 m a.s.l. on the east facing slope of Zackenberg) has not yet been analysed and therefore a snow deple-tion curve for 2005 will not be presented in this annual report. However, photos exist and will be analyzed and presented in the next annual report. Fig. 2.8 show the view from Nansenblokken 3 June 2005, where
-40 -30 -20 -10 0 10 20 °C 0 50 100 150 200 cm -30 -20 -10 0 10 °C 0 20 40 60 80 % 0 10 20 30 40 vo l%
1-S ep 13-Oct 24-Nov 5-J an 16-F eb 29-Mar 10-May 21-J un 2-Aug
0 4 8 12 16 m/ s
1-S ep 13-Oct 24-Nov 5-J an 16-F eb 29-Mar 10-May 21-J un 2-Aug
-40 -30 -20 -10 0 10 20 0 50 100 150 200 -30 -20 -10 0 10 20 40 60 80 0 10 20 30 40 0 4 8 12 16 Air temperature S now depth S oil temperature (-1 cm) R elative humidity
S oil mois ture
W ind s peed
-10 cm -30 cm
Fig. 2.5.Daily mean values of selected parameters from snow- and microme-teorological station M3 (420 m a.s.l.) in the period September 2004 to August 2005. From above: Air temperature, snow depth, soil tempera-ture 1 cm below surface, relative humidity, soil moisture 10 cm and 30 cm below surface, and wind speed. Due to mal-function, no data are obtained in the period from 8 February to 22 May. -20 -10 0 10 20 30 40 50 31-a ug 21-s ep 12-o kt 02-n ov 23-n ov 14-d ec 05-ja n 26-ja n 16-feb08-m ar 29-m ar 19-a pr 10-m aj 31-m aj 21-ju n 12-ju l 02-a ug 23-a ug 12-s ep 03-o kt 24-o kt 14-n ov 05-d ec 26-d ec 16-ja n 06-feb27-feb19-m ar 09-a pr 30-a pr 21-m aj 11-ju n 02-ju l 23-ju l 13-a ug 2003 2004 2005 Temperature, °C (M2-M3) -20 -10 0 10 20 30 40 50 Relative humidity, % (M2-M3) Temperature (M2-M3) Relative humidty (M2-M3)
Fig. 2.6. The difference in mean daily air tempera-ture and relative humidity between M2 and M3. Positive values indicate lower temperature/relative humidity at M3 than at M2 whereas negative values indicate higher temperature/relative humidity at M3 than at M2.
large parts of the landscape is already free of snow. Unfortunately, the long period with low clouds and foggy weather from 20 June to 11 July results in lack of sight, and information.
The NDVI-camera was installed 25 May and captured two daily photos until 23 August where it was removed and the digital cameras emptied for the last time during the 2005 season. The digital camera
M2 Wind Rel. Air Soil Soil Soil Soil Soil Soil
speed hum temp temp temp temp temp moist moist
2.5 m 2.5 m 2.5 m –1 cm –10 cm –30 cm –60 cm –10 cm –30 cm m/s % °C °C °C °C °C % % Sep 2003 2.6 68.2 0.6 1.1 1.6 1.4 0.4 12.4 12.3 Oct 2003 3.0 72.1 –8.7 –8.3 –6.8 –4.3 –1.8 4.8 4.6 Nov 2003 4.5 76.1 –12.9 –13.1 –12.1 –10.2 –6.9 4.0 3.2 Dec 2003 2.9 65.2 –23.9 –9.2 –8.9 –8.2 –7.2 4.4 3.3 Jan 2004 (3.8) (–65) (–20.7) (–9.8) (–9.4) (–8.7) (–7.5) (4.3) (3.3) Feb 2004 Mar 2004 3.0 75.8 –17.3 –11.1 –10.7 –10.1 –9.0 4.1 3.1 Apr 2004 3.8 78.4 –7.9 –8.9 –8.9 –8.7 –8.3 4.3 3.2 May 2004 2.6 79.0 –4.3 –5.6 –5.9 –6.4 –6.8 4.6 3.5 Jun 2004 2.1 82.7 2.2 3.7 2.5 0.6 –1.6 27.1 17.5 Jul 2004 2.5 77.0 6.8 9.8 8.4 5.6 0.7 20.0 17.1 Aug 2004 2.2 80.0 5.6 7.9 7.1 5.1 1.6 17.2 16.2 Sep 2004 3.1 76.0 0.1 1.2 1.5 1.3 0.5 15.3 14.9 Oct 2004 3.0 69.3 –7.9 –8.1 –7.0 –4.6 –1.7 5.9 5.2 Nov 2004 3.2 66.4 –17.6 –19.1 –17.9 –15.0 –9.7 4.0 2.8 Dec 2004 4.1 67.6 –18.0 –18.1 –17.4 –15.7 –12.4 4.0 2.7 Jun 2005 2.1 85.9 2.5 5.4 3.9 1.7 –1.1 29.2 17.6 Jul 2005 2.6 77.1 6.8 9.8 8.5 6.1 1.3 23.5 18.6
M3 Wind Rel. Air Soil Soil Soil Soil Soil Soil
speed hum temp temp temp temp temp moist moist
1.5 m 1.5 m 1.5 m –1 cm –10 cm –30 cm –60 cm –10 cm –30 cm m/s % °C °C °C °C °C % % Sep 2003 3.0 69.2 –1.8 –1.1 0.4 0.9 0.6 23.7 28.2 Oct 2003 3.1 63.6 –8.7 –8.7 –6.0 –4.0 –1.9 10.6 13.4 Nov 2003 4.7 70.0 –13.0 –11.6 –10.3 –9.1 –7.5 9.4 11.5 Dec 2003 2.5 55.2 –20.6 –18.7 –16.9 –15.2 –12.7 7.7 10.2 Jan 2004 (5.2) (62.1) (–19.3) (–19.6) (–18.3) (–17.3) (–15.6) (7.2) (9.8) Feb 2004 Mar 2004 3.7 69.3 –15.6 –16.9 –17.0 –16.9 –16.4 7.4 9.6 Apr 2004 5.3 73.1 –9.0 –10.5 –11.3 –11.9 –12.6 9.1 10.7 May 2004 2.6 72.7 –4.9 –2.9 –4.8 –6.0 –7.4 14.5 12.6 Jun 2004 2.2 78.0 2.4 8.3 6.1 2.5 –0.9 43.9 39.3 Jul 2004 2.5 67.5 7.3 9.8 8.6 6.4 3.2 35.4 36.2 Aug 2004 2.1 73.8 4.9 6.6 6.1 4.9 3.0 33.6 37.4 Sep 2004 3.5 70.3 –1.6 –1.3 0.3 0.6 0.4 23.9 30.5 Oct 2004 3.4 58.7 –7.9 –9.4 –6.3 –4.0 –1.8 10.8 13.6 Nov 2004 3.5 53.5 –16.0 –18.9 –16.6 –14.4 –11.4 7.7 9.9 Dec 2004 5.2 56.0 –17.1 –19.9 –18.8 –17.6 –15.7 7.0 9.0 Jan 2005 6.4 51.4 –12.7 –15.5 –15.3 –15.0 –14.3 8.0 9.5 Jun 2005 2.1 76.5 4.0 8.3 6.0 2.2 –1.2 39.4 33.5 Jul 2005 2.9 71.9 6.8 9.3 8.4 6.1 3.0 37.6 39.2
Table 2.6. Monthly mean values of selected meteorological parameters from M2 (17 m a.s.l.) and M3 (420 m a.s.l.) from September 2003 to July 2005. Values from January 2004 are in brackets as they are based on data from 1-27 January for M2 and 1-23 January for M3. Due to malfunc-tion, no data were obtained from 6 January to 20 May 2005 at M2 and from 8 February to 22 May 2005 at M3.
covering the central part of the valley (camera 2) was replaced 30 June with a new model (KODAK, RDC 365 ver.2).
Ice melting on ponds and lakes The average air temperature during early spring, i.e. 21 May – 10 June, was positive (0.13°C) only for the second time during our study years, but not as warm as in the all time record warm spring of 2002
(1.17°C). But 2002 had much deeper snow (Table 2.8 and Fig. 2.7) so that the high temperatures in 2005 resulted in record early and fast snow and ice melt. Hence, the ice on the ponds north and south of the research station disappeared much earlier than recorded before during our 10 years of observations (Table 2.10). Already in late May, all ponds in Gadekæret and Sydkærene were free of ice, which is 1-4 weeks earlier than previous years. Also Lomsø became ice free much earlier than before (Table 2.10), i.e. five days earlier than hitherto recorded, in 2004, and more than three weeks earlier than the late year of 1999. Also, the two monitored lakes in Morænebakkerne; Langemandssø and Sommerfuglesø, melted much earlier than recorded before (see chapter 3.7). Store Sø was free of ice on 11 July.
Teltdammen was dry already on 12 June, and in mid July the ponds in Gadekæret and Sydkærene began to dry out. Such dry conditions have only been recorded in similar early snowmelt and dry years like 2000 and 2003; see also Table 2.2 and Fig. 2.7. Since there was rain in late July and August, most ponds never
1997-1998 1998-1999 1999-2000 2000-2001 2001-2002 2002-2003 2003-2004 2004-2005
Max. snow depth, meter 0.88 1.3 0.49 0.68 1.33 0.6 0.69 0.73
Max. snow depth reached 29 Apr 11 Mar 19 May 25 Mar 15 Apr 13 Apr 13 Apr 12 Feb Snow depth exceeds
0.1m from 19 Nov 27 Oct 1 Jan 16 Nov 19 Nov 6 Dec 24 Nov 27 Dec
Snow depth is below
0.1m from 25 Jun 3 Jul 14 Jun 24 Jun 20 Jun 14 Jun 13 Jun 7 Jun
Table 2.7. Key figures describing the amount of snow in the last eight winters; the maximum snow depth during the winter and the date at which it is reached, the date when the snow depth reaches 0.1 m in the beginning of the winter, and the date in spring when the depth gets below 0.1 m due to melting.
-50 -40 -30 -20 -10 0 10 01-03-97 01-03-98 01-03-99 29-02-00 01-03-01 01-03-02 01-03-03 29-02-04 01-03-05 Date Temperat ure, °C 0 0,5 1 1,5 2 2,5 3 S now depth, m Groundtemp, 0cm Groundtemp, -40cm Groundtemp, -80cm Groundtemp, -130cm Snow depth, m
Fig. 2.7. Daily mean tem-peratures at surface of the ground and at 40 cm, 80 cm and 130 cm below the surface. The snow depth is shown in the lower half of the figure. 1998 1999 2000 2001 2002 2003 2004 2005 Hy st – >101 44 79 131 – – 47 M2 – – – – – – 172 170 St 2 – – – 177 265 197 188 180 St 3 – – – – 205 91 155 149 Climate St. 81 118 48 61 110 50 55 52 St 5 – – – – – 50 61 57 St 6 – – – – 90 33 32 51 M3 – – – – – – 6 14
Table 2.8. Snow depth at eight permanent positions in Zackenbergdalen in late May given as the highest daily average during 21-31 May. Data from M2 has been enhanced by 25 cm to compensate for a hollow under the sensor.
dried up completely, but by late August, the “West pond“ in Gadekæret was dry.
New ice formed on small streams in late August, but no ice was recorded on ponds.
Active layer depth
Development of the active layer (the layer above the permafrost that annually expe-riences freeze and thaw) starts as soon as snow disappears from the ground. The thaw rate was monitored throughout the season at two grid-plots; the homogenous ZEROCALM-1 grid (ZC-1) and the he-teorogeneous ZEROCALM-2 grid (ZC-2). A detailed description of the two sites was given in section 5.1.12 in Meltofte and Thing (1997). In ZC-1, the first grid node was free of snow 1 June and snow melt was complete 15 June. The active layer had started to develop in 40 out of 208 grid nodes in ZC-2 when we arrived on 20 May and the maximum thaw depth had already reached 40 cm. The seasonal snow patch, that affect the melt rate in ZC-2, dis-appeared 14 July which is three days earlier than in 2004 and the earliest date
observed so far. Figs. 2.9 and 2.10 show the seasonal development of the active layer in ZC-1 and ZC-2, respectively. At the end of the season, when thaw depth is close to maximum, the active layer in ZC-1 reached an average depth of 79 cm and in ZC-2 an average depth of 68 cm. For both sites, this is the deepest ever measured since monitoring began in 1997 (Table 2.11). Variations of up to 20-25 cm in the average maximum thaw depth have been observed during the ten years. The lowest development of the active layer was mea-sured in 1999 when completion of snow melt was between three and four weeks later than in 2005.
Thaw depth progression is based on 8 and 9 re-measurements during the season in ZC-1 and ZC-2, respectively.
Data from the ZEROCALM-sites are re-ported to the circumpolar monitoring pro-gramme CALM (Circumpolar Active Lay-er Monitoring-Network-II (2004-2008) that is maintained by the University of Dela-ware, Center for International Studies (www.udel.edu/Geography/calm).
Point measurements of thaw depth
pro-Section Area Area 1995 1996 1997 1998 1999 2000 2001 2002 2003 2004 2005 Mean
(km2) hidden (%) 1 (0-50 m) 3.52 3.5 78 74 65 77 91 60 73 77 68 48 31 67 2 (0-50 m) 7.97 1.2 89 88 90 85 91 57 87 87 92 49 25 76 3 (50-150 m) 3.52 0.0 88 81 83 83 94 51 89 82 83 51 35 74 4 (150-300 m) 2.62 0.0 73 74 68 66 86 33 79 56 73 39 28 61 5 (300-600 m) 2.17 0.0 16 54 73 43 85 31 56 36 49 16 25 44 6 (50-150 m) 2.15 75.3 86 86 84 87 98 55 84 78 74 56 50 76 7 (150-300 m) 3.36 69.3 90 81 76 90 97 54 84 74 90 56 46 76 8 (300-600 m) 4.56 27.5 49 55 66 64 84 37 45 52 66 30 29 52 9 (0-50 m) 5.01 6.2 92 87 96 91 97 54 96 96 100 58 23 81 10 (50-150 m) 3.84 2.9 94 85 95 97 98 60 97 93 100 56 47 84 11 (150-300 m) 3.18 0.2 91 72 86 92 96 77* 97 88 100 66 61 85 12 (300-600 m) 3.82 0.0 40 66 89 68 89 65 73 65 98 53 70 70 13 (Lemmings) 2.05 1.0 89 80 76 80 87 58 83 83 89 46 25 72 Total area 45.70 12.9 76 77 81 80 92 54 82 77 83 49 37 72
* Partly cloud covered, giving too high snow cover
Table 2.9. Area size and snow cover on 10 June in 13 bird and mammal study sections in Zacken-bergdalen and on the slopes of Aucellabjerg 1995-2005 (see Fig. 4.1 in Caning and Rasch 2003 for map of sections). Photos were taken from a fixed point 477 m a.s.l. on the east facing slope of Zackenbergfjeldet within +/- 3 days of 10 June and extrapolated according to the methods described by Pedersen and Hinkler (2000). Furthermore, the proportions of the areas not visible from the photo point are given. Data from 1995 and 1996 are from satellite images taken on 9 and 11 June, respec-tively.
Fig. 2.8. The view from Nansenblokken 3 June 2005.
gression are also measured throughout the season at all the soil water sites.
Soil temperature
Soil temperatures from the climate station are not presented in this annual report due to malfunction of some of the buried tem-perature sensors. The soil temtem-perature profile at the climate station is planned to be replaced by ASIAQ in August 2006.
Monthly mean soil temperatures from M2 and M3 are given in Table 2.6. At these stations soil temperatures are measured continuously at 1 cm, 10 cm, 30 cm and 60 cm below the soil surface. Mean daily soil temperatures near the soil surface are shown in Figs 2.4 and 2.5. The warmer soil at M2 is a result of the isolating effect from the large seasonal snow patch.
Temperature in different settings and altitudes
GeoBasis operates a total of 40 TinyTag dataloggers for temperature monitoring in
different altitudes and different geomor-phological settings in the periglacial land-scape of Zackenberg. Positions of sites are given in Table 3.1 in Caning and Rasch (2001) and in Fig. 2.1.
During the winter 2004/2005 arctic foxes had eaten a lot of the installations. All together 12 out of the 40 TinyTags had cables and sensors chewed by foxes, and at the soil profiles P1, P6 and Sal-2 new sensors had to be installed.
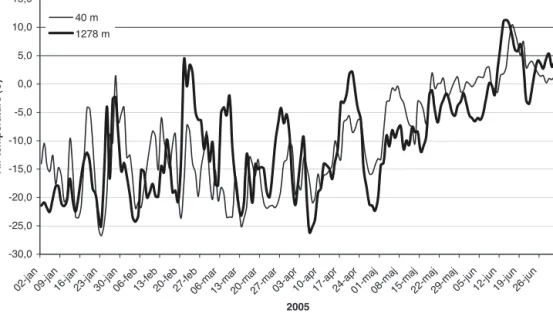
Annual mean temperatures in the peri-od 1996-2004 are given in Table 2.12. Due to periodic failures, it has not been pos-sible to calculate annual statistic for all loggers. However, data exist during a greater part of the year for several of these loggers. The new TinyTag installed in 2004 on top of Domebjerget (1278 m a.s.l.) show low temperatures in September and Octo-ber compared to the Climate station (40 m a.s.l.) and M3 (420 m a.s.l.), but at several occasions during February, March and April, the mean diurnal temperatures were way above the temperatures mea-sured at lower altitudes (Fig. 2.11) and
1995 1996 1997 1998 1999 2000 2001 2002 2003 2004 2005
West pond 4.6 Dry 5.6 10.6 30.5 8.6 2.6 9.6 <26.5 Dry
East pond 3.6 Dry 6.6 16.6 1.6 6.6 3.6 12.6 28.5 22.5
South pond <3.6 30.5 7.6 12.6 1.6 8.6 3.6 8.6 <26.5 <21.5
Lomsø 4.7 2.7 8.7 10.7 1.7 4.7 30.6 29.6 22.6 17.6
Rivulets <6.6 11.6 11.6 15.6 4.6 10.6 4.6 3.6 31.5 4.6
Zackenbergelven <26.5 <3.6 4.6 10.6 20.6 8.6 8.6 4.6 30.5 1.6 3.6
Young Sund (Zac.) 13.7 19.7 14.7 14.7 8.7 13.7 1.7 5.7 1.7 3.7
Young Sund (all) 12.7 13.7 22.7 22.7 24.7 17.7 23.7 8.7 8.7 8.7 7.7
Table 2.10. Visually esti-mated dates of 50% ice cover on selected ponds and lakes around the research station, together with start of running water in rivers and break up of the fjord ice in Young Sund during 1995-2003. “West pond“ and “East pond“ are the two ponds in Gadekæret north of the runway, “South pond“ is the major pond in Sydkærene south of the runway. “Rivulets“ are the streams draining the slopes of Aucellabjerg through Rylekærene. Zackenbergelven gives the initial date of genuine flow in the river. Young Sund break up is divided between break up of the fiord ice off Zacken-bergdalen and in the fiord in general. The 50% ice cover date for Lomsø is tentative, as it is estimated from the research station.
-90 -80 -70 -60 -50 -40 -30 -20 -10 0 150 160 170 180 190 200 210 220 230 240 250 Day of Year Active layer depth (cm ) 1997 1998 1999 2000 2001 2002 2003 2004 2005
Fig. 2.9. Thaw depth pro-gression in ZEROCALM-1, 1997-2005.
positive degree days were measured in February (9.5) and April (3.8). In 2006, it is planned to install a meteorological station at Domebjerget in order to collect more cli-matic variables from this altitude.
Break up of the fjord ice in Young Sund
On 31 May, the ice edge off Young Sund was observed to be many kilometres east of the fiord mouth and no open water was present around Sandøen. But already on 16 June there was open water between the island and the mainland coast, and a large open water area covered almost the whole width of the fjord towards Clavering Ø. In mid June, open water began to form in the fiord ice off the rivers, and the fiord ice be-tween Zackenbergdalen and Clavering Ø broke up during 30 June – 3 July. Already on 7 July, the ice had broken up all the way out to the sea. This is in line with the conditions during the three previous re-cord early years (Table 2.10).
Drifting pack ice entered the fjord on 10 July, where it remained for about two
weeks. Again on 8 August, much drift ice entered the outer part of Young Sund, whereas very little drift ice occurred during the rest of the season.
2.3 River water discharge and
chemistry
Spring break up of Zackenbergelven and secondary streams
Water began to run in Zackenbergelven 3 June 2005, which is not exceptionally early even though the spring temperatures were higher than the previous years (Table 2.2). Clear melt water was running in a small channel in the snow and ice covered bed and during the following week the stream increased gradually. The first water came from Lindemansdalen and when a small flood passed the station 5 June it was probably due to water entering from Store Sødal. The first water samples from the tributaries to Zackenbergelven were col-lected 7 June (Table 2.14). At that time, wa-ter was running in channels in the snow from Aucellabjerg and just starting to run
, , 243 -59,5 232 -42,6 239 -43,5 246 -43,6 -90 -80 -70 -60 -50 -40 -30 -20 -10 0 150 160 170 180 190 200 210 220 230 240 250 Day of Year Acti ve l ayer depth (cm )
Fig. 2.10. Thaw depth progression in ZERO-CALM-2, 1997-2005. 1997 1998 1999 2000 2001 2002 2003 2004 2005 ZEROCALM-1 61.7 65.6 60.3 63.4 63.3 70.5 72.5 76.3 79.4 ZEROCALM-2 57.4 59.5 43.6 59.8 59.7 59.6 63.4 65.0 68.6 Table 2.11. Maximum active layer depth in ZEROCALM-1 and ZERO-CALM-2 measured late August, 1997-2005. 1997 1998 1999 2000 2001 2002 2003 2004 2005