Network Analysis of Resting State EEG in
the Developing Young Brain: Structure
Comes With Maturation
Maria Boersma,
1*
Dirk J.A. Smit,
2Henrica M.A. de Bie,
3G. Caroline M. Van Baal,
4Dorret I. Boomsma,
2Eco J.C. de Geus,
2Henriette A. Delemarre-van de Waal,
5and Cornelis J. Stam
1 1Department of Clinical Neurophysiology, VU University Medical Center,
Amsterdam, The Netherlands
2
Department of Biological Psychology, VU University, Amsterdam, The Netherlands
3Department of Pediatrics, Pediatric Endocrinolgy, VU University Medical Center,
Amsterdam, The Netherlands
4
Department of Psychiatry, University Medical Center Utrecht, The Netherlands
5Department of Pediatrics, Leiden University Medical Center, Leiden, The Netherlands
r r
Abstract: During childhood, brain structure and function changes substantially. Recently, graph theory has been introduced to model connectivity in the brain. Small-world networks, such as the brain, combine opti-mal properties of both ordered and random networks, i.e., high clustering and short path lengths. We used graph theoretical concepts to examine changes in functional brain networks during normal development in young children. Resting-state eyes-closed electroencephalography (EEG) was recorded (14 channels) from 227 children twice at 5 and 7 years of age. Synchronization likelihood (SL) was calculated in three different fre-quency bands and between each pair of electrodes to obtain SL-weighted graphs. Mean normalized clustering index, average path length and weight dispersion were calculated to characterize network organization. Repeated measures analysis of variance tested for time and gender effects. For all frequency bands mean SL decreased from 5 to 7 years. Clustering coefficient increased in the alpha band. Path length increased in all fre-quency bands. Mean normalized weight dispersion decreased in beta band. Girls showed higher synchroni-zation for all frequency bands and a higher mean clustering in alpha and beta bands. The overall decrease in functional connectivity (SL) might reflect pruning of unused synapses and preservation of strong connections resulting in more cost-effective networks. Accordingly, we found increases in average clustering and path length and decreased weight dispersion indicating that normal brain maturation is characterized by a shift from random to more organized small-world functional networks. This developmental process is influenced
by gender differences early in development.Hum Brain Mapp 32:413–425, 2011. VC2010Wiley-Liss,Inc.
Key words: children; development; functional connectivity; synchronization; resting-state; EEG; graph theory; small-world networks
r r
Contract grant sponsor: Pfizer; Contract grant number:
OZ06045001 SGA; Contract grant sponsor: The Netherlands Organization for Scientific Research (NWO); Contract grant numbers: 560-265-052, 575-25-006, 480-04-004.
*Correspondence to: Maria Boersma, Department of Clinical Neuro-physiology, VU University Medical Center, De Boelelaan 1118, 1081 HV Amsterdam, The Netherlands. E-mail: [email protected]
Received for publication 7 October 2009; Revised 15 December 2009; Accepted 20 January 2010
DOI: 10.1002/hbm.21030
Published online 6 May 2010 in Wiley Online Library
INTRODUCTION
During childhood the brain is subjected to large struc-tural and functional changes. Deviation from normal de-velopment can have major consequences for our abilities as an adult, and may be involved in disorders such as ADHD, autism and schizophrenia [Bush, 2009; Lewis and Elman, 2008; Paus et al., 2008]. Therefore, knowledge of normal growth and developmental trajectories of brain networks is of great importance for finding risk factors and treatment of neuropsychiatric disorders.
During prenatal stages and early childhood the brain develops new neurons that proliferate, migrate and ran-domly grow abundant numbers of synapses to nearby neurons [Cayre et al., 2009; Goldman et al., 1997]. At pre-school age pruning of unused synapses and myelination of long axons starts and continues far into adolescence [Dubois et al., 2008; Huttenlocher and Dabholkar, 1997; Lebel et al., 2008; Paus et al., 2008; Paus, 2005]. At this mi-croscopic level the connectivity of neurons is influenced by neuronal activity, gene expression, hormones and sig-naling of supporting cells such as astrocytes [D’Ercole and Ye, 2008; Lustig, 1994; Rose et al., 2004; Sahara and O’Leary, 2009]. Macroscopically, brain anatomical matura-tion in childhood follows different growth trajectories for different regions. Maturation starts in sensorimotor areas and spreads to dorsal and parietal, superior temporal and dorsolateral prefrontal areas as reported by structural magnetic resonance (MR) and diffusion tensor imaging (DTI) studies measuring developmental changes in grey and white matter volumes and white matter integrity [Giedd et al., 2009; Marsh et al., 2008; Wilke et al., 2007] [Schmithorst et al., 2005]. An interesting question is how anatomical development is related to functional develop-ment. Whitford et al. [2007] reported on a relation between anatomical and functional developmental. The authors examined age groups between 10 and 30 years and showed developmental curvilinear decreases for both grey
matter volume and absolute electroencephalographic
(EEG) band power, i.e., spatially coherent synaptic activity, in corresponding brain regions. The authors suggest that the developmental reduction in grey matter corresponds to elimination of synapses, which is responsible for the decrease in power as measured with EEG. Thus, develop-mental changes in anatomical networks are accompanied by changes in functional networks.
Resting-state functional connectivity MRI (rs-fcMRI) studies have examined functional networks in the brain by correlating the spontaneous slow fluctuating blood oxy-genation level dependent (BOLD) responses between dif-ferent brain regions. Strong correlations are taken to represent strong functional connections. Cross-sectional studies examining the differences between children and adolescents showed stronger short-range and weaker long-range functional connectivity in children than in adoles-cents [Fair et al., 2007; Kelly et al., 2008]. At a higher tem-poral resolution, EEG studies found similar changes in
functional connectivity with development. Most of these studies reported on decreased coherence between short-distance and increased coherence between long-short-distance electrodes with development [Barry et al., 2004; Marosi et al., 1997; Srinivasan, 1999; Thatcher, 1992]. However, other resting-state EEG studies reported less specifically directed developmental changes. van Baal et al. measured children at 5 years of age with a follow up at 7 years of age and reported no change in short-distance connectivity (coherence between electrodes) and a decrease in long-dis-tance connections with normal development [van Baal et al., 2001]. A study in babies showed an inverted U cur-vilinear change in coherence with crawling experience suggesting a relation between coherence and learning behavior [Bell and Fox, 1996]. Furthermore, Thatcher examined young children (0–7 years) and reported on growth cycles, i.e., rapid increases lasting 0.5–1 years and subsequent decreases in coherence, occurring in cycles ev-ery 2–4 years during childhood [Thatcher, 1992]. In a recent study, Thatcher reproduced these findings on cyclic development in an extended group of children, ranging from infancy to 16 years of age, and using more advanced methods [Thatcher et al., 2009]. Changes in functional con-nectivity seem to be strengthening and weakening over time and with the development of skills.
Modern graph theory has recently been introduced to model complex communicating systems, such as the brain, as a network consisting of nodes and links (for review see [Bullmore and Sporns, 2009; Stam and Reijneveld, 2007]). The nodes represent some sort of processing unit and the links represent a relation between nodes, such as an ana-tomical connection or a functional interaction. Intuitively, the way nodes are interconnected by the links provides in-formation about the efficiency of a network. Networks in a regular, lattice-like configuration are characterized by high clustering (the probability that neighboring nodes are interconnected with other neighbouring nodes as well) and a long average path length (the average distance from one node to any other node in the network expressed as the number of links that have to be traveled). In contrast, random networks, in which there is a fixed probability p that a link exists between any two nodes, have low cluster-ing and a short average path length. Randomly rewircluster-ing of a certain fraction of links in a regular network will result in a small-world organization with high clustering and short path length [Watts and Strogatz, 1998]. These so-called small-world networks show highly efficient infor-mation spreading in the network due to the high cluster-ing and short paths between clusters [Latora and Marchiori, 2001]. Several imaging studies using different techniques such as MRI, EEG, and magnetoencephalogra-phy (MEG) measuring brain anatomical and functional networks have reported on high clustering and short path lengths and showed a small-world organization in both human and animals [Achard and Bullmore, 2007; Bullmore and Sporns, 2009; Micheloyannis et al., 2009; Smit et al., 2008; Sporns and Kotter, 2004; Sporns and Zwi, 2004; Stam
and Reijneveld, 2007; Stam, 2004; van den Heuvel et al., 2008].
Recently, three empirical cross-sectional studies reported on developmental changes in child and adolescent brain network organization. Fair et al. performed a study in age groups of 8, 13, and 25 years of age and used rs-fcMRI BOLD correlations in 34 regions of interest to calculate graph characteristics [Fair et al., 2009]. The authors found no changes in clustering and path length with age, but did show different configurations of sub-networks between children and adults suggesting that sub-networks are dif-ferently recruited in children than in adults. Using rs-fcMRI as well, Supekar et al. compared children (7–9 years) with young adults (19–22 years) and found no dif-ferences in clustering, path length and small-world organi-zation between both cross-sectional age groups. However, subcortical-cortical connectivity was stronger in children, and adults showed stronger cortico-cortical connectivity in this study [Supekar et al., 2009]. A resting-state EEG study compared a group of children (8–12 years) with a group of students (21–26 years) and showed a decrease in overall functional connectivity and decreases in clustering and path length in higher frequency bands with age [Michel-oyannis et al., 2009]. The aforementioned studies had cross-sectional designs and thus might lack in power, therefore, potentially missing out on subtle developmental changes in network organization. To map out develop-ment, studies should ideally have a longitudinal design starting at young age and with several follow-ups.
In the present longitudinal study, we investigated whether maturing young children develop towards a more structured brain network. To this end we use synchroniza-tion likelihood (SL) [Stam and van Dijk, 2002] as a general measure for functional connectivity in resting-state EEG recordings. From this measure we build weighted graphs to calculate the clustering index and path length and weight dispersion to examine developmental changes in young children measured at 5 years and at 7 years of age.
MATERIALS AND METHODS
Subjects
This study explored a dataset previously collected in a longitudinal study of genetic and environmental influences on neural development during childhood conducted in
209 twin pairs at 5 (M ¼5.2 years, SD ¼0.2) and 7 years
of age (M ¼ 6.8, SD ¼ 0.2) [van Baal et al., 1996, 2001].
The twins were all registered at the Netherlands Twin Register, which contains approximately 50% of all Dutch twins born after 1986 [Boomsma et al., 1992, 2006]. All par-ticipants were healthy, with normal IQ [Boomsma and van Baal, 1998], and normal or corrected to normal vision. Parents of the children gave written informed consent for their offspring to participate in the study. The study was approved by the Central Ethics Committee on Research Involving Human Subjects of the VU University Medical
Center, Amsterdam (IRB number IRB-2991 under Federal wide Assurance 3703) and was in agreement with the Dec-laration of Helsinki.
As we focused on developmental changes, we only included children with both an EEG measurement at 5 years of age and a repeated measurement at 7 years of age, resulting in complete datasets of 184 twin pairs and 5 single twins (376 children). Additionally, children were excluded if we could not find at least four artefact free epochs after visual inspection of the EEG recordings at
both measurement occasions (exclusion criteria are
described in the next section). At the first assessment, 13 children did not meet this strict criterion and at the second assessment another group of 13 children had no data that were free of artifacts. This resulted in inclusion of 227 chil-dren (102 boys, 125 girls) from 143 families having
meas-urements on both occasions at 5 (M¼5.2 years, SD¼ 0.2)
and 7 years of age (M¼6.8, SD¼0.2).
EEG Recordings
Detailed procedures of data collection are described elsewhere [van Baal et al., 1996]. In short, an electro-cap with electrodes in the 10–20 system of Jasper [Jasper, 1958] was used to measure brain activity during 3 min of quiet rest with eyes closed on 14 scalp locations (prefrontal: Fp1, Fp2; frontal: F7, F3, F4, F8; central: C3, C4; parietal: P3, P4; occipital: O1, O2). Vertical and horizontal eye movements were recorded bipolarly. EEG was recorded with linked ears reference according to the method described by Pivik et al. [1993], that is, two separate preamplifiers with high input impedance for each of the reference electrodes were used, and their output was linked electrically. All
elec-trode impedances were kept below 10 KX. EEG was
recorded continuously on an 18-channel Nihon Kohden
PV441A polygraph. Time constants (t) were set to 5
sec-onds [equivalent to 1/(2 pi t)¼ 0.003 Hz single pass
6 dB filter], high frequency cut-off was 35 Hz and sample frequency was 250 Hz. Signals were converted with a 12 bit AD converter.
For further processing the recordings were converted to ASCII files. For each subject we (MB) selected four artifact-free epochs of 4,096 samples (16,384 seconds) after visual inspection with DIGEEGXP software (developed by CS). Most typical artifacts were caused by (eye-) movements, drowsiness, actual sleep, muscle contractions, bad chan-nels, and clipping.
Power Spectrum
First, we computed a relative power spectrum averaged over all channels, epochs and all subjects for both the 5-and the 7-year-old group. For each epoch 5-and every scalp location the relative power spectrum ranging from 0.5 to 25 Hz was calculated by converting the raw EEG signal
from the time domain into the frequency domain using Fast Fourier Transformation (FFT) with a frequency
resolu-tion of 1/16,384 s ¼ 0.061 Hz. The power spectra
were averaged over all four epochs to obtain the averaged relative power spectrum for all 14 electrode positions. Fig-ure 1 shows the spectral analysis per electrode and aver-aged over all electrodes for both age groups.
As we found large individual differences in the alpha part of the spectrum and a developmental shift of the alpha peak, we chose to set one broad alpha band ranging from 6 to 11 Hz for further analysis. The other frequency
bands consequently ranged from 4 to 6 Hz (theta) and 11 to 25 Hz (beta).
SL Calculation
The signal in each epoch was digitally filtered in fre-quency bands of interest; theta (4–6 Hz), alpha (6–11 Hz) and beta (11–25 Hz). As a measure of functional connectiv-ity between different brain regions, we calculated the syn-chronization likelihood (SL) [Montez et al., 2006; Stam and Figure 1.
Relative power spectra at 5 and 7 years of age recorded from 14 EEG channels at the following scalp locations: prefrontal (Fp1; Fp2), frontal (F3; F4; F7; F8), central (C3; C4), parietal (P3; P4), temporal (T5; T6), and occipital (O1; O2). In all power spectra, the vertical markers on the X -scale correspond to 4 Hz steps in the spectrum starting at 0 Hz.Y-scale values are arbitrary due to computation of relative power spectra, ranging from 0 to 0.06 in all channels.
van Dijk, 2002]. An extended description of calculating SL can be found in the appendix. In short, we look for linear and nonlinear interdependencies between time series, for
example between the time seriesXandY. Therefore, both
Xand Yare converted to series of state space vectors (xi,
xj,: : :) and (yi,yj,: : :). First, recurrences of a specific vector
xiwithinXare sought. At the same momenti, vector yjis
defined and recurrences ofyjare sought inY. If the
recur-rences occur at the same moments it is likely thatX
influ-ences Y, or the other way around. SL takes into account
the recurrences ofXandYthat occur at the same moment
and varies between 0 and 1. Note that state space vectors
xiandyjdo not have to resemble each other. Therefore, SL
measures both linear and nonlinear synchronicity ofXand
Y, and is a measure of generalized synchronization
[Rul-kov et al., 1995].
The end result of computing SL for all pair-wise combi-nations of channels for a specific frequency band is a
square 14 14 matrix, i.e., 14 is the number of EEG
chan-nels used in this study. Each entryNx,ycontains the value
of the SL for the channel combination x and y.
Subse-quently, we computed the average synchronization result-ing in a sresult-ingle overall SL value for each epoch over the whole brain. Finally, this overall SL value was averaged over 4 epochs for each child.
Graph Analysis
In this study, we analyze developmental changes in the characteristics of the brain network as measured with EEG. The nodes in the graph are represented by the electrodes while the links are defined by the measure of association between the nodes, in this study SL. SL matri-ces were used to create weighted graphs and avoided set-ting of an arbitrary chosen threshold for the SL values. Figure 2 shows a schematic representation of the different steps involved in weighted graph analysis of the EEG data.
Full definitions for calculating the clustering index (Cw) and path length (Lw) for analysis of weighted networks have been described previously in a study by Stam and coworkers [Stam et al., 2009].
In short, the clustering index for a node represents the proportion of its neighboring nodes that are connected amongst each other. To calculate the clustering index from
weighted networks, the weights between nodeiand other
nodesjshould be symmetrical (wij¼ wji) and 0 wij1
as proposed by Onnela et al. [2005]. These conditions are met since we used SL value as weights:
Ci¼ P k6¼i P l6¼i l6¼k wikwilwkl P k6¼i P l6¼i l6¼k wikwil (1)
In the sums of this formulai¼k,i¼landk¼lare not
included
The mean clustering of the total network is defined as:
Cw¼ 1
N
XN i¼1
Ci (2)
To calculate path length of the weighted network the approach of Latora and Machiori [Latora and Marchiori, 2001] was applied. The length of an edge is defined as the
inverse of the weight, i.e.,Lij¼1/wijifwij=0, andLij¼
1if wij¼ 0. The shortest path between the nodes iandj
is the sum of the shortest lengths between two nodes. The averaged path length of the entire network is com-puted as Lw¼ 1 ð1=NðN1ÞÞPN i1 PN j6¼1ð1=LijÞ (3)
In this formula, the harmonic mean is used to handle disconnected edges resulting in infinite path lengths, i.e.,
1/1 !0 [Newman, 2003].
In this study, we further explored network development by adding a new measure that describes the assortativity
of the network and is called weight dispersion (ri).
Ram-asco and Gonsalves defined this measure as the range between the highest and lowest weights between every node in the network [Ramasco and Goncalves, 2007]:
ri¼WmaxðiÞ WminðiÞ
WmaxðiÞ þWminðiÞ (4)
Wmaxaccounts for the maximum weight and Wminfor the
minimum weight of the edges of nodei. Since we used SL
values as weights between nodes the range stayed
between 0 and 1. The average riover all the nodes of the
network was calculated (Wr)
Individual networks differ in structure, edge weights, and size, which influence the graph parameters of interest, i.e., clustering, path length and weight dispersion. To obtain measures that are independent of individual differ-ences in SL the parameters of the original measured net-works were compared to the mean of 50 random networks. Random networks were derived by randomly reshuffling the original edge weights. The three parame-ters of interest were then normalized by comparing them to the parameters computed and averaged over 50
randomized networks: Cw^ ¼ Cw= Cw -random; Lw^ ¼
Lw=Lw -random and Wr^ ¼ Wr =Wr -random. If Cw and^
^
Lw show values >1, average clustering and path length
are larger in the original network than in the randomized
network. If Wr^ shows a value larger than 1 this indicates
that the nodes in the original network are more disassorta-tive, i.e., having a larger range of weights, than a random network, which is assumed to be disassortative. If the orig-inal network has smaller weight ranges than a random
network,Wr^ <1, this indicates that nodes are more assor-tative in the original network.
Statistical Analysis
Statistical analysis was done with SPSS version 15 for MS-Windows. Synchronization data and graph measures
were not normally distributed for both age groups data,
hence were transformed using a natural log transform:y¼
ln(x). A repeated measures analysis of variance (ANOVA)
with time (5- and 7-year old) as within subjects factor and gender as between subjects factor was performed for each frequency band for SL values averaged over all electrode pairs and for normalized clustering coefficient, normalized average pathlength and normalized weight dispersion. Figure 2.
Schematic representation of graph analysis applied to EEG record-ings of brain activity. The first step (A) consists of filtering of the EEG signal in the frequency band of interest. Synchronization likeli-hood (SL) was calculated as a measure of generalized synchroniza-tion between all possible pairs of EEG channels (B), resulting in a synchronization diagram (C) with the likelihood of synchronization between channels indicated with black and white scale. Next, the synchronization matrix was converted to weighted graphs (D) with
links of varying thickness that represent SL between nodes (chan-nels). From these graphs, measures such as the clustering coeffi-cient (Cw) and path length (Lw) were computed. For comparisons, networks were randomized by shuffling the cells of the SL matrix, resulting in randomized graphs (E). From random graphs graph, pa-rameters were calculated and averaged. Finally, the ratio of the graphs parameters of the original networks and the mean of the graph parameters for the randomized networks was computed (F).
RESULTS
Power Spectrum
Figure 1 shows a double alpha peak in the average power spectrum for the children at 5 and 7 years of age.
The mean of both alpha peaks (8 Hz) is shifted to the
left compared to the peak for adults, which alpha bands ranges from 8 to 13 Hz. At 7 years of age the mean of the alpha peaks was found around 8.5 Hz. For SL calculations, we chose the alpha band around this 8 Hz peak from ranging from 6 to 11 Hz to capture as much synchronicity as possible. Consequently, the theta band was shortened, from 4 to 6 Hz and the beta band lowered, ranging from 11 to 25 Hz.
Synchronization Likelihood
Synchronization likelihood was calculated for children at 5 and 7 years of age in three different frequency bands. The results of the repeated measures analysis of variance of the log-transformed SL data for each frequency band are shown in Table I.
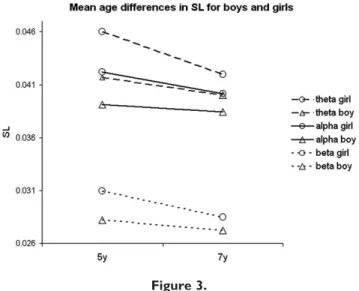
Figure 3 visualizes the direction of the changes in untransformed SL data over time for boys and girls. Highly significant effects were found for time as a within
subjects factor. Decreases were found in theta [F(1,225) ¼
30.116, P< 0.001], alpha [F(1,225)¼ 8.330,P¼ 0.004] and
beta [F(1,225) ¼ 29.367, P < 0.001] bands. Girls showed
higher mean SL values in theta [F(1,225) ¼ 14.616, P
<0.001], alpha [F(1,225) ¼ 8.025, P ¼ 0.005] and beta
[F(1,225) ¼16.796,P< 0.001] bands. A significant
interac-tion effect between time and gender was found in the beta
frequency band [F(1,225) ¼ 5.116, P ¼ 0.025], with girls
showing a larger decrease over time than boys.
Network Analysis
Table II presents the repeated measures ANOVA results for the log-transformed graph parameters in three fre-quency bands.
Highly significant effects for time as within subject fac-tor were found. The normalized clustering index increased
in the alpha band [F(1,225)¼7.087,P¼0.008], normalized
path length increased in theta [F(1,225) ¼ 28.297, P <
0.001], alpha [F(1,225) ¼30.989,P< 0.001] and beta bands
[F(1,225)¼ 55.416,P <0.001], and normalized weight
dis-persion decreased (weights get more assortative) in theta
[F(1,225) ¼ 8.188,P ¼0.005], alpha [F(1,225) ¼ 8.468,P ¼
0.004] and beta [F(1,225) ¼ 34.756, P < 0.001] bands, as
shown in Figures 4–6, respectively. Gender effects were found to be significant for the normalized clustering index, showing higher clustering in girls than in boys in the
alpha band [F(1,225) ¼ 10.966, P ¼ 0.001], beta band
[F(1,225) ¼ 9.207, P ¼ 0.003] and a trend in theta band
[F(1,225) ¼ 3.754, P ¼ 0.054] and the normalized weight
dispersion which was significantly lower for girls in the
beta band [F(1,225)¼7.153,P¼ 0.008]. A significant
inter-action effect was found for time and gender for the nor-malized weight dispersion in the alpha band, showing a larger decrease in girls and meaning that weights in girls
assort more with time than weights in boys [F(1,225) ¼
5.252,P¼0.023].
TABLE I. Repeated measures ANOVA of Average SL Values for each frequency band
Within-subjects Between-subjects
Time Timegender Gender
Theta F[225]¼30.116 F[225]¼3.539 F[225]¼14.616 P¼0.000 P¼0.061 P¼0.000 Alpha F[225]¼8.330 F[225]¼1.665 F[225]¼8.025 P¼0.004 P¼0.198 P¼0.005 Beta F[225]¼29.367 F[225]¼5.116 F[225]¼16.796 P¼0.000 P¼0.025 P¼0.000
Mean SL values for all cortical regions together were analyzed for
separate frequency bands. F-values and their significance are
shown, both for ‘‘within-subject’’ analysis (left of vertical line), and for ‘‘between-subject’’ analysis. Degrees of freedom are printed between square brackets. Bold text represents a significant effect on the variance in SL. Cursive text represents a trend.
Figure 3.
Mean SL over all epochs for boys and girls at 5 and 7 years of age in three frequency bands. The variance in SL was significantly lower in children at 7 years of age compared to that at 5 years of age in theta [F(1,225)¼ 30.116,P < 0.001], alpha [F(1,225) ¼ 8.330, P ¼ 0.004] and beta [F(1,225) ¼ 29.367, P < 0.001] band. Boys had significant lower SL in theta [F(1,225)¼14.616, P < 0.001], alpha [F(1,225) ¼ 8.025, P ¼ 0.005] and beta [F(1,225)¼ 16.796, P < 0.001] band. The beta frequency band showed a significant interaction effect between time and gender [F(1,225)¼5.116,P¼0.025].
As we performed a retrospective study in twins, we additionally tested for family effects. We randomly selected one twin of every included twin pair (81 girls, 63 boys) and performed similar repeated measures ANOVA TABLE II. Repeated measures ANOVA of graph
parameters for each frequency band
Within-subjects Between-subjects
Time Timegender Gender
Clustering index Theta F[225]¼1.643 F[225]¼2.386 F[225]¼3.754 P¼0.201 P¼0.124 P¼0.054 Alpha F[225]¼7.087 F[225]¼2.150 F[225]¼10.966 P¼0.008 P¼0.144 P¼0.001 Beta F[225]¼0.054 F[225]¼2.642 F[225]¼9.207 P¼0.816 P¼0.105 P¼0.003 Pathlength Theta F[225]¼28.297 F[225]¼0.001 F[225]¼0.194 P¼0.000 P¼0.977 P¼0.660 Alpha F[225]¼30.989 F[225]¼2.540 F[225]¼2.419 P¼0.000 P¼0.112 P¼0.121 Beta F[225]¼55.416 F[225]¼0.061 F[225]¼0.498 P¼0.000 P¼0.805 P¼0.481 Weight dispersion Theta F[225]¼8.188 F[225]¼0.010 F[225]¼0.244 P¼0.005 P¼0.919 P¼0.622 Alpha F[225]¼8.468 F[225]¼5.252 F[225]¼0.351 P¼0.004 P¼0.023 P¼0.554 Beta F[225]¼34.756 F[225]¼0.813 F[225]¼7.153 P¼0.000 P¼0.368 P¼0.008
Normalized graph parameters were analyzed for separated
fre-quency bands.F-values and their significance are shown, both for
‘‘within-subject’’ analysis (left of vertical line), and for ‘‘between-subject’’ analysis. Degrees of freedom are printed between square brackets. Bold text represents a significant effect on the variance in the graph parameters. Cursive text represents a trend.
Figure 4.
Mean normalized clustering index (Cw/Cw s) for boys and girls at 5 and 7 years of age in three frequency bands. The mean clustering index was significant higher in children of 7 years of age compared to children at 5 years of age in the alpha band (F ¼7.087,P¼0.008). Girls showed higher clustering in the alpha (F¼10.966,P¼0.001) and beta (F¼9.207,P¼0.003) bands.
Figure 5.
Mean normalized path length (Lw/Lw s) over all epochs for children at 5 and 7 years of age in three frequency bands. The mean normalized path length was significant higher in children at 7 years of age compared to children at 5 years of age in theta (F ¼28.297,P<0.001), alpha (F¼30.989,P<0.001) and beta (F ¼55.416,P<0.001) bands.
Figure 6.
Mean normalized weight dispersion over all epochs for boys and girls at 5 and 7 years of age in three frequency bands. Weight dispersion was significantly lower at 7 years of age compared to that at 5 years of age in the theta [F(1,225)¼8.188,P¼0.005], alpha [F(1,225) ¼ 8.468, P ¼ 0.004] and beta [F(1,225) ¼ 34.756,P <0.001] band. Girls had significant lower weight dis-persion in the beta band [F(1,225) ¼ 7.153, P ¼ 0.008].The alpha frequency band showed a significant interaction effect between time and gender [F(1,225)¼5.252,P¼0.023].
with time as within subjects factor and gender as between subjects factor. Significant time effects were found to be similar as for the large sample, except for weight disper-sion, where significance disappeared for the alpha band. The trend found for the gender effect in clustering coeffi-cient in the theta band became significant for this smaller sample.
DISCUSSION
We investigated the effects of development on func-tional brain networks using EEG in young children at 5 and 7 years of age. For all frequency bands, mean func-tional connectivity (SL) decreased over time, with girls showing a higher mean synchronization than boys. Nor-malized weighted clustering index and path length increased and the weight dispersion decreased with age. These changes reflect a shift of the functional network from a random topology towards a more structured orga-nization. Gender effects were found for brain network structure, with girls showing higher mean clustering in the alpha and beta bands and lower weight dispersion in the beta band.
This longitudinal study showed that maturation in a group of young children, measured at 5 and at 7 years of age, leads to decreased whole brain functional connectiv-ity, i.e., a decrease in the average whole brain SL. Local developmental changes in functional connectivity between the 14 different areas have previously been described by van Baal, reporting on decreases in posterior short-dis-tance coherences and decreases in all long-disshort-dis-tance coher-ences, while anterior short-distance coherences did not change over time [van Baal et al., 2001]. In line with our findings, a study methodologically closely related to our study, found that children (8–12 years) had higher average synchronization likelihood than adults (21–26 years) both in rest and during task conditions [Micheloyannis et al., 2009]. Most resting-state EEG studies that examined devel-opmental effects on functional connectivity in children had cross-sectional designs and compared groups of older chil-dren (>7 years) with adults. Most of these studies reported that functional connectivity weakened for short-distances while long-distance functional connectivity was stronger in the older brain compared to the child groups [Barry et al., 2004; Marosi et al., 1997; Srinivasan, 1999; Thatcher, 1992]. These findings agree with the changes found with structural and functional MRI studies, namely decreases in short and increases in long range connectivity with child development, suggesting different developmen-tal trajectories for different brain regions [Fair et al., 2008; Giedd et al., 2009; Schmithorst et al., 2005]. Interestingly, Thatcher suggested that development in children is pro-grammed in cycles with periods of increases and decreases in coherences with different offsets in different regions [Thatcher et al., 2009; Thatcher, 1992]. Thatcher suggested that these developmental cycles involve local excessive
production of synaptic connections followed by pruning of the unused connections and that this process is influenced by environmental factors. Our results and previous studies indicate that the organization of the brain and its dynam-ics are changing continuously with development in rest and during task [McIntosh et al., 2008; Micheloyannis et al., 2009] in young children and it is suggested that mat-uration processes such as pruning are involved in shaping the brain’s connections [Dubois et al., 2008; Huttenlocher and Dabholkar, 1997; Lebel et al., 2008; Paus et al., 2008; Paus, 2005].
Next, we used graph theoretical tools to examine changes in functional brain organization with development in young children. A recent study showed that graph char-acteristics are (highly) reproducible and proved them to be reliable input for a repeated measurement analysis as we also used in our study [Deuker et al., 2009]. In addition to the decrease in whole brain functional connectivity with development, we found small but significant increases in clustering, path length and a decrease in weight dispersion (more assorted weights) suggesting that the brain shifts from random towards more ordered, small-world like con-figurations. The increase in clustering in functional net-works means that the neighbors of a node synchronize stronger with each other in older children than in younger. Note that a neighboring node in a weighted functional net-work is defined as having strong functional connections with its neighbors, irrespective of physical distance. Thus, neighbors in function are not necessarily neighbors in space. Increased clustering could indicate that the effec-tiveness of information transfer between clusters of nodes is increased. Path length increased with age, meaning that the shortest route from one node to any other node increased. The increase in both clustering and path length indicates that the networks shift towards a more ordered
configuration. Complementary to these results, we
observed a decrease in the dispersion of the weights. A decrease in weight dispersion means a smaller difference between the largest and smallest weights, which indicates that the weights of all links connected to a node assort more with development and that the networks shifts towards a more ordered configuration. This is in line with the idea that with maturation the child brain might prune inefficient connections while preserving and strengthening those that keep the networks in efficient configurations (i.e., highly interconnected networks with low cost).
Our findings are supported by results of studies simu-lating development in neural models that apply a specific learning rule. Siri et al. started from a random recurrent network of 500 neurons with sparse connections and sepa-rate populations of excitatory and inhibitory neurons resulting in a variety of spontaneous neural dynamics. Rewiring of the random network by applying a Hebbian learning rule (that preserves the strongest connections and removes the weakest) increased clustering coefficient and path length thereby reforming the random organization into a more ordered small-world organization of the
strongest connections. [Siri et al., 2007]. Van den Berg et al. studied the effect of a rewiring rule on a network of randomly coupled chaotic maps in a wide range of work sizes. The authors found that with increasing net-work size, whilst keeping the percentage of connections constant, clustering reached stable values whereas the path length decreased resulting in networks with a small-world structure. They suggested this finding was related to the distribution of connections in a sparsely connected network: larger networks showed more hubs than smaller networks, indicating that the sparsely connected network needs a certain minimal size to develop hubs [van den Berg and van Leeuwen, 2004]. Kwok et al. used 300 ran-domly connected spiking neurons with bursting and irreg-ular firing activity and showed that applying a rewiring rule similar to the one used by Van den Berg and Van Leeuwen [2004] resulted in small increases in path length and more substantial increases in clustering coefficient [Kwok et al., 2007]. Thus, despite the differences in the original network structure and dynamics, applying a rewiring rule leads to increases in clustering and path length thereby shifting towards more ordered small-world configurations. Consecutively, Rubinov et al. showed that coupled nodes with chaotic dynamics generate ordered functional patterns even if the underlying network is ran-domly connected [Rubinov et al., 2009]. They showed that the structural connectivity subsequently rewires towards these functional patterns. They suggest that on slow time scales functional networks reflect the underlying structural networks. At faster time scales with highly ordered func-tional patterns and ongoing rewiring, the structure remained in a small-world like configuration.
In conclusion, these simulation studies showed that starting from initial random structural topology with dif-ferent size, configuration or dynamics, the network adjusts according to a use-it-or-lose-it learning rules and tends to rewire functional networks into a small-world configura-tion and subsequently might influence the structural con-figuration. This is consistent with our observations of a shift towards a more ordered small-world organization with development.
Resting-state fcMRI studies can use independent compo-nent analysis to define functionally connected networks [Stevens et al., 2009]. They found stronger within but reduced between network-connectivity which is in line with previous findings of Fair et al. [2008]. Recently, Fair et al. performed the first empirical rs-fcMRI study that an-alyzed brain development in a large cross-sectional group (7–31 years) using network analysis [Fair et al., 2009]. A similar study was performed in two age groups (7–9 vs. 19–22 years) by Supekar et al. [2009]. Both studies reported that clustering and path length did not differ significantly between the different age groups considered. In contrast with these studies, using EEG, we did observe a small but significant increase in clustering and path length with repeated measures in a large group of younger children. This difference in results might be explained by the
repeated measures design of our study, resulting in increased statistical power. Another explanation might be that we simply measured at an earlier more dynamical moment (5 and 7 years) on the maturation trajectories than other developmental studies [Huttenlocher and Dabholkar, 1997; Paus et al., 2008]. A third explanation might be the difference in temporal resolution between EEG and fMRI. Similar to our study, Micheloyannis et al. performed an EEG study and did find a developmental effect, namely decreased in clustering and path length with age [Michel-oyannis et al., 2009]. Rubinov et al. suggested from simula-tion data that at slow time scales funcsimula-tional connectivity reflects and shapes the underlying structural networks but less at a faster temporal scale functional organization [Rubinov et al., 2009]. Thus, developmental rs-fcMRI stud-ies might reflect changes of the gross underlying structural networks since it measures at slow time scales, whereas EEG probably might be sensitive to other more subtile de-velopmental processes influencing functional networks.
In addition to age dependent effects, we studied the effect of gender on the functional networks since hor-mones have been implied in the regulation of brain net-work development [Lustig, 1994]. The results show stronger synchronization for girls than boys in all fre-quency bands. The literature is not conclusive about on gender effects on functional connectivity. One EEG study reported on boys showing stronger long distance intrahe-mispheric coherence than girls in the alpha and beta bands [Barry et al., 2004]. Other EEG studies examined regional or hemispheric differences between boys and girls. Long-distance and interhemispherical coherences were found to be higher more often in boys than in girls [Hanlon et al., 1999; Marosi et al., 1997; Thatcher, 1992]. A MEG study found higher intrahemispheric connectivity (SL) in the lower alpha band in males than in females (19–30 years) [Gootjes et al., 2006]. To our knowledge, we are the first to observe gender differences in network parameters such as clustering coefficient, path length and weight dispersion in children. Girls showed stronger clustering than boys in alpha and beta bands and lower weight dispersion in the beta band. This suggests that girls have more ordered net-works than boys at this young age. These findings might indicate that already at young age girls and boys brains wire up differently. Girls might precede boys traveling a similar developmental trajectory or alternatively boys and girls might travel different trajectories. Findings from structural MRI on development of white matter fibers raised the same questions [Marsh et al., 2008].
In all three frequency bands, path length increased and weight dispersion decreased with age. Clustering index showed a significant increase in the alpha band and a trend in the theta band. Different frequency bands are related to different cognitive functions. Recently, both a rs-fcMRI and a structural DTI study showed an inverse rela-tion between path length and IQ in healthy adults, sug-gesting that a shorter path length in the whole brain network is crucial for efficient information processing in
smarter brains [Li et al., 2009; van den Heuvel et al., 2009]. In young children different cognitive functions develop at different moments. Shaw et al. showed that the cortical thickness of children with higher IQ peaks at a later moment in childhood than in children with lower IQ [Shaw, 2007; Shaw et al., 2006]. Others hypothesized that deviation from normal developmental trajectories might result in adolescent brains vulnerable to psychiatric disor-ders [Paus et al., 2008]. Network analysis might contribute to understanding how deviations in development might change or influence intelligence later in life.
One limitation of studying young children is the choice of frequency bands. Using adult frequency bands would have split up the alpha band at 8 Hz—where children tend to have maximum power in the alpha band—thereby defining a large part of alpha synchronization as theta syn-chronization. We decided to use one alpha frequency band ranging from 6 to 11 Hz, capturing all possible alpha oscil-lations in children. Consequently, the theta band was shortened, ranging from 4 to 6 Hz. In this way, we tried to capture as much synchronicity as possible in the next steps of our analysis.
Another potential confound is that local functional con-nectivity measures such as SL, and the clustering coeffi-cient, could have been influenced by volume conduction, which is defined by an exponential and smooth decrement in magnitude from a point source causing erroneous corre-lations between nearby channels. However, we used a small number of EEG channels with large interelectrode distances (>7 cm) reducing the chance that neighboring channels pick up highly correlating signals from a com-mon source [Nunez et al., 1997]. In addition, the effects of volume conduction might be expected to decrease with age since a child’s head grows and the electrodes are placed more distant from each other in the older children. Therefore, the increase in the clustering coefficient is unlikely to reflect spurious effects of volume conduction alterations due to head size growth.
Even though we could only create a graph with 14 nodes, we were able to show significant changes in graph parameters. We found significant developmental increases in the clustering coefficient and decreases in path length and weight dispersion. This suggests that maturation robustly changes network parameters of the brain, even in a simple presentation of 14 nodes. However, increasing the number of nodes in the network would give the op-portunity to calculate more sophisticated graph parameters such as modularity, which would inform us in more detail how clusters of nodes are interconnected.
CONCLUSIONS
We found decreased synchronization of brain areas with development and an increase in structure in the functional networks, i.e., a shift towards a more ordered, small-world like configuration. The brain gains structure with
matura-tion. These findings suggest that in younger children more noisy connections exist that interfere with useful connec-tivity. Maintaining these useless connections will cost energy. During maturation, the brain preserves only the effective synapses and prunes those that are noisy, thereby shaping the networks to its most effective configuration.
In addition, we found gender effects with girls showing stronger synchronization, higher clustering and lower weight dispersion, suggesting that girls lead boys or fol-low a different trajectory in developing an efficiently struc-tured brain.
ACKNOWLEDGMENTS
The authors thank Peterjan Ris and Saskia Oudkerk who helped to check the EEG epochs on artefacts. They also thank Marinka Koenis and Arjan Hillebrand for carefully reading their article.
REFERENCES
Achard S, Bullmore E (2007): Efficiency and cost of economical brain functional networks. PLoS Comput Biol 3:0174–0183. Barry RJ, Clarke AR, McCarthy R, Selikowitz M, Johnstone SJ,
Rushby JA (2004): Age and gender effects in EEG coherence. I. Developmental trends in normal children. Clin Neurophysiol 115:2252–2258.
Bell MA, Fox NA (1996): Crawling experience is related to changes in cortical organization during infancy: Evidence from EEG coherence. Dev Psychobiol 29:551–561.
Boomsma DI, Orlebeke JF, van Baal GC (1992): The Dutch Twin Register: Growth data on weight and height. Behav Genet 22:247–251.
Boomsma DI, van Baal GC (1998): Genetic influences on child-hood IQ in 5- and 7-year-old Dutch twins. Developmental Neuropsychology 14:115–126.
Boomsma DI, de Geus EJ, Vink JM, Stubbe JH, Distel MA, Hot-tenga JJ, Posthuma D, Van Beijsterveldt TC, Hudziak JJ, Bartels M, Willemsen G (2006): Netherlands Twin Register: From twins to twin families. Twin Res Hum Genet 9:849–857. Bullmore E, Sporns O (2009): Complex brain networks: Graph
the-oretical analysis of structural and functional systems. Nat Rev Neurosci 10:186–198.
Bush G (2010): Attention-deficit/hyperactivity disorder and atten-tion networks. Neuropsychopharmacology 35:278–300. Cayre M, Canoll P, Goldman JE (2009): Cell migration in the
nor-mal and pathological postnatal mamnor-malian brain. Prog Neuro-biol 88:41–63.
Deuker L, Bullmore ET, Smith M, Christensen S, Nathan PJ, Rock-stroh B, Bassett DS (2009): Reproducibility of graph metrics of human brain functional networks. Neuroimage 47:1460–1468 Dubois J, haene-Lambertz G, Perrin M, Mangin JF, Cointepas Y,
Duchesnay E, Le Bihan D, Hertz-Pannier L (2008): Asynchrony of the early maturation of white matter bundles in healthy infants: Quantitative landmarks revealed noninvasively by dif-fusion tensor imaging. Hum Brain Mapp 29:14–27.
Fair DA, Dosenbach NUF, Church JA, Cohen AL, Brahmbhatt S, Miezin FM, Barch DM, Raichle ME, Petersen SE, Schlaggar BL (2007): Development of distinct control networks through
segregation and integration. Proc Natl Acad Sci USA 104:13507–13512.
Fair DA, Cohen AL, Dosenbach NUF, Church JA, Miezin FM, Barch DM, Raichle ME, Petersen SE, Schlaggar BL (2008): The maturing architecture of the brain’s default network. Proc Natl Acad Sci USA 105:4028–4032.
Fair DA, Cohen AL, Power JD, Dosenbach NUF, Church JA, Mie-zin FM, Schlaggar BL, Petersen SE (2009): Functional brain net-works develop from a ‘‘local to distributed’’ organization. PLoS Comput Biol 5:e1000381.
Giedd JN, Lalonde FM, Celano MJ, White SL, Wallace GL, Lee NR, Lenroot RK (2009): Anatomical brain magnetic resonance imaging of typically developing children and adolescents. J Am Acad Child Adolesc Psychiatry 48:465–470.
Goldman JE, Zerlin M, Newman S, Zhang L, Gensert J (1997): Fate determination and migration of progenitors in the post-natal mammalian CNS. Dev Neurosci 19:42–48.
Gootjes L, Bouma A, Van Strien JW, Scheltens P, Stam CJ (2006): Attention modulates hemispheric differences in functional connec-tivity: Evidence from MEG recordings. Neuroimage 30:245–253 Hanlon HW, Thatcher RW, Cline MJ (1999): Gender differences in
the development of EEG coherence in normal children. Dev Neuropsychol 16:479–506.
Huttenlocher PR, Dabholkar AS (1997): Regional differences in synaptogenesis in human cerebral cortex. J Comp Neurol 387:167–178.
Jasper HH (1958): Report of the committee on methods of clinical examination in electroencephalography. Electroencephalogr Clin Neurophysiol 10:370–375.
Joseph D’Ercole A, Ye P (2008): Expanding the mind: Insulin-like growth factor I and brain development. Endocrinology 149:5958–5962.
Kelly AM, Di MA, Uddin LQ, Shehzad Z, Gee DG, Reiss PT, Mar-gulies DS, Castellanos FX, Milham MP (2009): Development of anterior cingulate functional connectivity from late childhood to early adulthood. Cereb Cortex 19:640–657.
Kwok HF, Jurica P, Raffone A, van Leeuwen C (2007): Robust emergence of small-world structure in networks of spiking neurons. Cogn Neurodyn 1:39–51.
Latora V, Marchiori M (2001): Efficient behavior of small-world networks. Phys Rev Lett 87:198701.
Lebel C, Walker L, Leemans A, Phillips L, Beaulieu C (2008): Microstructural maturation of the human brain from childhood to adulthood. Neuroimage 40:1044–1055.
Lewis JD, Elman JL (2008): Growth-related neural reorganization and the autism phenotype: A test of the hypothesis that altered brain growth leads to altered connectivity. Dev Sci 11:135–155. Li Y, Liu Y, Li J, Qin W, Li K, Yu C, Jiang T (2009): Brain
anatom-ical network and intelligence. PLoS Comput Biol 5:e1000395. Lustig RH (1994): Sex hormone modulation of neural
develop-ment in vitro. Horm Behav 28:383–395.
Marosi E, Harmony T, Reyes A, Bernal J, Fernandez T, Guerrero V, Rodriguez M, Silva J, Yanez G, Rodriguez H (1997): A fol-low-up study of EEG coherences in children with different pedagogical evaluations. Int J Psychophysiol 25:227–235. Marsh R, Gerber AJ, Peterson BS (2008): Neuroimaging studies of
normal brain development and their relevance for understand-ing childhood neuropsychiatric disorders. J Am Acad Child Adolesc Psychiatry 47:1233–1251.
McIntosh AR, Kovacevic N, Itier RJ (2008): Increased brain signal variability accompanies lower behavioral variability in devel-opment. PLoS Comput Biol 4:e1000106.
Micheloyannis S, Vourkas M, Tsirka V, Karakonstantaki E, Kanat-souli K, Stam CJ (2009): The influence of ageing on complex brain networks: A graph theoretical analysis. Hum Brain Mapp 30:200–208.
Montez T, Linkenkaer-Hansen K, van Dijk BW, Stam CJ (2006): Synchronization likelihood with explicit time-frequency priors. Neuroimage 33:1117–1125.
Newman MEJ (2003): The structure and function of complex net-works. SIAM Review 45:167–256.
Nunez PL, Srinivasan R, Westdorp AF, Wijesinghe RS, Tucker DM, Silberstein RB, Cadusch PJ (1997): EEG coherency. I: Sta-tistics, reference electrode, volume conduction, Laplacians, cortical imaging, and interpretation at multiple scales. Electro-encephalogr Clin Neurophysiol 103:499–515.
Onnela JP, Saramaki J, Kertesz J, Kaski K (2005): Intensity and co-herence of motifs in weighted complex networks. Phys Rev E Stat Nonlin Soft Matter Phys 71:065103.
Paus T (2005): Mapping brain maturation and cognitive develop-ment during adolescence. Trends Cogn Sci 9:60–68.
Paus T, Keshavan M, Giedd JN (2008): Why do many psychiatric dis-orders emerge during adolescence? Nat Rev Neurosci 9:947–957. Pivik RT, Broughton RJ, Coppola R, Davidson RJ, Fox N, Nuwer
MR (1993): Guidelines for the recording and quantitative anal-ysis of electroencephalographic activity in research contexts. Psychophysiology 30:547–558.
Ramasco JJ, Goncalves B (2007): Transport on weighted networks: When the correlations are independent of the degree. Phys Rev E 76:066106.
Rose AB, Merke DP, Clasen LS, Rosenthal MA, Wallace GL, Vai-tuzis AC, Fields JD, Giedd JN (2004): Effects of hormones and sex chromosomes on stress-influenced regions of the develop-ing pediatric brain. Ann N Y Acad Sci 1032:231–233.
Rubinov M, Sporns O, van Leeuwen C, Breakspear M (2009): Symbiotic relationship between brain structure and dynamics. BMC Neurosci 10:55.
Rulkov N, Sushchik M, Tsimring L, Abarbanel H (1995): General-ized synchronization of chaos in directionally coupled chaotic systems. Phys Rev E 51:980–994.
Sahara S, O’Leary DDM (2009): Fgf10 regulates transition period of cortical stem cell differentiation to radial glia controlling generation of neurons and basal progenitors. Neuron 63:48–62. Schmithorst VJ, Wilke M, Dardzinski BJ, Holland SK (2005):
Cog-nitive functions correlate with white matter architecture in a normal pediatric population: A diffusion tensor MRI study. Hum Brain Mapp 26:139–147.
Shaw P (2007): Intelligence and the developing human brain. Bio-essays 29:962–973.
Shaw P, Greenstein D, Lerch J, Clasen L, Lenroot R, Gogtay N, Evans A, Rapoport J, Giedd J (2006): Intellectual ability and cortical devel-opment in children and adolescents. Nature 440:676–679.
Siri B, Quoy M, Delord B, Cessac B, Berry H (2007): Effects of Hebbian learning on the dynamics and structure of random networks with inhibitory and excitatory neurons. J Physiol Paris 101:136–148.
Smit DJA, Stam CJ, Posthuma D, Boomsma DI, de Geus EJC (2008): Heritability of ‘‘small-world’’ networks in the brain: A graph theoretical analysis of resting-state EEG functional con-nectivity. Hum Brain Mapp 29:1368–1378.
Sporns O, Kotter R (2004): Motifs in brain networks. PLoS Biol 2:e369.
Sporns O, Zwi JD (2004): The small world of the cerebral cortex. Neuroinformatics 2:145–162.
Srinivasan R (1999): Spatial structure of the human alpha rhythm: Global correlation in adults and local correlation in children. Clin Neurophysiol 110:1351–1362.
Stam CJ (2004): Functional connectivity patterns of human magne-toencephalographic recordings: A ‘‘small-world’’ network? Neurosci Lett 355:25–28.
Stam CJ, Reijneveld JC (2007): Graph theoretical analysis of com-plex networks in the brain. Nonlinear Biomed Phys 1:3. Stam CJ, van Dijk BW (2002): Synchronization likelihood: An
unbiased measure of generalized synchronization in multivari-ate data sets. Physica D 163:236–251.
Stam CJ, de HW, Daffertshofer A, Jones BF, Manshanden I, van Cappellen van Walsum AM, Montez T, Verbunt JP, de Munck JC, van Dijk BW, Berendse HW, Scheltens P (2009): Graph theoretical analysis of magnetoencephalographic func-tional connectivity in Alzheimer’s disease. Brain 132:213–224. Stevens MC, Pearlson GD, Calhoun VD (2009): Changes in the
interaction of resting-state neural networks from adolescence to adulthood. Hum Brain Mapp 30:2356–2366.
Supekar K, Musen M, Menon V (2009): Development of large-scale functional brain networks in children. PLoS Biol 7:e1000157.
Thatcher RW (1992): Cyclic cortical reorganization during early childhood. Brain Cogn 20:24–50.
Thatcher RW, North DM, Biver CJ (2009): Self-organized criticality and the development of EEG phase reset. Hum Brain Mapp 30:553–574.
van Baal GC, de Geus EJ, Boomsma DI (1996): Genetic architec-ture of EEG power spectra in early life. Electroencephalogr Clin Neurophysiol 98:502–514.
van Baal GC, Boomsma DI, de Geus EJ (2001): Longitudinal genetic analysis of EEG coherence in young twins. Behav Genet 31:637–651.
van den Berg D, van Leeuwen C (2004): Adaptive rewiring in cha-otic networks renders small-world connectivity with consistent clusters. Europhys Lett 65:459–464.
van den Heuvel MP, Stam CJ, Boersma M, Hulshoff Pol HE (2008): Small-world and scale-free organization of voxel-based resting-state functional connectivity in the human brain. Neu-roimage 43:528–539.
van den Heuvel MP, Stam CJ, Kahn RS, Hulshoff Pol HE (2009): Efficiency of functional brain networks and intellectual per-formance. J Neurosci 29:7619–7624.
Watts DJ, Strogatz SH (1998): Collective dynamics of ‘‘small-world’’ networks. Nature 393:440–442.
Whitford TJ, Rennie CJ, Grieve SM, Clark CR, Gordon E, Williams LM (2007): Brain maturation in adolescence: Concurrent changes in neuroanatomy and neurophysiology. Hum Brain Mapp 28:228–237.
Wilke M, Krageloh-Mann I, Holland SK (2007): Global and local development of gray and white matter volume in normal chil-dren and adolescents. Exp Brain Res 178:296–307.
APPENDIX
The time series, the EEG signals recorded from channels
X and Y, are converted to a series of state space vectors
using the method of time delay embedding [Stam, 2005]:
Xi¼ ðxi;xiþL;xiþ2L; : : : ;xiþðm1ÞLÞ
where L is the time lag and m is the embedding
dimen-sion. As described by Montez [Montez et al., 2006] the
time lag (L) depends on the sample frequency (fs) and the
highest frequency of interest (HF):
L¼fs=3HF
The embedding dimension (m) depends on the lowest
frequency (LF) of interest and determines the length of the embedding window:
L ðmlÞ ¼fs=LF$m¼3HF=LFþl
Vector Xirepresents the state of systemXat timeiin a
time interval with lengthL(m1).
In the same channel X recurrences of the vector Xiare
sought at time j. Therefore, a threshold distance fix in
state space is chosen such that a fixed portion (pref) of the
compared vectors is close enough to consider them to be
in the same state. Five percent of the vectors Xj will be
considered as recurrences ofXigiven apref¼0.05.
To prevent finding autocorrelations time point j should
be at sufficient time distance from i. A window W1 is
defined around time iand is called the Theiler correction
for autocorrelation [Theiler, 1986]. IfW1 is twice the length
of the embedding vectors [W1¼ 2 L (m 1)], then
two consecutive vectors only share one sample point.
To capture a sufficient number of vectors to takeprefof them
defining the recurrences a second windowW2 is defined:
nrec¼ ðW2W1þ1Þ pref
wherenrecis the number of recurrences.
State space vectors of the EEG signal in channel Y are
constructed and with the same value for pref a search for
recurrences is done.
The SL is now defined as the likelihood that the distance
between vectors yi andyjwill be smaller than a threshold
distance fiy given that at the same time pointsiandjthe
distance betweenxiandxjis smaller than a threshold
dis-tancefix:
Si¼1=NRjhðfiyYiYjÞhðfixXiXjÞ
where y is the Heaviside step function that returns 0 for
values<0 and 1 for values0.
Nrepresents the number of recurrences in signalX, i.e.:
RjhðfixXiXjÞ
The overall SL betweenXand Yis the average over all