Identification and Evaluation of
Predictors for Learning Success and of
Models for Teaching Computer
Programming in Contemporary
Contexts
By
Nick Day
A thesis submitted in partial fulfilment of the University’s
requirements for the Doctor of Philosophy
March 2020
Buckinghamshire New University
Coventry University
COPYRIGHT
This copy of the thesis has been supplied on condition that anyone who consults it is
understood to recognise that its copyright rests with its author under the terms of the United Kingdom Copyright Acts. No quotation from the thesis and no information derived from it may be published without proper acknowledgement.
i
Abstract
Introductory undergraduate computer programming courses are renowned for higher than average failure and withdrawal rates when compared to other subject areas. The closer partnership between higher education and the rapidly expanding digital technology industry, as demonstrated by the establishment of new Degree Apprenticeships in computer science and digital technologies, requires efficient and effective means for teaching programming skills. This research, therefore, aimed to identify reliable predictors of success in learning programming or vulnerability to failure. The research also aimed to evaluate teaching methods and remedial interventions towards
recommending a teaching model that supported and engaged learners in contemporary contexts that were relevant to the workplace.
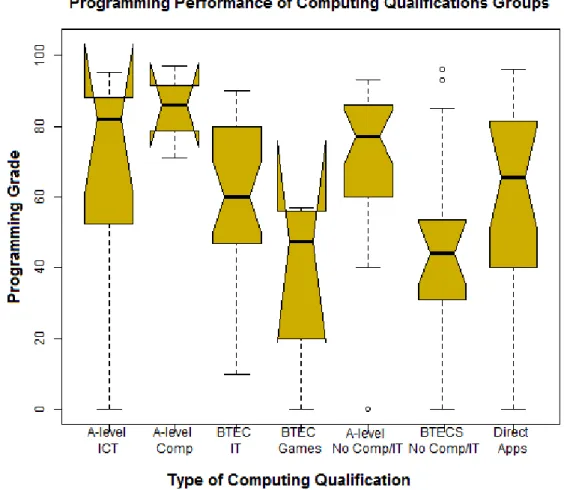
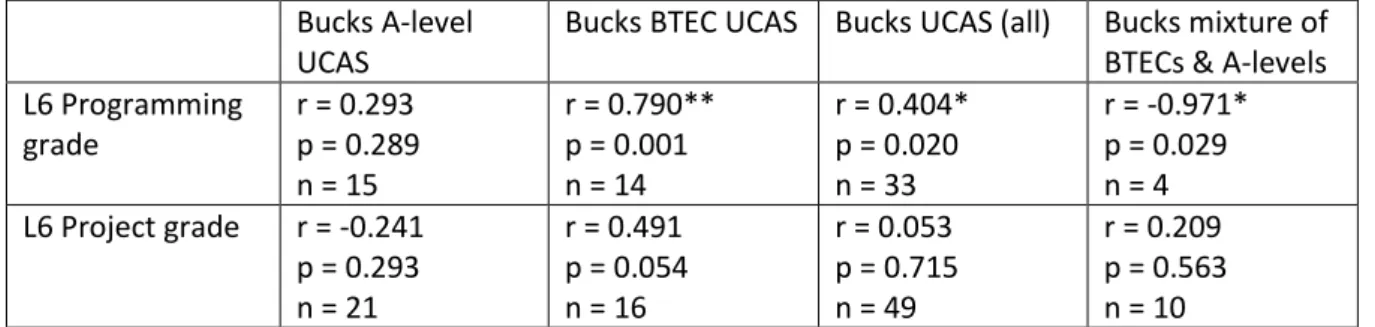
Investigation of qualifications designed to prepare students for undergraduate computer science courses revealed that A-level entrants achieved significantly higher programming grades than BTEC students. However, there was little difference between the grades of those with and those without previous qualifications in computing or ICT subjects.
Analysis of engagement metrics revealed a strong correlation between extent of co-operation and programming grade, in contrast to a weak correlation between programming grade and code understanding. Further analysis of video recordings, interviews and observational records distinguished between the type of communication that helped peers comprehend tasks and concepts, and other forms of communication that were only concerned with completing tasks. Following the introduction of periodic assessment, essentially converting a single final assessment to three staged summative assessment points, it was found that failing students often pass only one of the three assignment parts. Furthermore, only 10% of those who failed overall had attempted all three assignments. Reasons for failure were attributed to ‘surface’ motivations (such as regulating efforts to achieve a minimum pass of 40%), ineffective working habits or stressful personal circumstances rather than any fundamental difficulty encountered with subject material.
A key contribution to pedagogical practice made by this research is to propose an ‘incremental’
teaching model. This model is informed by educational theory and empirical evidence and comprises short cycles of three activities: presenting new topic information, tasking students with a relevant exercise and then demonstrating and discussing the exercise solution. The effectiveness of this model is evidenced by increased engagement, increased quiz scores at the end of each teaching session and increased retention of code knowledge at the end of the course.
ii
Contents
Chapter 1 Introduction ... 1-1
1.1 UK’s growing digital technology industry ... 1-1 1.1.1 Job creation in the computing industries ... 1-2 1.1.2 The shortage of skills in digital technologies ... 1-3 1.2 The current state and challenges in computer science education ... 1-3 1.2.1 The new 2014 computing school curriculum ... 1-4 1.2.2 Non-continuation rates in undergraduate computer science degree courses ... 1-5 1.3 Trends in Higher Education... 1-6 1.3.1 Increased Higher Education participation rates in the UK ... 1-6 1.3.2 Computer science application trends ... 1-8 1.3.3 Changing expectations of Higher Education participants in the 21st Century ... 1-10
1.4 Identifying reliable predictors to inform effective interventions in programming courses ... 1-12 1.5 The research aim and supporting objectives ... 1-14 1.5.1 The research aim ... 1-14 1.5.2 Supporting objectives ... 1-15 Chapter 2 Literature Review ... 2-16 2.1 Student preparation prior to university entrance ... 2-17 2.1.1 The influence of previous qualifications and education... 2-17 2.1.2 Student profile patterns ... 2-25 2.1.3 The role of motivation ... 2-28 Summary of Section 2.1 ... 2-30 2.2 Student engagement in education and university life ... 2-32 2.2.1 Attendance and its relationship with success ... 2-32 2.2.2 Student learning approaches ... 2-34 2.2.3 Digital technology usage in the learning environment ... 2-45 2.2.4 Emotional wellbeing and psychological factors ... 2-47 Summary of Section 2.2 ... 2-48 2.3 Programming Pedagogy ... 2-50 2.3.1 The components of programming courses ... 2-50 2.3.2 Pedagogical discussion ... 2-53 2.3.3 The assessment of programming courses ... 2-69 Summary of Section 2.3 ... 2-72 2.4 Discussion and identification of research opportunities ... 2-73 Chapter 3 Methodology ... 3-75 3.1 Introduction to Computer Science Education research ... 3-75
iii 3.1.1 The lack of specific methodology ... 3-77 3.1.2 The lack of research training ... 3-77 3.1.3 Underpinning CSEd research with established general education research ... 3-78 3.2 Methods of Computer Science Education research ... 3-79 3.2.1 Type of research ... 3-79 3.2.2 Methods of data collection ... 3-80 3.2.3 The size, extent and representativeness of studies ... 3-82 3.2.4 Types of analysis ... 3-83 3.3 The research approach ... 3-83 3.3.1 The overall focus for research ... 3-84 3.3.2 Mixed methods ... 3-86 3.3.3 Study outlines ... 3-87 Chapter 4 Exploration of student application data ... 4-91 4.1 A-Level and BTEC qualifications ... 4-91 4.1.1 Quantitative analysis of factors associated with programming grade performance ... 4-91 4.1.2 Qualitative analysis of entry qualifications ... 4-103 Summary of Section 4.1 ... 4-110 4.2 Further analysis of applicant data ... 4-111 4.2.1 Analysis of trends between applicant data and programming grade performance ... 4-111 Summary of Section 4.2 ... 4-119 4.3 Chapter 4 Conclusion ... 4-120 Chapter 5 Exploration of student engagement with course materials... 5-121 5.1 Multivariate analysis of course engagement metrics ... 5-121 5.1.1 Analysis and discussion... 5-123 Summary of Section 5.1 ... 5-127 5.2 Further analysis of attendance and grade of related courses ... 5-129 5.2.1 The association between attendance and grade ... 5-130 5.2.2 Comparison of relationships between L4 and L6 course grades ... 5-133 5.2.3 Comparison of performance in different L6 assessment modes... 5-134 5.2.4 Investigation of individuals who retook courses ... 5-135 Summary of Section 5.2 ... 5-137 5.3 Investigation of collaborative behaviours ... 5-138 5.3.1 Preliminary analysis (Stage 1) ... 5-140 5.3.2 Detailed analysis (Stage 2) ... 5-141 5.3.3 Investigation of the collaborative behaviours amongst Games programmers ... 5-154 Summary of Section 5.3 ... 5-156 5.4 Chapter 5 Conclusion ... 5-157
iv Chapter 6 Evaluation of course modifications and teaching methods ... 6-159 6.1 Content consolidation, periodic assessment and workshops ... 6-160 6.2 The introduction of unassessed quizzes ... 6-167
6.3 Towards a revised ‘incremental’ teaching model ... 6-172 6.4 Chapter 6 Conclusion ... 6-181 Chapter 7 Conclusions and recommendations for further investigation ... 7-182 7.1 Review of progress against the Aim and the Objectives ... 7-182 7.2 Contributions of this research to pedagogy and their application in the classroom ... 7-184 7.3 Limitations and future recommendations ... 7-188
References ...191
Appendices ...229
Appendix 1: Introductory Programming Course Evaluation Questionnaire ...230
Appendix 2: Enrolment Form for Bucks L4 and Sri Lankan L6 Students ...233
Appendix 3: Ethical Approval for the collection and analysis of Bucks L4 data...235
Appendix 4: Proposal for SAITM study ...236
Appendix 5: Ethical Approval for the collection and analysis of L6 Sri Lankan data (SAITM)...237
Appendix 6: Ethical Approval for the collection and analysis of L6 Sri Lankan data (Bucks) ...238
Appendix 7: Sri Lanka BTEC Interactive Multimedia unit specification ...239
Appendix 8: Popular Sri Lankan BTEC Interactive Multimedia units ...240
Appendix 9: Information Sheet provided for Interview Participants ...241
Appendix 10: Consent Form for Interview Participants ...242
Appendix 11: Ethical Approval for interview data collection and analysis ...243
Appendix 12: UK BTEC IT Syllabus ...244
Appendix 13: Previous Programming Experience Questionnaire ...245
Appendix 14: UK BTEC Games Syllabus ...246
Appendix 15: UK A-level ICT Syllabus ...247
Appendix 16: UK A-level Computing Syllabus ...248
Appendix 17: Information Sheet provided for participants of the video study ...249
Appendix 18: Consent Form provided for participants of the video study ...250
Appendix 19: Task description for S1 and S2 ...251
Appendix 20: Task description for S3 and S4 ...252
Appendix 21: Task description for S5 and S6, and S7 and S8 ...254
Appendix 22: Task description for S9 and S10 ...255
Appendix 23: Week 4 Formative Quiz questions for 2015/16 ...258
v
List of Figures
Figure 1.1. Student March of Time: Participation Rates 1950-2010. ... 1-7 Figure 1.2. Initial University Participation Rates for School Leavers during 2006 – 2015. ... 1-8
Figure 2.1. Kolb’s Learning Styles Diagram. ... 2-38 Figure 2.2. Myers-Briggs Type Indicator categories. ... 2-39
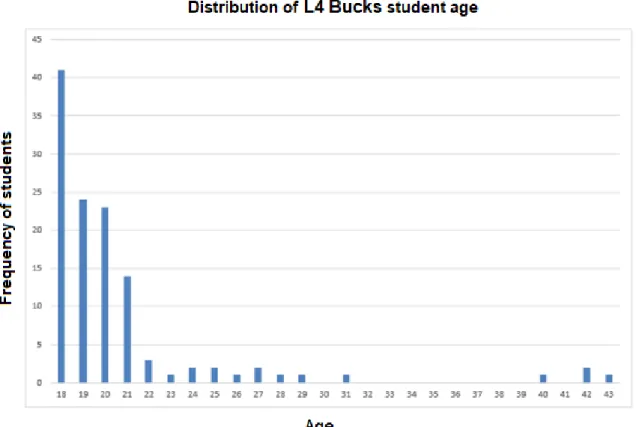
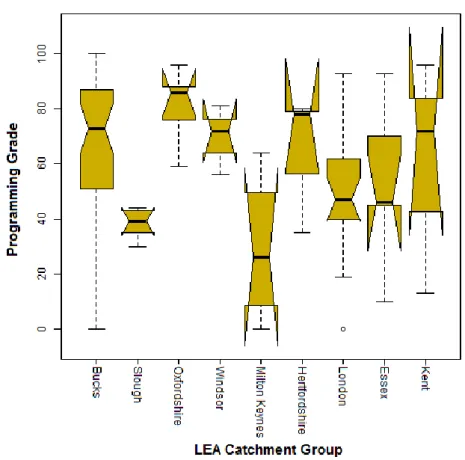
Figure 2.3. Fender and Solomon’s Index of Learning Styles. ... 2-40 Figure 2.4. VARK Learning Styles... 2-41 Figure 4.1. Notched boxplot comparisons for L4 grade across entry qualification categories. ... 4-93 Figure 4.2. Notched boxplot comparisons for prog grade across entry qualification categories. .... 4-94 Figure 4.3: Notched boxplot comparisons for UCAS points across entry qualification categories. .. 4-95 Figure 4.4. Notched boxplot comparisons of programming grades of L4 & L6 students. ... 4-112 Figure 4.5. Age distribution of L4 Bucks students. ... 4-113 Figure 4.6. Age distribution of L6 Sri Lankan students. ... 4-114 Figure 4.7. Notched boxplot comparisons of prog grade across locations of previous study. . ... 4-115 Figure 4.8. Notched boxplot comparisons of prog grades and nationality categories. ... 4-116 Figure 4.9. Notched boxplot comparisons for programming grade across ethnicity categories. . . 4-117 Figure 4.10. Notched boxplot comparisons between prog grade and course categories. ...4-118 Figure 5.1. Biplot for RDA of 2015 data. ... 5-125 Figure 5.2. Ordination biplot from RDA of 2014 for comparison with 2015. ... 5-126 Figure 5.3. Weekly attendance for the introductory programming course. ... 5-130 Figure 5.4. Notched boxplot comparisons between attendance and qualification categories. ... 5-131 Figure 5.5. Notched boxplot comparisons for courses retaken by qualification groups. ... 5-136 Figure 5.6. The position of video recording equipment in the laboratory. ... 5-139 Figure 5.7. Still image from video 5 at 43 minutes illustrating S10 beginning the table. ... 5-142 Figure 5.8. Still image from video 5 at 45 minutes demonstrating the completed table. ... 5-143 Figure 5.9. Still image of video 5 at 46 minutes 48 seconds, showing S9 deleting the arithmetic operators from the conditional statements. ... 5-150 Figure 5.10. Still image of video 5 at 46 minutes 54 seconds, showing S9 attempting to join
comparisons with an OR operator. ... 5-150 Figure 5.11. Still image of video 5 at 47 minutes 17 seconds, showing the red line underneath the erroneous code. ... 5-151 Figure 5.12. Still image of video 5 at 47 minutes 36 seconds, showing the red line underneath the erroneous code. ... 5-151 Figure 5.13. Still image of video 5 at 48 minutes 43 seconds, showing the correct syntax for
combining comparisons with an AND operator. ... 5-152 Figure 6.1. Attendance for L4 programming cohorts (pre and post 2015/16 changes). ... 6-162 Figure 6.2. Grade distribution before and after periodic submission. ... 6-165 Figure 6.3. Average weekly quiz scores for the 2016/17 to 2018/19 cohorts. ... 6-170 Figure 6.4. Comparison of the conventional and new teaching model. ... 6-173 Figure 6.5. Slide 16 from W3 presentation, instructing students to attempt the first exercise. .... 6-174 Figure 6.6. Slide 21 from W3 presentation, instructing students to attempt the second exercise. 6-175 Figure 6.7. Slide 28 from W3 presentation, instructing students to attempt the third exercise. ... 6-175 Figure 6.8. Learning progress of 2018/19 grouped by level of experience. ... 6-177 Figure 6.9. A comparison of W14 code knowledge test scores. ... 6-177
vi
List of Tables
Table 1.1. January total number of applications for UCAS Group I Computer Sciences. ... 1-9 Table 1.2. August acceptances for UCAS Group I Computer Sciences. ... 1-10
Table 4.1. Pearson’s Correlation analysis of UCAS Points and L4 Programming Grade. ... 4-96
Table 4.2. Pearson’s Correlation analysis of UCAS points and L4 grades for other modules. ... 4-96 Table 4.3. Comparisons between prior qualification grades and undergraduate programming grades for Bucks and Sri Lankan students. ... 4-97 Table 4.4. Correlations between UCAS points and L4 and L6 Programming Grade for Bucks students. ... 4-98 Table 4.5. Average Grades of L6 Bucks students. ... 4-98 Table 4.6. Comparisons between the total BTEC grades and grades for all Sri Lankan courses. ... 4-99 Table 4.7. Average grades for Sri Lankan and Bucks L6 courses. ... 4-99 Table 4.8. Comparisons between the UCAS points and L6 Bucks course grades. ... 4-100
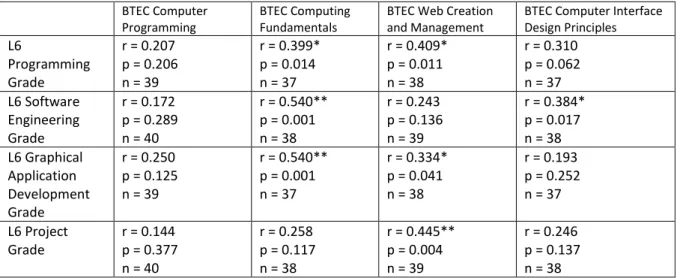
Table 4.9. Pearson’s Correlation analysis between L6 Programming Grade and related BTEC units. .. 4-101
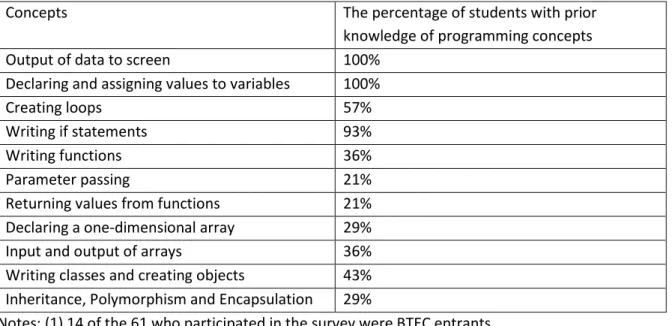
Table 4.10. The distribution of awards for computing related BTEC units. ... 4-101 Table 4.11. Comparison between computing related BTEC units and L6 courses. ... 4-102 Table 4.12. Comparison between creative and managerial BTEC units and L6 courses. ... 4-102 Table 4.13. Knowledge of programming topics amongst BTEC IT students before starting
Programming Concepts. ... 4-104 Table 4.14. Completed A2 A-level Computing and ICT qualifications between 2013 and 2016. .... 4-109 Table 5.1. Summary statistics for RDAS Presented in Figure 5.1 and Figure 5.2. ... 5-124
Table 5.2. Pearson’s Correlation analysis between attendance and L4 grades. ... 5-132
Table 5.3. Pearson’s Correlation analysis between grades for L4 courses. ... 5-133
Table 5.4. Pearson’s Correlation analysis of Sri Lankan L6 grades. ... 5-133 Table 5.5. Comparison of average L6 Advanced Programming exam and assignment grade. ... 5-134 Table 5.6. Comparison of average L6 Graphical programming exam and assignment grade. ... 5-134 Table 5.7. Comparison of average L6 Software Engineering exam and assignment grade. ... 5-134 Table 5.8. Pearson’s Correlation analysis for L4 grades and Retake count. ... 5-135 Table 5.9. Comparison of final grade averages for the 2015/16 Programming course... 5-154 Table 6.1. The Semester 1 programming course curriculum before and after the 2015/16
modifications. ... 6-161 Table 6.2. Submission and failure rates for L4 introductory programming course 2012-18. ... 6-163 Table 6.3. Non-submission rate and failure rate before and after periodic assessment changes .. 6-163 Table 6.4. Students who failed the L4 semester 1 programming course since 2015/16 changes. . 6-164 Table 6.5. Comparison of average grade before and after periodic assessment. ... 6-165 Table 6.6. A comparison of correctly answered questions in W4 and W9. ... 6-167 Table 6.7. Pre- and post- teaching quiz averages for the 2018/19 students. ... 6-176 Table 6.8. Average code knowledge scores by academic year. ... 6-178 Table 7.1. Mapping the completion of objectives to thesis chapters... 7-182
vii
Acknowledgements
Firstly, I would like to thank Dr Richard Mather and Dr Kevin Maher, in addition to advisor Richard Jones and the entire Bucks Computing Department for their invaluable guidance and support during this project. I owe a special mention to Indrachapa Bandara (IB) for providing access to research journals and to Mike Everett for liaising with our partner college in Sri Lanka on my behalf.
I’d like to thank the Bucks Research Department (Laura, Anne and Mel) and the community of fellow PhD students and researchers for their support. I’m also grateful to colleagues such as Mike Mousely for teaching the PGCert; Jason Schaub for teaching Research Methods and Dr Vasos Pavlika for the opportunity to work at Oxford University during this time.
Many thanks are also owed to the students who participated in my studies, offering their time and comments to further this research.
I wouldn’t have been able to complete this work without my parents who provided for me and kindly allowed me to live with them during this project. I also want to dedicate this work to my grandparents (Eileen and Bernard Teed) who sadly passed in June 2018 and October 2019 respectively.
I’m grateful to many friends who journeyed with me; my old school friends, university friends, and church family. Special mention is owed to Dr Peter Brewer for his initial advice; John Chambers for proof reading and fruitful discussions; Jennie Liebenberg for additional proof reading; as well as the Hollier’s, Gorst’s,Bigby’s, Silk and Miro Mateev, Tim and Chloe Grace, Pao Mbewe, Jen Marris and Andrew Henley for their valuable support.
And finally, glory to God, Jesus Christ, who has been with me during the highs and lows of this
viii
Author
’
s Declaration
I declare that this thesis and the work presented in it are my own and have been generated by me as the result of my own original research. I confirm that:
1. This work was done wholly or mainly while in candidature for a research degree at this University. 2. Where any part of this thesis has previously been submitted for a degree or any other
qualification at this University or any other institution, this has been clearly stated. 3. Where I have consulted the published work of others, this is always clearly attributed.
4. Where I have quoted from the work of others, the source is always given. With the exception of such quotations, this thesis is entirely my own work.
5. Where elements of this work have been published or submitted for publication prior to submission, this is identified and references given at the end of the thesis.
6. This thesis has been prepared in accordance with Coventry University and Buckinghamshire New University regulations.
7. I confirm that if the submission is based upon work that has been sponsored or supported by an agency or organisation that I have fulfilled any right of review or other obligations required by such contract or agreement.
Nick Day
Publications arising from this thesis
Mather, R., Day, N., Jones, R., Lusuardi, C., Maher, K., and Dexter, B. (2015) Canonical explorations of
‘TEL’ Environments for Computer Programming. The European Conference on Technology in the Classroom 2015: Official Conference Proceedings [online]265-282. available from
<http://iafor.org/archives/proceedings/ECTC/ECTC2015_proceedings.pdf> [November 2015] Day, N., Mather, R., Jones, R., Lusuardi, C., Maher, K., and Dexter, B. (Upcoming) Can Educational
Profiles Explain Achievement When Learning Computer Programming Using a Technology-Enhanced Environment? Research in Learning Technology
1-1
Chapter 1
Introduction
This chapter provides a rationale for the research undertaken and outlines three trends including: (i) the growing digital technology industry in the UK; (ii) recent developments and challenges in
programming education; and (iii) increased tuition fees and mass participation in Higher Education (HE). These trends underpin the research aim and are addressed in the sections summarised below.
Section 1.1 describes the growth of the UK’s digital technology industry and its contributions to the
UK economy. Expansion of this industry is exponentially creating employment opportunities for programmers and software engineers. However, businesses are continuing to report a shortfall of adequately skilled employees to meet market demand.
Section 1.2 discusses the introduction of the new national computing curriculum for compulsory education and its effectiveness in motivating further study. This section also discusses how sustained non-continuation rates reported for undergraduate computer science (and programming related) courses are impacting on graduate numbers.
Section 1.3 reviews recent statistics concerning computer science degree applications, and patterns of increasing student participation in UK HE. This section discusses the impact of mass student participation and increased tuition fees on expectations and motivations towards learning. Section 1.4 describes how the three contextual issues, (i), (ii) and (iii), underpin the need for this research and a priority to respond to issues surrounding the delivery of programming courses. This section introduces the need to identify reliable predictors of student performance to inform effective interventions, thereby improving retention, learning experiences and teaching quality. Section 1.5 states the aim and objectives of the research.
1.1 UK’s growing digital technology industry
The digital sector is one of the fastest growing sectors in the UK, and one of the strongest globally
(Bounds & O’Connor 2015). The number of digital technology companies formed in the UK doubled between 2010 and 2013 (Tech City 2015). The ‘tech’ industry consists of companies that specialise in IT, software and services; telecoms; manufacture of IT and telecoms; retail; and computer games. This sector contributed £91.1 billion to the UK economy in 2014 (Tech Partnership 2015), over half of which was from IT software and services alone (£53.1 billion). The combined digital and tech sector contributed almost £184 billion in 2017 (Ismail 2018).
1-2 The ubiquity of digital technology has also led to the ‘digitisation’ of the whole economy (House of
Lords 2015: 6). For example, integrating technology within the automotive industry has led to the innovation of driverless cars and autonomous vehicles (Schiller 2015; Rojas et al. 2011). Surgeons are
now able to print (3D) organs and artificial limbs (House of Lords, 2015: 6). Analysis of ‘Big Data’ is
transforming consumer and public services (Virmani 2017). Even the agricultural industry is benefiting from ‘smart greenhouses’ and more accurate monitoring of growth cycles (Ryan 2016).
The internet itself is now relied upon heavily for communication, entertainment and e-commerce (Frey 2017; Lobel 2016; McKetta 2017; Statista 2013). Researchers refer to this era, characterised by
personal computing and the internet, as the ‘fourth industrial revolution’ (Schwab 2016), and the ‘Second Machine Age’ (Brynjolfsson & McAfee 2014), marking a significant transition from the technology of the 20thcentury (the ‘First Machine Age’).
1.1.1 Job creation in the computing industries
This next stage of industrial revolution points towards another shift in the working climate, evident by the creation of unique jobs in digital technologies. The UK Commission for Employment and Skills (2015: 8) highlights emerging areas such as “cyber security; convergence of content across
platforms; mobile and cloud computing; big data and analytics; the automation of routine tasks; new
applications of social media; and new business models and collaborative platforms”. It is anticipated
that the future evolution of digital technologies will continue to create unique job roles (World Economic Forum 2016: 3; Frey 2011).
Research groups have attempted to model the numbers of digitally literate workers that are required each year to sustain current industry expansion. The UK Commission for Employment and Skills predicts that some 520,000 jobs requiring highly skilled computer science graduates will be created between 2012 and 2022 (The UK Commission for Employment and Skills 2015: 72-3). Data from Bureau for Labor Statistics (BLS, 2014: 7) predicts that USA’s software engineering profession is
“projected to experience 23% increase in employment openings between 2012 and 2022”.
The Tech Nation (2018: 7) reported that digital tech sector employment rose 13% from 2014 to 2017. The Global IT research organisation, CompTIA, noted an increase in UK IT job advertisements from 1.19 million in 2015, to 1.22 million in 2016, accounting for 13% of total UK job postings (CompTIA 2017), with further growth of 6% to 1.3 million IT jobs advertised in 2017 (CompTIA 2018a). The most advertised job categories in 2017 were programmers and software development professionals, along with IT specialist managers and telecommunication professionals (CompTIA 2018a).
1-3
1.1.2 The shortage of skills in digital technologies
Despite the continuing expansion of the tech industry, and the associated increase in jobs, there are concerns that many candidates lack adequate skills to fulfil these roles. Analysts predict that almost 90% of jobs will require “some kind of digital proficiency” over the next two decades (House of Commons Science and Technology Committee 2016). Yet some 23% of adults (12.6 million) in the UK have been identified as lacking the rudimentary digital skills needed to complete basic tasks online, such as using search engines and sending emails, as well as resolving problems with their
smartphones and related devices (House of Commons Science and Technology Committee 2016; Ipsos MORI, 2015: 5). A 2017 survey found that three in four businesses now report a shortage of
digitally skilled workers (British Chambers of Commerce 2017). This recruitment ‘crisis’ is stifling industry growth (Horton 2018) and reducing the digital industry’s contribution to the economy
(House of Commons Science and Technology Committee 2016). Researchers from the working group
‘Strategy&’ (2015: 8) estimate that the digital skills gap cost the UK £63 billion in GDP (gross domestic product) in 2011.
In addition to a widespread deficit in basic digital skills, research indicates a shortage of graduates
and employees with advanced and specific skills in ‘STEM’ subjects (science, technology,
engineering, mathematics), all of which underpin computer science and computational thinking. A report by Engineering UK (2016: 9) found that 46% of those businesses surveyed cite a shortage of
STEM graduates as being a “key factor in being unable to recruit appropriate staff”. Research by the
Social Market Foundation (Broughton 2013: 35) estimates there is an annual shortfall of 40,000 STEM skilled workers in the UK. Research reported in the 2017 edition of Engineering UK (2017: 192) similarly estimates a yearly deficit of 60,000 engineers. The World Economic Forum has placed
‘Complex problem solving’ at the top of its list of ten most desired skills for graduates and employees in 2020 (World Economic Forum 2010: 22). Problem-solving and communication skills frequently appear in the top five desired skills by UK job advertisements (CompTIA 2018b).
1.2 The current state and challenges in computer science education
The proliferation of employment opportunities, coupled with a shortage in appropriately skilled graduates and employees, has highlighted the importance of improving the learning and teaching of key skills in preparatory stages. These skills and knowledge shortfalls have also instigated reviews of compulsory schooling and undergraduate level study to identify issues and possible remedial measures at each stage of education.
1-4
1.2.1 The new 2014 computing school curriculum
Industry leaders criticised the previous ICT secondary school curriculum for being inadequate to
meet the future workforce requirements of the ‘tech’ industry (Cellan-Jones 2011; Computing at School 2012: 11; Department for Business Innovation and Skills 2011; Gove 2012; Livingstone & Hope 2011; Livingstone 2012). In addition, the pre-2014 ICT curriculum was widely regarded to be uninspiring by secondary school pupils, and a disincentive to pursue subjects related to computing beyond compulsory level education (Department for Business Innovation and Skills 2011).
The Secretary of State for Education, Michael Gove (between 2010 and 2014), worked with the British Computer Society (BCS) in collaboration with Computing at School (CAS) and the Royal Academy of Engineering to develop a new computing curriculum (Computing at School 2012; Royal Society 2012). This was implemented in September 2014 (Cellan-Jones 2014; Design Commission 2014). The new curriculum replaced the previous ICT curriculum in primary and secondary schools to more actively promote software engineering and computer science as attractive subjects for study and as career destinations (Department for Business Innovation and Skills 2015; Hlubinka 2015). At Key Stage 1 (KS1) children aged 5-6 are now taught algorithms and how to create and debug simple programs. At KS2 (ages 7-11) children are introduced to fundamental programming structures (sequence, selection and iteration), the use of variables for storing information and the different forms of input and output devices (Department for Education 2013a). They are also required to apply algorithms for purposes of logical reasoning and to understand their use for data searching and sorting purposes. More advanced KS3 (ages 11-14) introduces Boolean logic and requirements to understand two or more programming languages and concepts of abstraction. KS4 (ages 14-16) is more concerned with the creative and efficient application of KS1-3 learning to solve challenging problems using more complex scenarios (Department for Education 2013b).
This new curriculum places greater emphasis on those fundamental skills, such as computational thinking and programming (Computing at School & NAACE 2014: 7) that are particularly valued by industry (Shadbolt 2016: 5). In addition, organisations such as Code.org, Code Club and CoderDojo
are assisting schools in the delivery of voluntary extra-curricular code clubs to encourage children to learn computer programming skills (code.org 2016; De Kock & Gardner 2015; Geere 2012).
1-5
1.2.2 Non-continuation rates in undergraduate computer science degree courses
The non-continuation rates of students on HE computer science courses are reported to be significantly greater than other subjects. Research by the Higher Education Funding Council for England (HEFCE) found that 12% of young students (18-20 year olds) and 17% of mature students (21 or older) who enrolled on computer science courses in 2010/11 were no longer studying a year later (HEFCE 2013: 7). This was almost double the average non-continuation rate for other subjects: 6.3% for young students; 11.6% for mature students (HEFCE 2013: 2). The volume of research investigating poor progression in computer science degree programmes over many decades suggests this is a globally and historically pervasive problem (Bennedsen & Caspersen 2007; Peterson & Howe 1979). First year introductory programming courses have been a specific focus of research since the 1980s (Sleeman 1986).
Contemporary studies suggest that the percentage of students dropping out from or failing an introductory programming course is between 30% and 60% (Bennedsen & Caspersen 2007; Bornat 2011; Dehnadi & Bornat 2006; Robins 2010). However, Watson and Li (2014) commented that sources for these figures tended to be anecdotal and lacked quantitative evidence. They cite Bennedsen and Caspersen’s study (2007) as the only attempt to properly quantify failure rates, which, even then, was limited by a low participation rate among the targeted education establishments (only 63 complete responses – most of which were from US institutions - were received from the 497 invited). The authors calculated aggregate percentages (where larger classes have more weight) and average percentages (where classes of all sizes had equal weighting) but found minimal difference between the two values. The pass rate ranged from 69% to 72%. They also found that fewer than 3% of students never attended a class; students who abort studies ranged from 12% to 15%; and those who failed ranged from 11% to 13% (Bennedsen & Caspersen 2007: 33).
Watson and Li’s (2014: 43) large scale meta-analysis of 161 pieces of research, and this author’s
analysis of data from Buckinghamshire New University (Bucks 2015a; Bucks 2015b; Bucks 2016a; Bucks 2016b), for two academic years 2014/15 and 2015/16, also reveal that approximately one third of students do not pass the introductory programming course. Watson and Li (2014) noted that
the ‘drop-out’ rate had not improved significantly from 1979 to 2013, and that rates were unrelated
to the particular programming language being taught. Both recent small- and large-scale studies consistently report that approximately one third of students do not progress beyond introductory programming courses (Bennedsen & Caspersen 2007). Such non-completion of computer science degrees represents lost potential talent and consequent shortfalls in the numbers of highly skilled STEM graduates needed by industry (The UK Commission for Employment and Skills 2015).
1-6 Research investigating the specific reasons for non-continuation in introductory programming and computer science degree courses suggests that some students fail or withdraw due to extraneous factors and personal reasons that hindered their studies (Bennedsen & Caspersen 2008). Others, however, drop out due to weak motivation (Kinnunen & Malmi 2006), an inability to attend lectures and complete assignments (Nikula et al. 2011: 12) and/or difficulties in learning key concepts and completing assignments (Gordon 2016: 6). Whilst educators have limited influence over personal circumstances that affect a student’s ability to study, they might be able to mitigate impacts by
modifying course structure, content and assessments (Margulieux et al. 2012).
Specific pedagogical interventions for improving the learning and teaching of computer programming and elevating progression rates are further discussed in Sections 1.4 and 2.3.
1.3 Trends in Higher Education
1.3.1 Increased Higher Education participation rates in the UK
The increase in student applications to study computer science degrees reflects the substantial growth in undergraduate and postgraduate student numbers during the past 60 years. Estimates calculate that less than 5% of the UK’s 18- and 19-years olds went to university in the 1950s (Times Higher Education 2013) compared with almost 50% of 18-30 year olds who attended university during the period from about 2010 to 2015 (Department for Business Innovation and Skills 2014; Department for Education 2016).
Figure 1.1 illustrates trends in student participation in HE in the UK. The steady rise throughout the 1950s to the 1970s resulted from increasing prosperity and educational reform following the end of the Second World War (Edwards 1982: 50; Robbins 1963). Attitudes towards higher education
became more inclusive during the 1960s as government figures believed that “Higher Education
should be available to all who are qualified by ability and attainment to pursue it” (Robbins 1963;
Department for Business Innovation and Skills 2016). The student population effectively doubled from 7% in 1963 to 15% in 1970 (Walford 1991) but participation rates stagnated during the 1970s and 1980s, largely due to funding cuts motivated by the economic recession at the time (Bathmaker 2003: 177; Edwards 1982: 193). However, participation rates later rose again from 15% in 1988 to 30% in 1992. This growth was stimulated by an improved economic climate and because many polytechnics were granted university status in 1992 (Bathmaker 2003: 177; Huw 1997). Participation rates then remained at around 33% throughout the 1990s and early 2000s, largely due to the introduction of a cap on student recruitment (Bathmaker 2003: 178; National Committee of Inquiry
1-7 into Higher Education 1997) and the introduction of tuition fees in 1998 (Alley & Smith 2004).
Redefining the participation rate to include mature students and part-time learners (all students aged 17-30) led to a further apparent increase in student numbers (Times Higher Education 2013). The economic recession of 2008 also motivated more school leavers and mature students to attend university to improve their employability prospects (Curtis 2009; Lipsett 2009; Universities UK 2010: 5).
Figure 1.1. Student March of Time: Participation Rates 1950-2010 (Times Higher Education 2013). Notes: (1) The source for this data is the Department for Business, Innovation and Skills/Office for National Statistics (2011-12 figures were provisional); (2) API (Age Participation index): the number of home-domiciled under-21 initial entrants to UK higher education, expressed as a proportion of their average 18- and 19-year-old population; and (3) HEIPR: the Higher Education Initial
Participation Rate is the sum of the initial participation rates over the ages of 17-30 for English-domiciled first-time participants in the UK higher education.
Figure 1.2 illustrates that participation rates rose steadily from 42% in 2006/07 to a peak of 49% in 2011/12 (Department for Education 2016). However, the subsequent decline in 2012/13 is largely attributed to increased tuition fees for that academic year (Independent Commission on Fees 2015). Despite this initial decline, participation rates have since returned to levels similar to those before 2012/13, suggesting that fee increases have become less of a disincentive to university entrance (Independent Commission on Fees 2015; UCAS 2014).
1-8 Figure 1.2. Initial University Participation Rates for School Leavers during Academic Years 2006/07 to 2014/15 (Department for Education 2016).
1.3.2 Computer science application trends
Despite the overall increase in student participation, and the growth in applications to study STEM subjects in the 2000s, computer science applications declined from 128,000 in 2004, to
approximately 90,000 in the late 2000s (e-skills UK 2011; Universities UK 2015: 22). Computer science courses also tended to have a disproportionately high ratio of men to women (Carter & Jenkins 2001; e-skills UK 2011; Margolis et al. 2008; Universities UK 2015: 23; WISE 2014: 16). However, active promotion of the improved employability prospects for graduates from computer science programmes (Department for Education 2014; House of Commons Science and Technology Committee 2016) has contributed to an observed increase in applications by both men and women over the past decade. Analysis of UCAS data (Table 1.1) demonstrates a rise in the total number of computer science applications (including software engineering and games development) from 90,260 in 2010 to 129,145 in 2016.
1-9 Table 1.1. January total number of applications for UCAS Group I Computer Sciences.
Year 2007 2008 2009 2010 2011 2012 2013 2014 2015 2016 Computer Science 53,610 47,475 53,785 59,820 64,910 60,225 68,060 76,895 87,570 90,775 Information Systems 13,965 12,515 13,930 15,925 15,855 12,425 11,350 10,800 10,165 9,305 Software Engineering 6,315 5,975 6,515 7,725 8,945 8,195 9,495 10,155 10,425 10,765 Artificial Intelligence 440 315 325 395 440 385 325 495 485 760 Health Informatics 0 0 0 0 0 30 25 20 30 25 Games 0 0 0 0 0 2,350 3,530 7,490 9,570 11,125 Computer generated Audio and Visual effects 0 0 0 0 0 45 270 425 410 575 Others in Computer Science 65 0 5 110 10 350 495 550 660 710 Combinations in Computer Science 5,325 4,845 5,320 6,285 6,940 5,930 6,150 5,470 4,905 5,105 Total applications: 79,720 71,125 79,880 90,260 97,100 89,935 99,700 112,300 124,220 129,145
Note: The source for this data is (UCAS 2016a: 3).
These applications translated into 26,850 being accepted on computer science and related courses in 2016, which represented a 33% increase from the 20,500 students accepted in 2010 (Table 1.2). Another notable trend in Table 1.2 is the sudden appearance of ‘games’ courses in 2012 followed by
steady year-on-year growth for this emerging subject. Table 1.2 also illustrates a decline in the popularity of Information Systems. However, it is unclear as to whether this represents a real downturn in subject interest or is in fact due to rebranding of degrees that also subsume
Information System subjects. These patterns demonstrate, in contrast to many ‘conventional’
1-10 Table 1.2. August acceptances for UCAS Group I Computer Sciences.
Year 2007 2008 2009 2010 2011 2012 2013 2014 2015 2016 Computer Science 11,420 12,135 13,255 13,245 13,405 12,565 14,390 15,755 17,730 18,260 Information Systems 3,250 3,485 3,855 4,010 3,610 2,905 2,665 2,365 2,340 2,105 Software Engineering 1,410 1,585 1,675 1,700 1,880 1,865 2,075 2,120 2,080 2,225 Artificial Intelligence 70 60 60 60 65 60 60 95 85 105 Health Informatics 0 0 0 0 0 5 5 5 5 5 Games 0 0 0 0 0 500 875 1,835 2,320 2,755 Computer generated Audio and Visual effects 0 0 0 0 0 20 80 120 125 170 Others in Computer Science 35 0 0 25 5 135 120 130 180 195 Combinations in Computer Science 1,095 1,250 1,435 1,460 1,450 1,295 1,440 1,155 1,085 1,030 Total applications: 17,280 18,515 20,280 20,500 20,415 19,350 21,710 23,580 25,950 26,850
Notes: (1) The source for this data is (UCAS 2016b: 3); (2) In the past UCAS has changed the Joint Academic Coding System (JACS) codes for classification of subjects. From 2007-2011, UCAS used JACS2, whereas, 2011-2016 used JACS3 classification. Figures from 2007-2011 are approximated from equivalent codes, but may not be exact.
1.3.3 Changing expectations of Higher Education participants in the 21
stCentury
As previously mentioned, tuition fees were introduced in 1998 to maintain resources and fund additional staff recruitment in response to greater student numbers. Students were initially charged £1,000 per year of tuition from 1998 to 2004 before the fee was raised to £3,000 per year in 2004 (Alley & Smith 2004). The fees increased by a few hundred pounds in subsequent years (Alley & Smith 2004) until the Conservative and Liberal Democrat coalition raised the tuition fees from £3,290 a year to £9,000 in 2012 (Coughlan 2010) following recommendations from Lord Browne’s
review of university funding in England (Browne 2010).
Researchers and commentators have questioned whether the sustained increase in tuition fees has led students to view higher education from a consumer perspective (Molesworth et al. 2011; Saunders 2014; Tomlinson 2014). Tomlinson (2014) set out to explore the extent to which recent financial changes in higher education had altered the way students approach learning, their
1-11 expectations of their course and elected university and their prospects after graduating. Michael Tomlinson interviewed students of different ages from a wide variety of institutions. Students who participated in the survey had enrolled on courses in 2011 or 2012, and exhibited a diverse range of attitudes towards perceptions that universities were objects of consumerism. Student views ranged
from active ‘service users’ to those who ‘resisted’ a consumer attitude. However, only a minority of
students thought they were buying a service and were therefore entitled to a degree (Tomlinson 2014: 28). Instead, most students valued employability; seeing higher education as an investment to achieve a better starting position in the job market. Many students commented that the increase in
tuition fees led them to seek courses and universities that represented ‘good value for money’. The annual 2015 UK Graduate Careers Survey corroborates Tomlinson’s (2014) findings that greater
tuition fees have increased expectations about employment upon graduating. The survey of 18,000 final year students from 30 research intensive universities revealed that 26% were expecting to start a full-time job after graduating (High Fliers Research 2015; Havergal 2015). This was the greatest proportion in the 14 years that the survey has been conducted. The percentage of students that started considering their career options in the first year increased from 30% in 2010 to 48% in 2015, and the percentage of those who started job searching before the third year increased from 57% in 2008 to 79% in 2015 (Havergal 2015). Half of the 2015 cohort sought work experience or internships during their time of study (Adams 2015).
The percentage of students who find employment within six months of graduating has become one of the institutional performance indicators applied to universities and courses (HEFCE 2016).
Students can now compare employability ratings to find courses that represent ‘good value for money’. Despite increasing numbers of vacancies in the digital and technology sectors, computing courses are reported to have some of the highest unemployment rates when compared with all other subjects (Shadbolt 2016). However, unemployed graduate figures for computer science courses vary widely between institutions, ranging from 2% to 26% (CPHC 2016: 5). Reasons for this are complex and are not always related to inadequate skills. For example, unemployment was higher in those low-tariff HEIs that did not offer a work placement year as part of a ‘sandwich’ degree
course (Shadbolt 2016: 4). However, the wide variety of different jobs that computer science graduates apply for require vastly different skills and levels of experience. Shadbolt (2016: 5) found that employers disagreed as to which specific platforms and technologies should be taught.
However, most agreed that graduates needed a strong grasp of the fundamental concepts of computer science to more easily transfer skills and knowledge between platforms and technologies used in the workplace.
1-12 Whilst promotion of lucrative career prospects and the availability of jobs has been effective in attracting computer science degree applications (which are necessary to address the shortfall in numbers of highly skilled workers), studies have also linked career impetus with strategic and performance related approaches towards learning (Elliot et al. 1999; Porter & Zingaro 2016: 281; Zingaro 2015). Porter and Zingaro (2016) found that students primarily motivated by career motivations are less inclined to concentrate on deeply understanding subject content. However, even though more students are primarily stimulated to undertake computer science courses for the perceived graduate prospects, recent surveys suggest most applicants are still attracted by their strong and fundamental interest in the subject (Department for Business Innovation and Skills 2016: 25).
1.4 Identifying reliable predictors to inform effective interventions in introductory
programming courses
Sections 1.1 to 1.3 outline important themes and trends in three related areas (digital technology industry, programming education, and student participation in HE), which provide context and
motivation for this author’s own research. Section 1.1 described the shortfall in workers with adequate skills to meet the demand of expanding digital and tech industries. Industry leaders have criticised compulsory education curricula for failing to inspire and prepare students for
undergraduate level study (Section 1.2). Furthermore, the high non-continuation rates associated with undergraduate computer science courses and introductory programming courses have also reduced the numbers of suitable graduates available for recruitment. Whilst the new computing curriculum implemented in UK primary and secondary schools in September 2014 is seen as an improvement (Computing at School & NAACE 2014), further developments to undergraduate curriculums and teaching practices are required to develop graduate skills (such as complex problem-solving) that align with industry needs (Shadbolt 2016). Section 1.3 reports that growing student participation in HE (and computer science related courses) and increases in tuition fees have coincided with changing expectations and opinions of HE amongst students. Surveys indicate that students increasingly expect higher education to prepare them for employment. As a result of such
expectations, students may become ‘goal orientated’ towards achieving high grades and less
inclined to take part in unassessed activities that do not directly contribute towards their degree classification (CPHC 2012: 23).
1-13 Widening access measures have greatly extended pathways for university entrance (Department for Business Innovation and Skills 2016: 7; New Labour Party 2001: 17; OFFA 2015). Most universities now accept alternative qualifications to A-levels. These are awarded equivalent UCAS points (UCAS 2016c: 34; UCAS 2010) and have led to increased numbers of students applying with BTEC
qualifications, NVQ’s or via other forms of HE access course. However, as a result of widely ranging educational backgrounds, experiences and qualifications, tutors can no longer assume that students share the same level of knowledge or experience. As a consequence, it is also more challenging to identify students who are potentially vulnerable to not continuing with their studies or to predict student progress with their learning.
Previous research comparing student characteristics and behaviours with programming performance (typically measured by assessment grades) has tended to result in moderate to weak correlations that may only have limited value for guiding educational intervention. Some of the stronger
predictors have been found to be unreliable when attempts have been made to replicate findings at other institutions (Bornat 2014; Caspersen et al. 2007; Lung et al. 2008).
A recent Higher Education Academy (HEA) report examining retention and attainment in computer science courses (Gordon 2016: 18) identified specific areas for which further research and a stronger evidence base were needed, including the identification of the following:
• Reliable predictors to indicate computer science students at risk of failing or dropping out. • How best to intervene and support students at risk, especially those who are considered to
belong to minority groups in computer science courses (women and BME students).
• Examples of best practice in teaching, learning and assessment of computer science courses. • How to address procrastination and distracted behaviour as well as supporting students to
manage their time effectively to meet assessment deadlines and relieve negative stress. The same author also made certain recommendations relating to information gaps in the literature (Gordon 2016: 19); among these were that:
• Departments should provide support during the transitional period between school and university. They should help students develop their academic skills (study skills and time management, in particular). A welfare team should also be available to respond to students’
personal issues (adjusting to living away from home, financial concerns and budgeting etc.). • Transitional support should also include activities that help develop students’ social bonds
1-14 • Academics should consider using active learning techniques such as peer learning and
gamification to increase engagement and learning. Active learning techniques have also been found to improve a sense of belonging to peer groups and confidence.
• Academics should also monitor students’ performance as courses progress and should investigate course data for its potential to predict performance.
Despite previously unsuccessful attempts, Gordon (2016) recommends continued investigation to provide evidence for reliable predictors and effective pedagogical interventions. Computer science
courses are underpinned by “technical programming and computing architecture that provides the technical scaffolding for this digital content” (Gordon 2016: 11). Therefore, addressing retention issues associated with, and improving the teaching of introductory programming courses (Longi 2016) is paramount towards improving the quality of graduate skills, and the quantity of graduates required by an expanding industry.
1.5 The research aim and supporting objectives
There is a clear requirement to improve the learning and teaching of computer programming to meet a growing demand for graduates who are skilled in programming, problem-solving and computational thinking.
This research also extends the work of Mather (2014) and Mather and co-workers (2015) by evaluating more widely ranging elements of student background information for its potential to indicate and predict performance during the first ‘level 4’ (L4) year of undergraduate study. Here research is further extended to determine the consistency of patterns and findings over three years of L4 cohorts and to evaluate predictors at other institutions teaching computer-science related degrees.
1.5.1 The research aim
The core research aim may be expressed as a statement of intent as follows:
To determine predictors of success or vulnerability in learning computer programming towards supporting more timely remedial intervention and improving undergraduate progression, and to propose pedagogy for deeper learning and more effective retention.
1-15
1.5.2 Supporting objectives
It is anticipated that the following objectives and actions must be fulfilled to achieve the overall research aim. The rationale for selecting methods identified below is explained in the methodology sections of Chapter 3.
Objective 1: Review predictive trends and student behaviours already identifiedin the literature. • Method: Review of existing literature concerning the difficulties students face when taking
introductory programming modules (Chapter 2).
Objective 2: Investigate pedagogical interventions that have been implemented in other higher education establishments.
• Method: Review literature concerning pedagogical choices and interventions that educators may make to influence approaches to learning (Chapter 2)
Objective 3: Evaluate the usefulness of prior qualifications for preparing students to learn computer programming in a higher education establishment.
• Method: Analysis of interview transcripts, survey data, and curriculum documents to determine the extent of programming coverage and perceived usefulness of prior qualifications (Chapter 4).
• Method: Correlational analysis to determine the indicative value of UCAS points and performance comparisons between qualifications (Chapter 4).
Objective 4: Explore patterns of engagement with L4 programming learning environments towards identifying potential indicators of success and vulnerability.
• Method: Multivariate analysis of student behaviours (motivation, preferences) and course data (attendance, grade, formative test scores) (Chapter 5).
• Method: Ethnographic-type analyses of video and audio recordings to investigate the problem-solving approaches of learners and related peer communication and collaboration
behaviours that may be indicative of ‘successful’ learning and programming strategies
(Chapter 5).
Objective 5: Suggest early forms of diagnosis and pedagogic intervention useful for retaining and motivating students whose behaviours indicate vulnerability to failing or to not progressing with their studies.
• Method: Case study evaluations to determine the effectiveness of interventions and the production of guidelines to remedial pedagogy (Chapter 6).
2-16
Chapter 2
Literature Review
This chapter reviews literature surrounding the learning and teaching of computer programming and is particularly concerned with introductory level courses that are typically encountered in the first year of undergraduate level study (designated as Level 4 or L4 according to the UK Framework for Higher Education Qualifications). The first two sections explore relationships between student characteristics and their grades in introductory programming courses. The last section investigates instructional design as well as specialised interventions and pedagogies for teaching programming. This review therefore aims to establish whether reliable predictors of programming success already exist and to identify where further work is required. It also aims to evaluate interventions and pedagogies that are currently being used to improve outcomes in programming courses. Section 2.1 reviews the impact of prior programming exposure on undergraduate programming performance and learning success. Such preceding exposure may include programming knowledge and experience acquired before university entry and/or school-level computing and IT qualifications. As well as considering the influence of ethnicity (BME grouping), gender and mature entrance to degree programmes on learning performance, this section also explores the expectations and motives of current students in further detail.
Section 2.2 investigates typical patterns of student engagement with programming courses. Learning approaches and styles, together with cognitive abilities (such as problem-solving ability and the formation of mental models) are discussed in relation to predicting programming performance. This section also discusses the impact of technology usage on attention span, engagement with taught sessions and independent study. Emotional and psychological factors such as comfort level and a sense of belonging to a peer group or wider community are explored for their influence on outcomes.
Section 2.3 considers the influence of course design and delivery style on learning outcomes. Choice of programming language, development environments, class size and supporting materials are discussed. Consideration is then given to conventional didactic teaching methods and recent pedagogies developed specifically for teaching computer programming. The advantages and disadvantages of different assessment techniques are also contrasted.
Section 2.4 reviews the findings of Sections 2.1 to 2.3 and uses these to contextualise and describe the areas that this research intends to address.
2-17 The scope and identification of relevant literature
Due to the ongoing and rapid evolution of programming languages, software development environments and teaching approaches, much of the literature relevant to this research has been published since 2000; earlier works are often no longer representative of circumstances
encountered by current students (Fisler et al. 2016). However, literature from the 20th century is
included where it remains relevant, particularly with regard to fundamental theories of learning and pedagogy, and where such ideas have been extended to represent contemporary practices in a digitally connected age. This chapter also underpins the development of ideas with learning and teaching research outside the specific context of teaching computer programming. Such wider consideration of approaches beyond the immediate subject domain is recommended by methodological researchers (Malmi et al. 2014).
2.1 Student preparation prior to university entrance
2.1.1 The influence of previous qualifications and education
The constructivist philosophy of knowledge creation (epistemology) emphasises the need to consider the existing knowledge that learners possess. This philosophy is widely adopted by computer science researchers and educationalists (Ben-Ari 1998; Malmi 2010). Computer science education (CSE) literature considers the effectiveness of prior education in preparing students for undergraduate study. Section 2.1.1 reviews trends in the following areas, with regard to predicting undergraduate programming performance, including UCAS points; increased uptake of BTEC qualifications; A-level and BTEC computing qualifications; previous programming experience; and mathematical ability and qualifications.
UCAS points
Universities tend to accept applications if students achieve the required UCAS points. Such points
are calculated from students’ A-level and BTEC grades. Despite the continued emphasis on entry requirements, CSE research has often concluded that UCAS points (entry grades) alone have a weak
relationship with students’ final undergraduate classification (Boyle et al. 2002; Clark & Boyle 2005;
Drummond 2009). However, these investigations have revealed other patterns regarding entry grades and L4 performance.
2-18 Boyle and co-researchers (2002) investigated the extent to which A-level points of computer science students entering the University of Leeds or the University of Kent influenced L4- L6 average grades and final grade (classification). Both universities required students to have achieved A-level grades
‘BBC’ or above to enter their computer science courses and Leeds required students to have at least
a C in mathematics (Boyle et al. 2002: 9). The researchers found that students who achieved A-level
grades of ‘BBB’, achieved higher L4 average grades than students with A-level grades less than ‘BBB’
(Boyle et al. 2002: 11). However, they found that L5 and L6 grades of the two groups of students were similar (Boyle et al. 2002: 12). The authors reported great variation in student entry grades (previous qualifications) and a weak correlation between entry grade and final year grade average.
Drummond’s (2009) PhD research also discovered that the relationship between entry grades and L4 grades was stronger than that between entry grades and L5 grades. Furthermore, she investigated relationships between the A-level qualifications chosen by Durham University computing students and their undergraduate grades. Students with previous maths qualifications achieved higher L4 programming grades than those without maths. However, L5 grades of students without prior maths qualifications were similar to those with maths qualifications.
Both studies indicate that the A-level Computing grades of university entrants align more closely with their L4 grades achieved at L5 and L6. Drummond (2009) discovered that A-level Mathematics grades had a similar relationship with university grades, but Boyle and colleagues (2002) saw
negligible difference between undergraduate grades of those with and without A-level Mathematics. Despite this, the difference between L4 grades for the two groups is important because this is reputedly the stage at which students are most vulnerable to failing and dropping out from introductory programming courses.
The increased uptake of BTEC qualifications
Earlier studies (Boyle et al. 2002; Drummond 2009) only referred to small populations of non-traditional students (those who took qualifications such as BTECs, GNVQs and access courses). Drummond (2009) did not include BTEC students in her analysis of 2004-2006 Durham students because they were too few to make a valid comparison with the greater number of traditional A-level entrants. Boyle and co-workers (2002: 10) noted that for some 30% of students from both
institutions (Kent and Leeds), “the background of these students ranges through non-traditional school and college qualifications (e.g. BTEC, GNVQ), to preparatory foundation or access courses
geared to the mature entrant.” They found negligible difference between the average grades of
2-19 Recently, BTEC qualifications have become a popular alternative qualification to A-levels. Many students choose to undertake BTEC qualifications because they are assessed primarily through coursework instead of examinations. However, Gill and Vidal Rodeiro (2014) state that the BTEC syllabus was not originally designed to prepare students for university. Instead, the qualification was
intended as preparation for the workplace with assessment methods that better reflected the ‘real
-life’ nature of the subject vocation (London Economic 2013). In contrast, the A-level was designed to be the pre-requisite entry qualification to university and assessed primarily by examinations. Despite not being designed for university application, the number of students applying only with BTEC qualifications has increased, as has the number of those applying with a combination of BTECs and A-levels. The number of students entering university with at least one BTEC qualification has more than doubled between 2008 and 2015 from 44,000 to over 100,000 (UCAS 2016a: 27). The
number of BTEC students achieving the highest ‘distinction’ grade is now double that of students
achieving the equivalent A-grade for A-levels. HEFCE (2015) reported that 38% of students achieved three BTEC distinctions in 2012/13 (an award equivalent to ‘AAA’ at A-level), compared to only 17%
in 2005/6. In contrast the percentage of students who achieved ‘AAA’ at A-level only marginally increased from 16% to 17% between 2005/6 and 2012/13.
Whilst BTEC qualifications have enabled those from disadvantaged backgrounds to access HE courses (Gicheva & Petrie 2018; Kelly 2017: 13), the qualification does not provide the same level of access to highly selective institutions as A-levels. In 2018, the Office for Students (Finlayson 2018: 1)
reported that “98 per cent of students with A-level A*A*A* are going to high tariff institutions
whereas only 21 per cent of students with BTEC D*D*D* are going to the same institutions.” Many Russell Group universities require an A-level to be taken alongside BTEC qualifications (Russell Group 2017: 16) to provide the “broader academic skills required for degree study” (Grove 2016).
Even though the assessment methods are different, UCAS awards the same number of UCAS points for equivalent grades –a ‘D’(‘Distinction’) at BTEC is the equivalent to an ‘A’ at A-level. Educators and academics have voiced concerns at this because students are being awarded the same points for
quite different skill sets. Critics say that the “practical-based qualifications do not adequately prepare students for essay writing, independent study and other aspects of academic life required for degree-level study”(Grove 2016). Dalton and MacKay (2019: 10) found that progression from L4 to L5 was lower for BTEC entrants (81%) than for A-level entrants (96.5%) across a sample of 128 students studying a variety of subjects. However, the same researchers discovered that the percentage of BTEC students that progressed from L4 to L5 significantly increased if they held an A-level qualification (93%).
2-20 Trends in pre-entrance computing qualifications
A variety of computing and IT curriculums have in the past been offered and continue to be available at A and BTEC levels. ICT and Computing may be taken as separate subjects at A-level. BTEC students may elect to take IT, or specialise in Digital Games Design and Development as part of a course in Creative Media Production. The number of students choosing to study A-level Computing has increased yearly since 2014, rising from 4,171 in 2014 to 5,383 in 2015 (an increase of 29%), with a further 16% increase to 6,242 in 2016. These year-on-year increases for A-level Computing represent the greatest changes in uptake of all STEM subjects during this period (Joint Council for
Qualifications 2015; Joint Council for Qualifications 2016a). However, the numbers of students studying computing was still less than that for ICT (8737) in 2016 and remain relatively small when compared with other STEM subjects including: Mathematics (92,163); Sciences (Biology: 62,650; Chemistry: 51,811; and Physics: 35,344); and Design and Technology (12,477) (Joint Council for Qualifications 2016b).
Some educators are sceptical about the value of a previous computing qualification due to a
perception that the quality of award may depend on the background of the school/college and staff
delivering the subject. Boyle and colleagues (2002: 12) wrote that “many students score very highly
in this subject on the basis of project work that has not necessarily instilled the habits and discipline
that university CS departments seek.”
During the 1990s and early 2000s, both the AQA and OCR A-level Computing specifications did not require students to learn programming (Clark & Boyle 2005). This was thought to be due to the lack of programming expertise amongst A-level teachers (Clark & Boyle 2005). However, since the mid-2000s, when Clark and Boyle conducted their research, successive OCR and AQA curriculums have now incorporated programming into their specifications (AQA 2009; OCR 2009). Programming is also now being taught at all stages of compulsory education (KS1-KS4 and A-level) in the 2014 computer science curriculum (Cellan-Jones 2014; Department for Education 2013a; Department for Education 2013b). Both the 2016 BTEC Computing and IT syllabi feature programming units. These are optional for the computing course but mandatory for the diploma level IT course. It therefore appears likely that an increasing number of university entrants will possess coding skills. If learnt correctly, such skills may well be beneficial to some students who might have otherwise struggled with
2-21 Although there is a significant difference between the A-level ICT and A-level Computing syllabi in relation to programming, most students fail to differentiate the two (Gordon 2016: 11). The 2013 OCR A-level ICT syllabus mentions that students are rarely expected to program (OCR 2013: 46), whereas the computing specification dedicates an entire AS unit to programming methods and techniques (OCR 2015: 13). Similarly, AQA’s A-level Computing specification dedicates an AS and A2 unit to teaching programming (AQA 2014a: 5), and the ICT specification does not mention
programming (AQA 2014b: 5). However, Edexcel’s A-level Applied ICT curriculum offers two units on programming: one focused on creating applications (Edexcel 2013: 243) and another involving the modification of spreadsheets and databases with macros (Edexcel 2013: 205). However,
programming units are optional for all Edexcel awards and their inclusion depends on which units are selected by the teacher (Edexcel 2013: 3).
Drummond (2009: 127) compared the L4 and L5 performance of A-level ICT students with A-level Computing students. She found a greater difference between the L4 programming average grade for students who took A-level Computing (at 59.47), compared with those who did not (at 53.33). However, the grade average for students without an ICT A-level (57.84) suggested that they performed better than those with the qualification, for which the average grade was 52.24 (Drummond 2009: 128). Drummond (2009: 137) also discovered that nearly 62% of 21 A-level ICT students said their qualification was unhelpful for undergraduate study, whereas only 13% of 30 A-level Computing students were of this opinion.
Whilst Drummond’s study suggests that A-level Computing is more effective in terms of preparing students for undergraduate level programming, it does not account for the recent increase in students applying with BTEC qualifications. A comparison between the average grades for BTEC and A-level students has yet to be undertaken.
The impact of pre-entrance programming experience
Students may have learnt to program outside of a formal A-level or BTEC qualification through employment or independent study. Earlier research has sought to measure and compare previous programming experience (irrespective of how it was gained) with introductory programming grades. However, studies have yielded mixed results.
Hagan and Markham (2000: 27) conducted a study of 97 students during four stages of an
introductory programming module at Monash University in Australia. Questionnaires were used to elicit biographical information, educational expectations and programming experience. Results