Tunnel
Piles
U = Soil
Movement
UZ
UX
Z
X
Structure
PB 2009 William Barclay Parsons Fellowship
Monograph 25
Nagen Loganathan, PhD
Principal Professional Associate
January 2011
An Innovative Method
For Assessing
Tunnelling-Induced Risks
To Adjacent Structures
An
Inno
vati
ve
Method
for
Assessing
the
Tunnelling-Induced
Risks
to
Adjacent
Str
uctures
Monograph
25
Tunnel
Piles
U = Soil
Movement
UZ
UX
Z
X
Structure
PB 2009 William Barclay Parsons Fellowship
Monograph 25
Nagen Loganathan, PhD
Principal Professional Associate
January 2011
An Innovative Method
For Assessing
Tunnelling-Induced Risks
To Adjacent Structures
First Printing 2011
Copyright © 2011, Parsons Brinckerhoff Inc.
All rights reserved. No part of this work may be reproduced or used in any form or
by an means—graphic, electronic, mechanical (including photocopying),
record-ing, taprecord-ing, or information or retrieval systems—without permission of the publisher.
Published by:
Parsons Brinckerhoff Inc.
One Penn Plaza
New York, New York 10119
Graphics Database: U609
FOREWORD vii
ACKNOWLEDGEMENTS viii
1 0 INTRODUCTION 1
1.1 Purpose and Need . . . 3
1.2 Research Outline . . . 4
1.2.1 Prediction of Ground Loss . . . 5
1.2.2 Closed-Form Solutions to Predict Ground Movement . . . 5
1.2.3 Assessing Tunnelling-Induced Effects on Adjacent Structures . . . 6
1.2.4 Building Risk Assessment Tool . . . 6
2 0 LITERATURE REVIEW 7
2.1 Introduction . . . 9
2.1.1 Ground Loss Components and Mechanisms . . . 9
2.1.2 Ground Loss and Type of TBM . . . 9
2.2 Earlier Research on Ground Loss . . . . 10
2.3 Earlier Research on the Available Methods for Predicting Tunnelling-Induced Ground Movements . . . . 14
2.3.1 Empirical Methods . . . . 14
2.3.2 Analytical Methods . . . . 17
2.3.3 Numerical Methods . . . . 18
2.4 Available Building Risk Assessment Methodologies . . . . 19
3 0 ESTIMATION OF TUNNELLING-INDUCED GROUND
LOSS 25
3.1 Introduction . . . . 27
3.2 Definition of Ground Loss . . . . 27
3.3 Theoretical Background of Gap Parameters. . . . 28
3.3.1 Face Loss Vf . . . 28
3.3.2 Shield Loss Vs . . . . 30
3.3.3 Tail Loss Vt . . . . 33
CONTENTS
4 0 GROUND MOVEMENTS 35
4.1 Introduction . . . . 37
4.2 Closed-Form Solutions for Ground Movements . . . . 38
4.3 Summary - Green Field Ground Movements . . . . 43
5 0 TUNNELLING-INDUCED EFFECTS ON ADJACENT
PILES 45
5.1 Introduction . . . . 47
5.2 Methodology . . . . 47
5.3 Parametric Study . . . . 49
5.4 Design Chart Concept . . . . 49
5.5 Design Charts for Short Piles . . . . 51
5.6 Design Charts for Long Piles . . . . 56
5.7 Summary . . . . 61
6 0 RISK ASSESSMENT METHODOLOGY FOR PILES 63
6.1 Introduction . . . . 65
6.2 Ground and Pile Movement Path . . . . 65
6.3 Pile Location Specific Induced Effects . . . . 68
6.4 Summary . . . . 69
7 0 BUILDING RISK ASSESSMENT TOOL 71
7.1 Introduction . . . . 73
7.2 Risk Assessment Flow Chart. . . . 73
7.3 Tunnelling-Induced Building Risk Assessment for Shallow Foundations . . . . . 75
7.4 Tunnelling-Induced Building Risk Assessment for Pile Foundations . . . . 80
7.5 Summary . . . . 82
8 0 CONCLUSIONS 83
9 0 REFERENCES 87
APPENDICES 93
Appendix A: Design Worksheets 95
A.1 Ground Loss Estimation . . . . 97
iii
Appendix B: General Pile Analysis (GEPAN) Computer
Program 103
Appendix C: Typical Worksheets for Performing
Building Damage Assessments 109
C.1 Typical Stage 2 Assessment Worksheet . . . 111 C.2 Typical Stage 3 Assessment Worksheet . . . 115LIST OF FIGURES
Chapter 1
1.1 Examples of Tunnelling-Induced Building Failures . . . 4
Chapter 2
2.1 Various Ground Loss Components . . . 92.2 Grout and Bentonite Flow Mechanisms around an SPB TBM . . . . 11
2.3 (a) Typical EPB TBM Face Extrusion Pattern . . . . 12
2.3 (b) Typical Face Pressure Variation with Ground Loss. . . . 12
2.4 Definition of Gap around Tunnel . . . . 13
2.5 Comparison of Various Surface Settlement Troughs. . . . 16
2.6 Relationship of Damage to Angular Distortion and Horizontal Strain . . . . 20
Chapter 3
3.1 Circular and Oval Ground Deformation Patterns Around a Tunnel . . . . 273.2 Schematic of TBM Configuration with Cutter Bead and Tapered Shield . . . . . 31
3.3 TBM Face Pressure Acting on the Shield Gap for EPB TBM . . . . 32
` 3.4 Ground Movement and Shield Gap Filling Mechanism for EPB TBM . . . . 33
Chapter 4
4.1 Tunnelling-Induced Ground Movements - Green Field. . . . 374.2 Ground Deformation Patterns and Ground Loss Boundary Conditions . . . . . 38
4.3(a) Subsurface Settlement . . . . 41
4.3(b) Lateral Deformation. . . . 41
4.4 Comparison of Centrifuge Test Results . . . . 42
4.5 Key Diagram - Tunnel Dimensions . . . . 43
Chapter 5
5.1 Single Pile Adjacent to Tunnelling - The Basic Problem Analysed . . . . 485.2 Design Charts: Tunnelling-Induced Effects for Short Pile Base Case . . . . 52
5.3 Design Charts: Correction Factors for Strength - Short Pile . . . . 53
5.4 Design Charts: Correction Factors for Pile Diameter - Short Pile . . . . 54
5.5 Design Charts: Correction Factors for Pile Length/Tunnel Depth Ratio - Short Pile. 55 5.6 Design Charts: Tunnelling-Induced Effects for Long Pile Base Case . . . . 57
5.7 Design Charts: Correction Factors for Strength - Long Pile . . . . 58
5.8 Design Chart- Correction Factors for Pile Diameter - Long Pile . . . . 59 5.9 Design Chart- Correction Factors for Pile Length/Tunnel Depth Ratio - Long Pile . 60
v
Chapter 6
6.1 Section and Plan View Showing Settlement Influence Zones and Pile
Movements for Negative Face Loss . . . . 66
6.2 Section and Plan View Showing Settlement Influence Zones and Pile Movements for Positive Face Loss . . . . 67
6.3 Extent of Various Displacement Zones . . . . 68
Chapter 7
7.1 Risk Assessment Tool: Flow Chart for Assessing Potential Damage to Existing Buildings . . . . 747.2 Typical Settlement Contour Map with Building Footprints . . . . 76
7.3 Typical Worksheet for Stage 1 Risk Assessment . . . . 77
7.4 Definition of “Hogging” and “Sagging” . . . . 78
7.5 Building Risk Designation Plot . . . . 79
LIST OF TABLES
Chapter 2
2.1 Recommended i Values by Various Researchers. . . . 15 2.2 Damage Assessment Criteria for Stage 1 and Stage 2 . . . . 22
Chapter 4
4.1 Comparison of Estimated and Observed Surface Settlement Trough Parameters . 40
Chapter 6
6.1 Critical Tunnelling-Induced Values on Piles . . . . 69
Chapter 7
7.1 Damage Classifications - Typical Values for Maximum Building Slope and
vii
FOREWORD
Tunnelling-induced damage to adjacent structures and utilities is generally highly publi-cised by the media and has had negative consequences for the engineering industry as a whole. Owners, lending institutions, insurers, contractors, and many national and international tunnelling associations share a common goal: reduce the cost and risk associated with tunnel-ling and improve public perception of the tunneltunnel-ling industry.Urban tunnels are often excavated adjacent to high-rise buildings, beneath highways and bridge structures, and over or under other tunnels serving transportation or private and public utilities. The increasing need for urban tunnelling in such densely developed underground areas and the associated risks are leading clients to seek consultants equipped with innovative yet proven methods for assessing these risks and for mitigating them through design before construction begins. Key to developing such designs is an understanding of tunnelling-induced ground loss mechanisms and the associated displacements, and the risks they pose to adjacent buildings, structures and utilities.
This monograph presents an innovative method for assessing the tunnelling-induced risks to adjacent structures, especially at the early stages of project development, such as route selection and concept design. It is based on relatively complicated soft-ground tunnelling in an urban environment. This new risk assessment tool comprises:
• A new method for assessing the various components of the ground loss associated with tunnel boring machine (TBM) excavation in soft ground
• New closed-form solutions for predicting tunnelling-induced settlements
• Design charts for predicting tunnelling-induced effects on adjacent pile foundations • A new risk assessment flow chart that includes shallow and pile foundations. For the completeness of this subject (tunnelling-induced risk to adjacent structures) this monograph covers risk associated with buildings founded on pile foundations (findings of this research) and on shallow foundations (well established methods from literature).
This monograph is intended to be used as a “PB Guideline” for assessing tunnelling-induced risks to adjacent structures in urban environments. It is expected that it will also pro-mote awareness of such risks among PB engineers who are involved in proposals, concept studies and detailed designs of tunnel projects. When we, in turn, make tunnel owners and builders aware of such risks at the early stages of the project, we help them to avoid financial risk to the project. In addition, our having more accurate information about tunnelling-induced risks in the early stages of project development will open avenues for working with major banks and insurance companies covering tunnelling projects in urban areas.
I wish to express my gratitude and appreciation to the Board of Directors of Parsons Brinckerhoff for establishing and supporting the William Barclay Parsons (WBP) Fellowship. This program was designed to introduce engineering innovations and best practices that advance the state-of-the-art, benefit our clients and enhance PB’s leadership role in the indus-try. I am grateful also to the PB Career Development Committee for identifying the potential of my research proposal and supporting my work and completion of this monograph.
I am particularly indebted to Richard Flanagan, Principal Professional Associate of PB, for his direction, encouragement, constructive comments and support throughout this research. I also thank Doug Maconochie and Jim Rozek for their support as fellowship sponsors and reviews of this monograph.
I also thank my PB colleagues, Joe O'Carroll and Kenneth Xu, for their support and help, and PB Australia management for its support during my research. I sincerely thank Pedro Pablo Silva for his professional graphics works and type settings, and Lorraine Anderson for her professional editing of this monograph.
I thank Professor Harry Poulos, Senior Principal from Coffey Geosciences, for his support and advice on my previous research and my most recent work presented herein.
Finally, I thank my wife, Dilanthy, and our children, Ajaey and Dhaarani, for their love and support.
Nagen Loganathan, PhD Principal Professional Associate Parsons Brinckerhoff
Level 27, Ernst & Young Centre 680 George Street
Sydney NSW2001 Australia
1.0 IntroductIon
1.1 PurPoSE And nEEd
Tunnelling is truly an international market and core business for PB. With the increase in urban tunnelling and associated risks, particularly those due to ground movements, clients continually seek consultants equipped with innovative yet proven methods to assess and miti-gate these risks through design before going into construction.
Assessing tunnelling-induced ground loss is a major issue when predicting ground move-ments and their effects on adjacent structures. Presently, there are no methods available to tunnel designers for estimating the ground loss values for proposed tunnels based on tunnel configuration, construction method and ground conditions. Designers rely instead upon empiri-cal assumptions made from similar projects. The problem in doing so is that no two tunnelling projects are the same, and the complexity, risk and consequence of failure seem to increase with every new project undertaken.
In urban environments, many high-rise buildings are supported by deep foundations that, if adjacent to a new tunnel excavation, are subject to axial and lateral forces caused by tunnel-ling-induced ground movements. These movements may jeopardize the integrity of the founda-tion elements themselves. Therefore, tunnelling-induced effects on adjacent structures should be assessed and added to the original design values of the adjacent structures to assess whether the total value exceeds the ultimate capacity of each foundation element.
Tunnelling-induced damage to adjacent structures and utilities is generally highly pub-licised by the media and has negative consequences for the industry as a whole. In recent years, insurers have had some significant financial losses and now insist on risk evaluation measures up front. Owners, lending institutions, insurers, contractors, and many national and international tunnelling associations share a common goal: reduce the cost and risk of tunnel-ling and improve public perception of the tunneltunnel-ling industry.
The assessment of tunnelling-induced risks prior to construction is a challenge to design-ers, constructors and tunnel owners. Ground movements around tunnels are a critical factor in assessing tunnelling-induced risks; however, most existing methods for determining ground movements are inadequate, over-simplistic or overly complicated. The importance of accurate-ly assessing ground loss and tunnelling-induced deformations has been emphasised in recent years due to an increase in the number of urban tunnelling projects. Further, the results of not doing so have been illustrated quite dramatically. For example, Figure 1.1 shows some of the major tunnelling-induced failures of recent times.
3
1.0 INTRODUCTION
Figure 1.1 Examples of Tunnelling-Induced Building Failures
(a) Building on a Pile Foundation (b) Building on a Shallow Foundation With property values as high as they are now in all major urban centres and the high risk of human loss or injury, it is critical that designers have a methodology that enables them to assess ground loss values accurately so they can minimise the risk of damage. Such a meth-od must use geotechnical parameters and take into account the TBM configuration and TBM operational parameters. This methodology can then be used to determine the appropriate TBM configuration and operational parameters to minimise ground movements for any given project considering the risk profiles of buildings along the alignment.
1.2 rESEArcH outLInE
The research conducted under the PB 2009 William Barclay Parsons (WBP) Fellowship builds upon the author’s previous research work and extensive experience in assessing tun-nelling-induced effects on adjacent structures. His analytical solutions for tuntun-nelling-induced ground movements for stiff ground (soil) conditions with lateral earth pressure coefficient of one (k0=1) have been published previously. This monograph essentially brings to culmination
the previous research efforts and incorporates the outcomes of this current research, capturing the entire knowledge base in one unified model. It includes examples of the input parameters, development of design charts, output results, actual field data and comparisons to existing methods. The results presented herein can be used worldwide, and they provide PB with a step-up in the tunnelling industry.
5
1.2.1 Prediction of Ground Loss
Tunnelling-induced ground movements during pressurised faced TBM tunnelling in soft ground occur in the radial and longitudinal directions with ground moving into the tunnel exca-vated face (both face and sides). The volume of soil that intrudes into the tunnel owing to the pressure release at the excavated face will be excavated eventually. The movement of soil into this opening can be related to the concept of "loss of ground,” which is defined as the volume of material (through face or radial encroachment over and around or behind the TBM shield) that has been excavated in excess of the theoretical design volume of excavation. Ground loss for a TBM excavated tunnel occurs in three stages:
• Face loss (longitudinal ground movement into the tunnel face)
• Shield loss (radial ground movement into the gap created by TBM overcut) • Tail loss (due to the gap closure at the tail).
In this study, the ground loss components at each stage of the tunnel excavation are estimated to understand the ground movement patterns and the induced effects on adjacent piles, these effects being:
• Settlement of pile head
• Maximum lateral movement of pile • Down drag forces
• Bending moments.
It is demonstrated that these effects result in stressing and destressing on the adjacent foundation, and that these impacts on the foundation can be minimised by controlling the vari-ous ground loss components. TBM face pressures, TBM configuration (cutter bead thickness, shield taper, thickness of tail skin, clearances for segment erection, etc.) and grouting proce-dures are the major factors discussed.
A design worksheet developed for estimating various ground loss values is also present-ed. It will be a valuable guide for designers to follow when assessing one of the most crucial elements of risk when tunnelling adjacent to pile foundations.
1.2.2 closed-Form Solutions to Predict Ground Movement
A ground movement prediction will be of practical use only if it takes into account the effects of a number of parameters, such as:
• Excavation and tunnel construction methods • Tunnel depth and diameter
• Groundwater conditions • Initial stress state
• Stress-strain-strength behaviour of the soil around tunnel.
Current “rules” for estimating ground settlement from tunnelling operations have been derived generally from empirical correlations between some of these parameters and observed
settlement data. Hence, they account for only a few of the significant factors, so extrapolation to other cases is questionable at best because generally similar conditions are not fulfilled.
In this monograph, closed-form solutions for predicting ground deformation are presented for various ground loss components and the ground movements experienced by adjacent pile foundations during TBM excavation.
1.2.3 Assessing tunnelling-Induced Effects on Adjacent Structures
Design charts developed to assess the tunnelling-induced effects on adjacent deep-pile foundations are presented herein. These charts will help designers to estimate the tunnelling induced effects on an adjacent pile foundation at various stages of the excavation.In addition, based on these charts, designers may assess TBM face pressures required to minimise ground movements and the associated impacts on nearby foundations.
1.2.4 Building risk Assessment tool
The risk assessment tool presented in this monograph is applicable to buildings founded on both shallow and pile foundations (including combined footings). The risk assessment pro-cedure for shallow foundations is based on commonly adopted published information. Risk assessment for buildings on pile foundations is based on the findings of this research.
2.0 Literature review
2.1 iNtrODuCtiON
This chapter presents a review of some of the considerable research performed by others in the fields of ground loss, ground movement and risk of tunnelling-induced damage to build-ings. Before the review is a brief introduction to ground loss components and mechanisms, and to the ground loss mechanisms for the two types of TMBs used for soft-ground excavation.
2.1.1 Ground Loss Components and Mechanisms
Tunnel excavation is associated inevitably with ground loss, which, in turn, results in asso-ciated ground movement. It is important, therefore, to minimize ground loss when tunnelling through urban areas. To do so requires that designers understand the components and mech-anisms associated with ground loss during TBM operations.
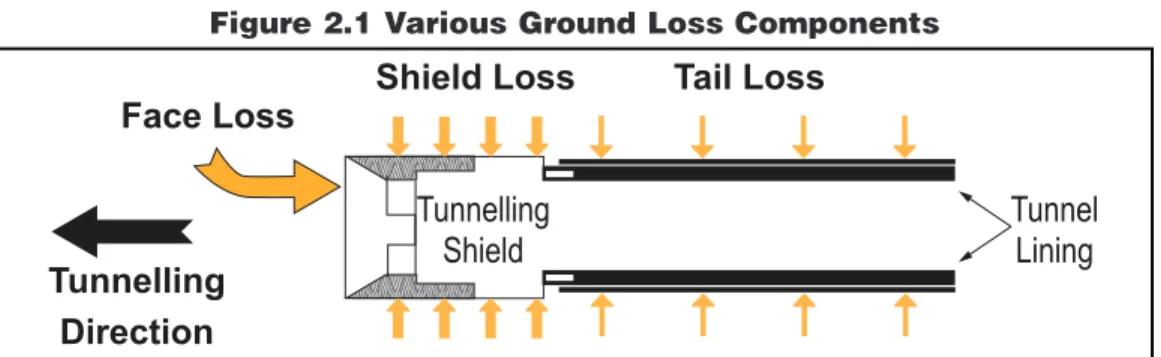
The various ground loss components that can occur during tunnel excavation are shown in Figure 2.1.
Figure 2.1 Various Ground Loss Components
The mechanisms associated with the ground loss components are as follows:
• Face loss occurs when the change in ground stress at the TBM face causes longi-tudinal ground movement into the tunnel face.
• Shield loss occurs when the ground moves radially into the gap created around the tunnel shield by TBM overcut. This overcutting of the ground is done to minimise the friction between the ground and the TBM. Overcutting is also carried out at curves during tunnel excavation.
• Tail loss results from shrinkage and/or incomplete filling of the grout or pea gravel that is applied to the tail gap immediately after the segmental lining leaves the TBM shield.
2.1.2 Ground Loss and type of tBM
The ground loss mechanisms for the two types of TBMs used most commonly for soft soil tunnelling—earth pressure balance (EPB) and slurry pressure balance (SPB)—are similar with
9
2.0 Literature review
Tail Loss
Shield Loss
Face Loss
Tunnelling
Shield
Tunnel
Lining
Tunnelling
Direction
one exception. It is accepted that SPB TBMs control shield loss better than EPB TBMs by bet-ter stabilising the gap around the shield as the TBM advances.
A brief summary of the two types of TBMs is as follows:
• Earth pressure balance (EPB). EPB TBMs use the excavated soil to apply a sup-port pressure to the tunnel face. Often various additives are injected into the soil as it is excavated to ensure appropriate muck properties to achieve the optimum TBM advance rate without causing excess ground loss.
• Slurry pressure balance (SPB). Slurry shields stabilize the tunnel face by apply-ing a pressurised bentonite slurry that is mixed into the soil durapply-ing TBM operations and then separated later, after the soil has been excavated, in a separation and recovery plant.
2.2 earLier researCh ON GrOuND LOss
Many research works have been performed to understand the ground loss mechanisms. Bezuijen and Bakker (2007) carried out detailed numerical analyses and field monitoring to understand the gap grout flow and face slurry flow mechanism and, from this, to estimate the ground loss associated with the gap closure around the TBM shield.
Figure 2.2 shows three possible grout flow mechanisms around an SPB tunnel shield. These mechanisms depend on the magnitude of the slurry pressure and gap grout pressure. The three possible flow conditions illustrated occur as explained below:
1. (Top): Grout flows from the tail to the face and bentonite flows from the face to the tail. This condition occurs when shield loss occurs due to bleeding of the grout or penetration of the bentonite into the soil. For this condition, the lowest pressure will occur where the grout and bentonite meet.
2. (Middle): Bentonite flows back to the tail and pushes the grout out of the gap between the TBM and soil. The pressure will be highest at the tunnel face and will decrease when going towards the tail. This condition cannot be continuous but can occur temporarily.
3. (Bottom): Grout flows to the tunnel face and pushes the bentonite with it. The pres-sure is highest at the tail close to the grout injection points and decreases toward the face.
11
Figure 2.2 Grout and Bentonite Flow Mechanisms
around an SPB TBM (Bezuijen & Bakker, 2007)
The realistic ground loss around the shield should include the ground displacement around the gap; however, the ground displacement equilibrium state should be assessed. These aspects were explored further as part of the WBP Fellowship research to establish ground loss mechanisms.
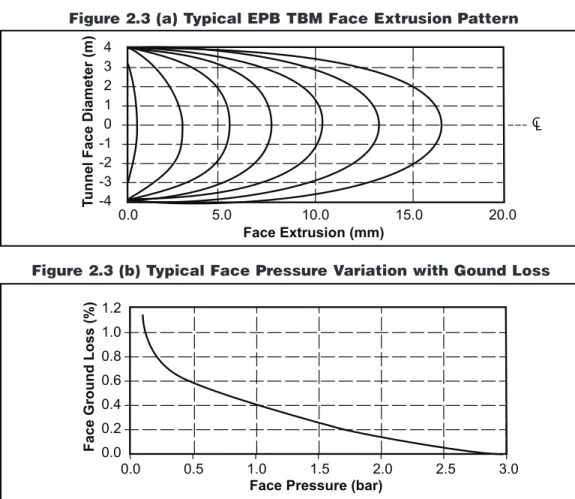
Gatti & Cassani (2007) reported various methods for estimating the ground loss for an EPB TBM. Figure 2.3 (a) shows typical face extrusion values. More ground is extruded at the centre of the TBM and less at the shield skin. This observation was attributed to the friction resistance between the soil and the shield skin at the face. This aspect was studied in detail as part of this WBP Fellowship research to assess the face loss component.
Figure 2.3 (b) shows a typical variation of face loss with the earth pressure at the TBM face. As indicated, the face loss decreased as the face pressure increased.
Figure 2.3 (a) Typical EPB TBM Face Extrusion Pattern
Figure 2.3 (b) Typical Face Pressure Variation with Gound Loss
Rowe and Lee (1992) established a method to predict the equivalent two-dimensional “gap” at the tunnel crown considering ground movements in longitudinal and radial directions. They defined gap parameters as:
g = Gp + U*3D +
ω
(2.1)Where:
Gp = the physical gap (usually the difference between the theoretical maximum outside diameter of the tunnelling machine and the outside diameter of the lining for a circular tunnel)
U*3D = the three dimensional (3-D) elasto-plastic deformation into the tunnel face
w = the gap due to the overcutting bead.
Figure 2.4 shows the tunnel head and the 2-D plane strain representation of the tunnel heading. 4 3 2 1 0 -1 -2 -3 -4 0.0 0.4 0.6 0.8 1.0 1.2 0.2 0.0 0.0 0.5 1.0 1.5 2.0 2.5 3.0 5.0 10.0 15.0 20.0 Face Extrusion (mm)
Tunnel Face Diameter (m)
Face Pressure (bar)
Face Ground Loss (%)
CL 4 3 2 1 0 -1 -2 -3 -4 0.0 0.4 0.6 0.8 1.0 1.2 0.2 0.0 0.0 0.5 1.0 1.5 2.0 2.5 3.0 5.0 10.0 15.0 20.0 Face Extrusion (mm)
Tunnel Face Diameter (m)
Face Pressure (bar)
Face Ground Loss (%)
13
Figure 2.4 Definition of Gap around Tunnel
Rowe and Lee (1992) defined the physical gap as:
Gp = 2D + d (2.2) Where:
D = the thickness of the tailpiece
d = the clearance for erecting the lining.
The free-field stress state at a given section is modified as the excavation of the tunnel approaches it, as follows:
• If pressure on the tunnel face is lower than the free field stress, then the soil mass will move towards the tunnel face.
• If pressure on the tunnel face is larger than free field stress, then the earth will be pushed outside and result in negative face loss.
The volume of soil that intrudes into the tunnel face owing to pressure release at the face will be excavated eventually. The elasto-plastic deformation component, U*3D , is defined as:
(2.3)
Where:
k = soil-cutter resistance factor
dx = face intrusion.
Lo et al. (1984) derived an expression for the elasto-plastic plane strain displacement (Ui)
for cohesive soils at the tunnel crown as:
Gp
Tunnel Heading
Simulated
Tunnel
Opening
Lining
d D =d+2( + ) d Segmental Lining (2.4)Where:
R = tunnel radius
Eu = undrained Young’s Modulus cu = undrained strength of the soil vu = undrained Poisson’s ratio N = stability number.
The smallest of 0.6Gp and (1/3)Ui is chosen and designated as w*, (the gap due to the overcutting bead). The value of w includes the radial ground loss due to the overcutting beads and copy cutters, which provide additional gap to minimise the friction between the TBM and the ground. (Overcutting can also occur at tunnel curves.)
The concept of using gap parameters has been studied further to develop a method for assessing various ground loss components, as discussed in Chapter 3.
2.3 earLier researCh ON the avaiLaBLe MethODs FOr
PreDiCtiNG tuNNeLLiNG-iNDuCeD GrOuND
MOveMeNts
Methods of estimating soil movement associated with tunnelling may be classified broadly into three categories; empirical, analytical and numerical. The usage and the limitations of each category are discussed below.
2.3.1 empirical Methods
Surface Settlements. The well-established empirical methods available to date are used primarily to estimate surface settlements in soft ground. The one used most commonly was proposed by Peck (1969), who found that based on a number of field measurements, the surface settlement trough could be represented by a shape of a probability distribution curve, or error curve, as shown in Equation 2.5:
(2.5) Where:
S = surface settlement at a transverse distance x from the tunnel centre line
Smax = maximum settlement at x=0
i = location of maximum settlement gradient or point of inflexion.
A significant amount of research involving field observations and model tests has been devoted to the estimation of Smax and the i values for different ground conditions. The
15
Table 2.1 Recommended
i
Values by Various Researchers
The maximum settlement can be estimated using Equation 2.6 as proposed by Mair (1993):
(2.6)
Where:
VL = ground loss (ratio of ground loss volume/tunnel volume per meter length) D = diameter of the tunnel.
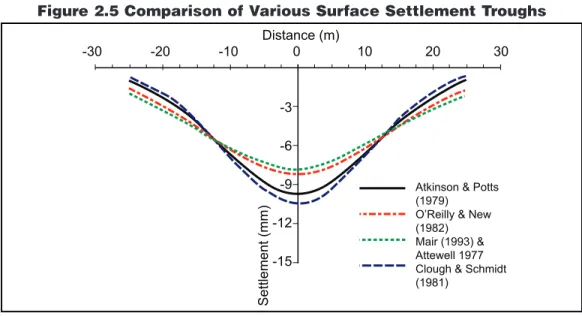
Figure 2.5 shows a comparison of various predicted surface settlement troughs for a hypo-thetical 6-m (20-foot) diameter tunnel at a 30-m (98-foot) depth. The ground loss volume/tunnel volume ratio was assumed as 1 percent. As shown, the maximum surface settlements predict-ed by various methods are in the range of 7 mm to 10 mm (0.3 inch to 0.4 inch). The surface settlement trough width, i, varies from 8.3 m to 15 m (27.2 feet to 49.2 feet). These results show the variability of empirical predictions proposed by various researchers due to the variability in the databases they used for the derivation of i values.
Table 2.1 Recommended i - values by Various Researchers
Name i- value Remark
Peck (1969)
: n = 0.8 to 1.0 Based on field observations Atkinson & Potts
(1979) : for loose sand, : for dense sand and over consolidated clay
Based on field observations and model tests
O’Reilly & New
(1982) : cohesive soil : granular soil
Based on field observations of UK tunnels
Mair (1993) Based on field observations worldwide and centrifuge test Attewell (1977) : = 1 and n = 1 Based on field observations
of UK tunnels Clough & Schmidt
(1981) : = 1 and n = 0.8 Based on field observations of US tunnels Note: z0 is the depth of tunnel below ground (at tunnel springline) and R is the tunnel radius.
Figure 2.5 Comparison of Various Surface Settlement Troughs
Subsurface Settlements. At present, few empirical methods are available to predict subsurface settlement profiles. The two used most widely are those proposed by Mair (1993) and Atkinson & Potts (1979).
Mair (1993) stated that it is often assumed that the shapes of subsurface settlement pro-files developed during tunnel construction are characterised by a Gaussian distribution in the same manner as for surface settlement profiles. His empirical method proposed for estimating the subsurface settlements is as follows:
(2.7)
Where:
iz = k(Zo-Z)
Therefore,
Atkinson & Potts (1979) proposed the following method, which is based on model tests, to estimate subsurface settlements for shallow tunnels:
(2.8)
Atkinson & Potts (1979) O’Reilly & New (1982) Mair (1993) & Attewell 1977 Clough & Schmidt (1981) Settlement (mm) Distance (m) -30 -20 -10 0 -3 -6 -9 -12 -15 10 20 30
17
Where:
α = 0.57 for dense sand
α = 0.40 for loose sand
α = 0.13 for over-consolidated clays
Sz = settlements at depth z
Sz,max = maximum settlement at depth z.
Vermeer and Bonnier (1991) proposed a similar empirical formula:
(2.9)
Norgrove et al (1979) established an empirical relation as a ratio of the subsurface settle-ment:
(2.10)
Where:
Sx = lateral deflection Sz = settlement at depth z
x = lateral distance from the tunnel centreline Z0= depth of the tunnel.
These empirical methods do not give highly accurate results, however, as they are subject primarily to two important limitations:
• Their applicability to different ground conditions and construction techniques • The limited empirical relationships established to predict horizontal movements and
subsurface settlements.
2.3.2 analytical Methods
As mentioned, ground deformation prediction should account for the effects of a number of parameters if it is to be of use. These parameters include:
• The construction method and tunnel driving details • Tunnel depth and diameter
• Ground water conditions • The initial stress state
• The stress-strain-strength behaviour of the soil around the tunnel excavation. Current “rules” for estimating ground settlement from tunnelling operations were derived generally from empirical correlations between some of those variables and the settlements observed in actual tunnels, as described in Section 2.3.1. Hence, they account for only a few of the significant factors, and extrapolation to other cases is questionable mainly because similar conditions are generally not fulfilled. Only a few attempts to develop analytical methods (closed-form solutions) that incorporate all factors contributing to ground deformations have appeared:
• Sagaseta (1987) presented closed-form solutions for obtaining the strain field in an initially isotropic and homogeneous incompressible soil due to near-surface ground loss from tunnelling.
• Verruijt and Booker (1996) presented an analytical solution for tunnels in homoge-neous elastic half spaces using an approximate method suggested by Sagaseta (1987) for the case of ground loss.
The solution given by Verruijt and Booker is a generalisation of Sagaseta’s solution in that it:
• Gives the solutions for the case of ground loss for the incompressible case and for arbitrary values of Poisson’s ratio
• Includes the effect of ovalisation (tunnel lining deformation) in the long term. Verruijt and Booker’s closed-form solutions for the estimation of settlements and lateral deformations are as follows:
Estimation of settlements:
(2.11)
Estimation of lateral deformations:
(2.12)
Where:
ε = uniform radial ground loss
d = long term ground deformation due to the ovalization of the tunnel lining
z1 = z-H z2 = x+H r12 = x2+z12 r22 = x2+z22
R and h = tunnel radius and depth
m = 1(1-2v) k = v/(1-v)
ν = Poisson’s ratio of soil.
2.3.3 Numerical Methods
Some of the limitations in empirical methods (and, consequently, analytical methods) may be overcome by the finite element method, which indeed has been used widely for tun-nelling analyses. For example, Rowe and Kack (1983) found in their analyses of some case
19
histories that their finite element technique generally gave good estimates of soil settlements as compared with those measured, although unfavourable comparisons were found in some cases. Successful predictions of lateral soil movements by the finite element method were also reported by Lee et al. (1992). Gunn (1993) reported that a finite element analysis gave poor predictions for surface settlements, however, even with a refined constitutive soil model. Gunn found that the surface settlement trough was too wide and shallow compared with those given by the empirical methods (error curve) and field measurements.
Simpson et al. (1996) concluded from their analyses of excavation in London Clay that the predicted surface settlement trough was substantially influenced by the anisotropic shear modulus, but that it was little influenced by non-linearity of ground stiffness. Addenbrooke (1997) reported that better predictions could be achieved by using sophisticated soil models that accounted for non-linear soil behaviour at small strain.
The findings of various researchers appear contradictory in terms of the selection of appropriate soil models for predicting tunnelling-induced ground deformations. Finite element predictions require considerable expertise, modelling and interpretation skill to obtain accurate results. Further, the following aspects need to be modelled accurately:
• The realistic stress path that soil (soil-structure interaction mechanism) experiences during the tunnel excavations for different tunnelling methods
• The three-dimensional effect of various ground loss components, typically face loss and the radial ground loss
• The stress-strain behaviour of the soil around the tunnel.
2.4 avaiLaBLe BuiLDiNG risK assessMeNt
MethODOLOGies
In practice, building damage assessments are carried out in three stages to simplify the assessment procedure, as suggested by Mair (1996). As the first step, settlement contours are plotted along the project corridor and all existing building footprints plotted onto the settle-ment contour maps. Maximum settlesettle-ment and angular distortions have been estimated for each structure.
To focus the assessment on the buildings most susceptible to damage, an initial assess-ment, Stage 1, is conducted to filter out those properties where the risk of damage was antici-pated to be low (negligible or slight damage category on Table 2.2 at the end of this chapter). Stage 2 and Stage 3 evaluations are then carried out on buildings where a higher potential for damage (moderate and severe damage category) was predicted in the Stage 1 assessment.
Stage 1 - Preliminary Assessment
This assessment is based upon the estimation of ground settlement magnitude and slope under assumed “green field” conditions. Six risk categories ranging from 0 (negligible) to 5 (very severe) are used to define the possible degree of damage. Table 2.2 shows the criteria for the preliminary assessment.
Stage 2 - Second Stage Assessment
horizontal and shear strains induced on the building are estimated. A criterion based on criti-cal strain developed at the building-ground interface and proposed by Burland (1997) and Boscardin & Cording (1989) is used (refer to Table 2.2).
The Stage 2 assessment is considered conservative because it assumes the building has no stiffness and deflects to conform to the green field settlement trough. In practice, however, the actual level of damage is likely to be less than the assessed category due to the contribu-tion of the structural stiffness of the building.
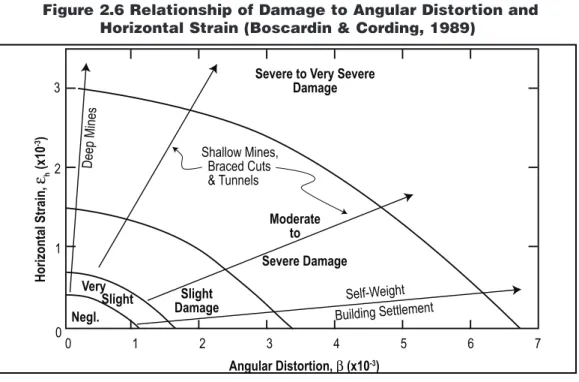
Figure 2.6 shows an alternative method proposed by Boscardin & Cording (1989) based on angular distortion and horizontal strain. This method has been used at the early stages of studies for cut and cover tunnels. Both methods proposed by Boscardin & Cording (1989) and Burland (1997) provide consistent damage classification.
Figure 2.6 Relationship of Damage to Angular Distortion and
Horizontal Strain (Boscardin & Cording, 1989)
Stage 3 - Detailed Evaluation
Detailed evaluation is undertaken for buildings classified in Category 3 and above (moder-ate or worse) during the Stage 2 assessment. In Stage 3, the potential risk induced by tunnel excavation, the consequences of the risk, and the type of building with respect to implement-ing observational risk management plans are considered.
The Stage 3 evaluation starts with a site visit for visual inspection and assessment of the building stiffness, existing conditions and potential consequences of the damage. Based on site inspections and review of existing information, the risk designation of the building can be revised considering the following:
Severe to Very Severe Damage Moderate to Severe Damage Shallow Mines, Braced Cuts & Tunnels Slight Damage Negl. Very Slight Self-Weight Deep Mines Building Settlement 3 2 1 0 0 1 2 3 4 5 6 7 Angular Distortion, β (x10-3) Horizontal Strain,
ε
h (x10 -3)21
• Geotechnical conditions, sub-surface profile and groundwater conditions • Stiffness of the building (timber, masonry or framed buildings)
• Foundation type
• Details of heritage listing of the building and the age of the building
• Sensitivity and usage of the building such as office, private home, public building, sports facility etc.
Any building that is designated as “moderate” risk or worse after the site inspection will be subjected to a detailed study considering the relative stiffness of the building and the ground based on the method proposed by Addenbrook et al. (1997) and to an intensive monitoring programme.
For buildings on pile foundations, only detailed evaluations (Stage 3) are performed using numerical methods. At present, various numerical approaches are used to estimate pile group responses due to combinations of external loadings. The computer programs available for such analysis vary in the type of approach used and in the sophistication of their treatment of different aspects of group behaviour. Among the most widely used general programs are PGROUP (Banerjee and Driscoll, 1976), DEFPIG (Poulos, 1979, 1990), and PIGLET (Randolph, 1980). These programs are based on elastic continuum analysis, although DEFPIG can also be extended into the non-linear range by specifying limiting values of skin friction and lateral pres-sure along the pile.
22
Table 2.2: Damage Assessment Criteria for Stage 1 and Stage 2
Building damage classification After Burland (1995), and Mair et al (1996)
Approximately equivalent ground settlement and slopes (after Rankin 1988) 1 Risk Cat 2 Description of degree of damage 3
Description of typical and likely forms of repair for typical masonry
buildings 4 Approx. crack width (mm)1 5 Max. tensile strain %2 6 Max. slope of ground3 7 Max. settl. of building (mm)3
0 Negligible Hairline cracks. Less
than 0.05 1 Very slight Fine cracks easily treated
during normal redecoration. Perhaps isolated slight fracture in building. Cracks in exterior visible upon close inspection.
0.1 to 1.0 0.05 to 0.075 Less than 1:500 Less than 10
2 Slight Cracks easily filled. Redecoration probably required. Several slight fractures inside building. Exterior cracks visible; some repainting may be required for weather-tightness. Doors and windows may stick slightly.
1 to 5 0.075
to 0.15
1:500 to 1:200 10 to 50
3 Moderate Cracks may require cutting out and patching. Recurrent cracks can be masked by suitable linings. Brick pointing and possible replacement of a small amount of exterior brickwork may be required. Doors and windows sticking. Utility services may be interrupted. Weather tightness often impaired. 5 to 15 or a number if cracks greater than 3 0.15 to 0.3 1:200 to 1:50 50 to 75
4 Severe Extensive repair involving
removal and replacement of walls especially over door and windows required. Window and door frames distorted. Floor slopes noticeably. Walls lean or bulge noticeably. Some loss of bearing in beams. Utility services disrupted. 15 to 25 but also depends on number of cracks Great-er than 0.3 1:200 to 1:50 Greater than 75 5 Very
severe Major repair required involving partial or complete reconstruction. Beams lose bearing, walls lean badly and required shoring. Windows broken by distortion. Danger of instability. Usually greater than 25 but depends on number of cracks Greater than 1:50 Greater than 75
23
Notes:
1) Crack width is only one factor of assessing the category of damage and should not be used on its own as a direct measurement of it.
2) Local deviation of slope from the horizontal or vertical of more than 1/100 will normally be clearly visible. Overall, deviations in excess of 1/150 are undesirable.
3) Columns 6 and 7 also indicate "green field" settlements and settlement trough slopes and are based on the methods of Rankin (1987). Category of damage using the Rankin method are approximately equivalent to those proposed by Burland, although in some cases there may be significant differences.
Considering the existing methods of building damage assessment for shallow foundations, a global procedure that includes both shallow and deep pile foundations is presented in this monograph (Chapter 7).
3.0 Estimation of tunnElling-inducEd
ground loss
3.1 INTRODUCTION
The accurate assessment of tunnelling-induced effects on adjacent structures depends on the accuracy of the predicted tunnelling-induced ground loss values and ground deformation. At present, ground loss values are assumed, based on past experience and the outcomes of previous tunnelling projects under similar conditions. In reality, ground loss values are likely to vary depending on tunnel-ling methods, tunnel configuration, soil types and other factors. The fact that such variation in empirical observations exists suggests the need for a more logical approach to estimating ground loss due to tunnelling.
A new method for assessing the various ground loss components, such as face loss, shield void loss and tail void loss, was developed as part of this WBP fellowship research. This work took into con-sideration the various aspects of ground loss mechanisms covered in the published works by other researchers, as discussed in Chapter 2.
This new method can be used prior to construction to predict ground loss parameters based on known TBM geometry, geotechnical conditions and the tunnel configuration.1 The total ground loss prediction has been verified for case histories (Loganathan et al, 2005; Loganathan et al, 2000 and Loganathan and Flanagan, 2001). Prediction of various components of ground loss presented in this monograph has not yet been verified; however, such verification is planned for the future. It will be based on either field measurements or/and three dimensional numerical modelling, and after it is com-pleted, this monograph will be updated.
3.2 DEFINITION OF GROUND LOSS
Ground loss is defined as the volume of material (through face or radial encroachment over and around or behind the shield) that has been excavated in excess of the theoretical design volume of excavation. In this study, ground loss estimation assumes uniform radial ground movement (average ground loss) and is denoted as VL (%). In practice, the soil movement around a tunnel is non-uniform due to the oval-shaped gap at the crown caused by the gravity effect. Figure 3.1 shows the uniform and “actual” shapes of the gap around the tunnel.
Figure 3.1 Circular and Oval Ground Deformation Patterns Around a
Tunnel
27
3.0 Estimation of tunnElling-inducEd
ground loss
Oval-Shaped Ground Movement Uniform Radial Ground Movement
Tail Void Tunnel
T*
˜
T*T*
Empirical
(a) This Study(b) - Ground Movement Vector T* - Thickness of the Annular Gap
˜
2xT* ‘g’-1A note of caution: During construction, even the most accurately predicted ground loss is subject to the human factor, the TBM operator.
The equivalent average undrained ground loss (VL), which is also referred to as
e
o in this monograph, is defined with respect to the gap parameter as follows:(3.1)
Where:
R = radius of the tunnel
g = estimated gap at the crown.
The second order gap (g2) has been neglected because it has only a negligible effect on the ground loss value; i.e., the second order ground loss component for 1 percent ground loss is about 0.01 percent (only 1 percent error in ground loss estimation).
The ground loss components at various stages of the tunnel excavation are estimated to help designers understand the ground movement patterns and the induced effects on adja-cent structures. With this information, they will be better able to determine appropriate meth-ods for controlling ground loss and to recommend the appropriate face pressure and TBM configuration for minimising the physical gap.
3.3 ThEORETICAL BACkGROUND OF GAP PARAmETERS
The estimated ground loss deformation patterns are greatly influenced by the ground loss parameter. As discussed and illustrated in Section 2.1.1, the ground loss occurs in three stages, each represented by the following variables.
• Face Loss, Vf • Shield Loss, Vs • Tail Loss, Vt.
3.3.1 Face Loss
V
fThe volume of soil that intrudes into the tunnel face owing to pressure release at the face will be excavated eventually. Thus, there is a volume of lost ground equal to the amount of over-excavated material at the face called the face loss. Lee et al. (1992) presented a method to estimate the radial equivalent gap parameter, gf, (radial ground movement towards the lin-ing) of the longitudinal ground movement towards the tunnel face.
Based on Equation 3.1, the face loss, Vf can be specified as:
(3.2)
Where:
gf = equivalent gap at the crown of the face loss R = tunnel radius.
Lee et al. (1992) established a method to determine the gf value based on numerical mod-elling. The relationship they derived is:
29
Where:
k = the coefficient representing the resistance between the intruding soil and the TBM chamber skin
Ω = dimensionless axial displacement ahead of the tunnel face R = tunnel radius
P0 = total stress removal at the tunnel face
E = elastic modulus at the tunnel spring line (typically the undrained Young’s modulus in extension).
The kvariable. Peck (1969) indicated that the frictional forces between the skin of the shield and the surrounding soil, which are caused by the shoving action of the shield, can develop longitudinal tensile stresses that tend to cause failure and plastic flow into the tunnel face and the annular void between the tail skin. Lee et al. (1992) performed a series of 3D elastoplastic finite element method (FEM) modelling to establish the friction factor “k.” Their results are shown in Equation 3.3a.
0.7 stiff ground (qu >100 kPa or N>10)
k = 0.9 soft ground (qu = 25 to 100 kPa or N = 3 to10) (3.3a) 1.0 very soft ground (qu <25 or N<3).
Where:
N = SPT blow count for 300mm penetration
qu = unconfined compression strength = 2 x Cu (undrained shear strength).
Most tunnelling works are carried out through stiff material with qu being greater than 100 kPa (undrained shear strength greater than 50 kPa). Therefore, k=0.7 is an appropriate factor to assume for the ground loss estimation, as shown in Equation 3.3a.
The Ω variable. Determination of the factor Ω is based on extensive numerical analysis performed by Lee et al. (1992) for various stability ratios, NR, as shown in Eq. 3.3b.
1.12 for NR<3
Ω= 0.63NR-0.77 for 3<NR<5 (3.3b) 1.07NR-2.55 for NR>5.
Where:
Pi = TBM face pressure H = tunnel depth to spring line
Cu = undrained shear strength at the spring line.
The P0variable. The total stress removal at the tunnel face due to the excavation
can be estimated using Equation 3.3c.
P0 = k0 Pv+Pw -Pi (3.3c)
Where:
k0 = lateral earth pressure coefficient
P’v = effective ground pressure at the spring line
{
Pw = water pressure Pi = TBM face pressure.
In practice, few methods are available to estimate TBM face pressure. The two used com-monly are:
• Sliding model (Sternath & Bauman, 1997)
This method calculates the TBM face pressure by analysing a prismatic soil body act-ing above the crown of the tunnel face with an underlyact-ing wedge actact-ing in front of the TBM cutterhead
• Terzarghi's Silo Theory (Terzarghi, 1959)
This method estimates the effective soil column that imposes a load on the TBM as a result of soil arching effects.
In this study, Terzarghi's Silo Theory has been used to estimate TBM face pressure as shown in Appendix A1.
The actual mobilised TBM face pressure may be slightly different from theoretical predic-tions. The applied TBM face pressure at the site depends on two types of factors:
• Static: Soil type, soil stiffness/strength, tunnel configuration and groundwater table • Dynamic: Tunnel advance rate, mode of tunnelling (undrained or drained), and the
stand-up time of the soil.
In practice, only static factors are considered in theoretical earth pressure estimations (sliding model and Terzarghi's Silo Theory). Dynamic factors determine how much theoretical earth pressure is mobilised during tunnel excavation. Refer to Loganathan et al. (2005) for fur-ther information on dynamic factors.
3.3.2 Shield Loss
V
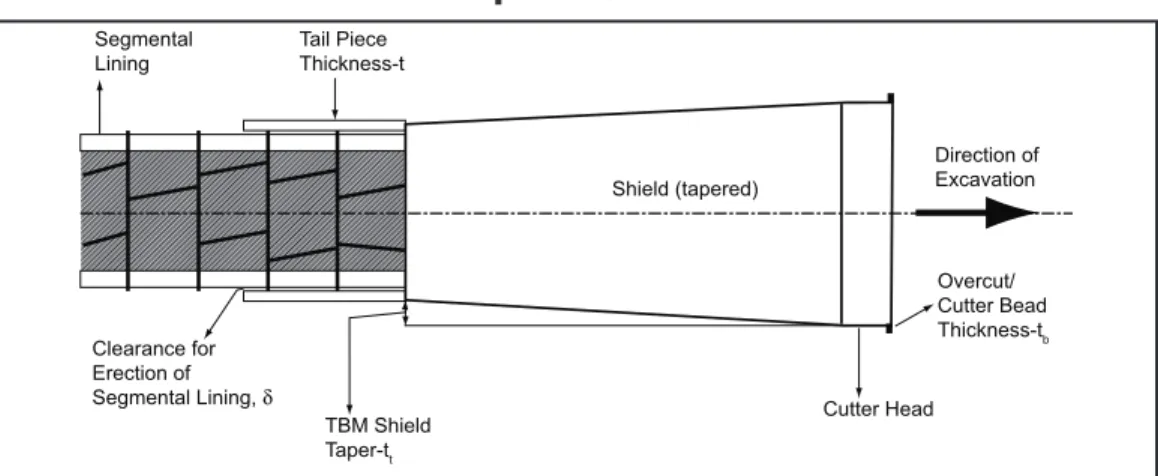
sThe TBM shield consists of the cutter head and the shield, with cutter heads being designed slightly larger than the shield to minimise friction between the TBM and the surround-ing ground. Beads are provided at the periphery of the cutter head for overcuttsurround-ing. In modern days, TBM shields are tapered, having a slightly smaller diameter at the tail, and some TBMs have both a cutter bead and tapered shield. In this study, the shield loss concept was derived for TBMs with both features, as illustrated in Figure 3.2 (not to scale).
31
Figure 3.2 Schematic of TBm Configuration with Cutter Bead and
Tapered Shield
The thickness of the cutter bead is shown as tb and the shield taper is shown as tt. These values are typically in the range of 5 to 15 mm (0.2 to 0.6 inch) for tb and 30 to 60 mm (1.2 to 2.4 inches) for tt, although they can vary depending on project requirements.
Generally, the gap created by over-excavation due to the cutter bead and tapered shield is filled with slurry or groundwater when the TBM face is pressurised. In stable ground, the TBM is operated without face pressure. To assess the worst case condition, however, it was assumed that the shield gap is unsupported until the lining is assembled and the tail void grouting is done through the tail skin.
A detailed study carried out by Bezuijen and Bakker (2007) indicated that the stress around the tunnel shield changes depends on the radial movement of the soil into the gap, as shown in Equation 3.4.
∆
σ=
2
∆
rrG
(3.4)Where:
G = shear modulus of the ground = E/[2(1+ν)] r = radius
Δr = radial movement.
The change in stress is expressed as: Δs = gH + Pw - Pi
Where Pi will be the applied TBM face pressure.
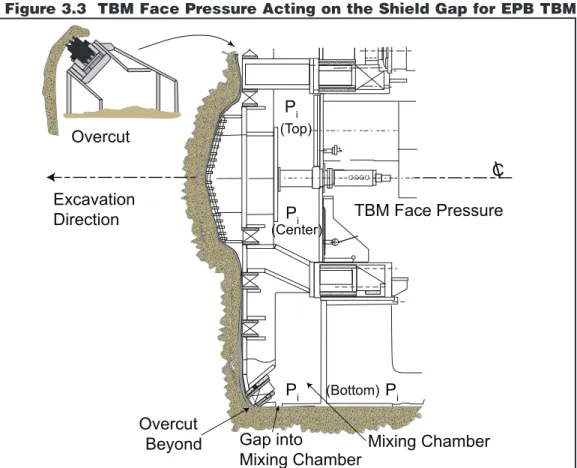
It is assumed that a fluid pressure equivalent to Pi will act on the shield gap due to the pressure connectivity between the mixing chamber and the shield gap via the gap into the mix-ing chamber. An appropriate Pi value should be used for the SPB slurry shield, the combina-tion mix shield machine (operates in either SPB or EPB mode) and the standard EPB machine.
Figure 3.3 shows how the TBM face pressure is transferred to the shield gap.
Segmental Lining Clearance for Erection of Segmental Lining, δ Tail Piece Thickness-t Direction of Excavation Shield (tapered) Overcut/ Cutter Bead Thickness-tb Cutter Head TBM Shield Taper-tt
Figure 3.3 TBm Face Pressure Acting on the Shield Gap for EPB TBm
Based on Equation 3.4, the ground movement into the shield gap can be derived as fol-lows:
(3.5)
Bezuijen and Bakker's (2007) detailed study also indicated that the tail void grout for slurry machines intrudes at least half way to the shield when the grout is pumped from the tail. It can be assumed, therefore, that shield loss will occur due to the radial ground movement to fill the gap created by the cutter bead and half of the shield taper.
Figure 3.4 shows the details of a typical EPB TBM that has a flap at the end of the tail shield to prevent grout flow forward along the shield gap. With EPB TBMs, the groundwater from the mixing chamber flows along the shield gap up to the end of the shield. To consider the worst case condition, however, it was assumed that the ground closure can happen for half the shield length, as for the slurry TBM.
The shield loss can be estimated using Equation 3.6.
(3.6)
TBM Face Pressure
P
i (Top)P
iP
iP
iExcavation
Direction
Overcut
C
\
Gap into
Mixing Chamber
Overcut
Beyond
Mixing Chamber
(Center)
33
If Ui > tt+tb, then gs = 0.5(tt+tb) If not, then gs = 0.5Ui.
Figure 3.4 Ground movement and Shield Gap Filling mechanism for
EPB TBm
3.3.3 Tail Loss
V
tA physical gap is created in the tail due to the thickness of the tail skin, t, and the provision of clearance, d, for the erection of the segmental lining. This gap will be grouted immediately after the erection of the lining to minimise the ground loss. In practice, however, there will be a time-dependent shrinkage in the grout-soil mix due to cement hydration. Lagerblad et al. (2010) reported that a volume change (shrinkage) of about 7 to 8 percent occurs for cement paste with a water/cement ratio of 0.4. Similarly, laboratory tests carried out on cement-soil mix by Ingles (1972) indicated about 7 to 10 percent reduction of thickness in the cement-soil mix samples. Therefore, if grouting is used to fill the physical gap, the value of the final tail loss gap is assumed to be about 7 to10 percent of the total tail gap. Considering the possible voids in the grout due to poor workmanship, it is assumed that about 10 percent shrinkage will occur in tunnelling practice.
The upper bound shrinkage percentage has been assumed to accommodate any possible volume reduction due to incomplete filling of the grout or pea gravel.
Wire Brush 2
Wire Brush 3
Grout
Flap
Grout
Tail
Skin
Tail Skin Sealing Grease
Segment
Wire Brush 1
Wire
Brush
Cutter
Bead
Excavation
Direction
u
i– Ground Movement (gap closure)
Grouting Mechanism
Slurry or
Water
Segment
TBMMixing
Chamber
cL cL Pι Pι tt + tbTail
Piece
Flap to Block
the Grout
Grout
Flow
u
iThe equivalent gap formed due to the shrinkage of the grout is expressed as: gt = 0.1(t+d).
The ground loss component due to grout shrinkage at the tail can be estimated as:
(3.7)
The total ground loss during TBM excavation can be derived by adding face loss and the radial losses.
A worksheet developed to assess the ground loss values based on the methodology described in this chapter is provided in Appendix A1.
4.0 GROUND MOVEMENTS
4.1 INTRODUCTION
Current “rules” to estimate ground settlement from tunnelling operations have been derived generally from empirical correlations between various parameters and the observed settlements in actual tunnels, as described previously (Sections 2.3.1 and 2.3.2). These rules account for only a few of the significant factors, and extrapolation to other cases is question-able. Hence, a method is needed to predict surface, subsurface and lateral ground ments so that designers can better assess the effects that tunnelling-induced ground move-ments will have on adjacent foundations and utilities.
A closed-form solution is presented in this chapter to predict these movements—surface, subsurface and lateral. This solution has been tested for its accuracy using case histories, centrifuge model test results, and FLAC3D numerical predictions. The formulas presented below are being used successfully by practicing engineers to predict tunnelling-induced ground movements.
Figure 4.1 shows the tunnelling-induced green field ground movements.
Figure 4.1 Tunnelling Induced Ground Movements - Green Field
37
4.0 GROUND MOVEMENTS
Uz (sub-surface) Uz (surface) Uχ (lateral) Tunnel Z Χ χ = ο4.2 CLOSED-FORM SOLUTIONS FOR GROUND MOVEMENTS
Only a few attempts have been made to develop analytical methods (closed-form solutions) that incorporate all factors contributing to ground deformation:
• Sagaseta (1987) presented closed-form solutions for determining the strain field in ini-tially isotropic and homogeneous incompressible ground due to near-surface ground loss caused by tunnel excavation.
• Verruijt and Booker (1996) presented an analytical solution for tunnels in a homoge-neous elastic half space, using an approximate method suggested by Sagaseta (1987) for the case of ground loss.
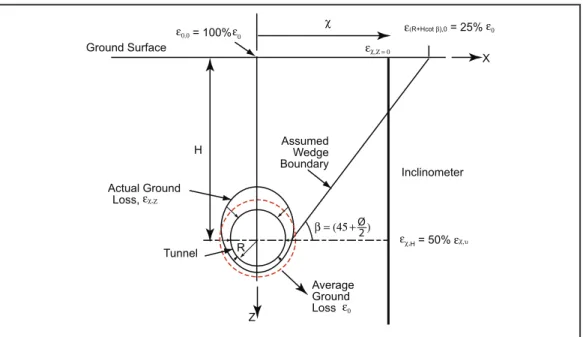
Loganathan and Poulos (1998) modified the Veruijt and Booker solution by incorporat-ing realistic ground loss boundary conditions that occur durincorporat-ing tunnel excavation, as shown in Figure 4.2. An oval shaped gap was introduced at the tunnel crown because ground loss occurs at various stages of excavation (as discussed in Chapter 3).
Figure 4.2 Ground Deformation Patterns and Ground Loss Boundary
Conditions
Based on the geometry of the oval-shaped gap formed around the tunnel, it is estimated that about 75 percent of vertical ground movement occurs within its upper annulus. Figure 4.2 shows the vertical ground movement influence zone where most of the soil displacement occurs. In sandy soil, the limit angle, β, is defined as (45° + φ/2), where φ= the angle of shearing resis-tance of the sand.
For soft to stiff clay, β may be assumed to be 45° based on the observations made by Cording and Hansmire (1975). That is, it is assumed that the ground movement occurs
predomi-Ground Surface Actual Ground Loss, Tunnel Z Average Ground Loss ε0 Assumed Wedge Boundary εχ,H = 50% εχ,υ ε0.0 = 100%ε0 ε(R+Hcot β),0 = 25% ε0 Inclinometer X εχ,Ζ = 0 χ β = (45+ 2 ) εχ,Ζ H R Ø
39 nantly within the (45° + φ/2) wedge between the ground surface and the tunnel. It is estimated that the magnitude of horizontal movement at the tunnel spring line is approximately half of the vertical movement at the tunnel crown (which causes 75 percent of the ground movement into the upper annulus of the oval shaped gap around the tunnel).
The closed-form solutions presented by Loganathan and Poulos are shown in Equations 4.1, 4.2 and 4.3. These solutions predict the tunnelling-induced ground movements reasonably well, as will be demonstrated below.
Surface Settlement (4.1) Subsurface Settlement (4.2) Lateral Deformation (4.3) Where:
Uz=0 = ground surface settlement Uz = subsurface settlement Ux= lateral soil movement R = tunnel radius
z = depth below ground surface H = depth of tunnel axis level ν = Poisson’s ratio of soil
ε0 = average ground loss ratio (not a displacement) x = lateral distance from tunnel centre line
β = Limit angle = 45 + φ/2.
These equations allow rapid estimation of ground deformation and require only an esti-mate of the Poisson's ratio (ν) of the soil. Poisson’s ratio indirectly represents the character-istics of coefficient of lateral earth pressure (k0) value of the ground. The k0 values should be estimated from the relationship shown in Equation 4.4.
(Bowles, 1996) (4.4)
Although Equations 4.1, 4.2 and 4.3 appear long, they are easy to work with using a simple worksheet (see Appendix A2). In addition, these closed-form solutions can be easily incorporated in numerical modelling programmes to impose ground movements external to the model soil-structure interaction problem to predict induced effects on adjacent piles.
The ground strength and stiffness and its elasto-plastic behaviour are considered in the estimation of the ground loss values. In most cases, tunnel excavation is carried out within the elastic strain range of the ground. The tunnelling-induced strain around the excavated face is controlled by applying the appropriate face pressure, installing the tunnel support system on time, or improving the ground around the tunnel.
The settlement trough width i is considered an important parameter for determining surface settlement using empirical methods. The relationship between the normalised parameters i/R and the H/2R parameters for the proposed analytical solution is shown in Equation 4.5:
(4.5)
A comparison of the maximum surface settlement and the surface settlement trough width
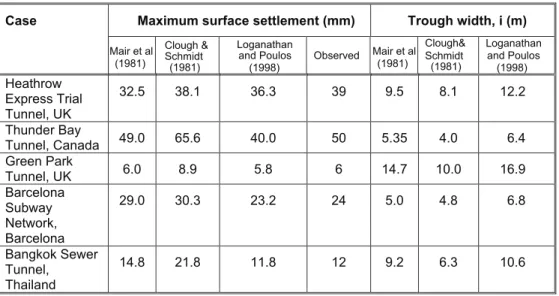
i parameter derived by using various methods and observed values for reported case histories (Loganathan and Poulos, 1998) is shown in Table 4.1. The table shows that the predictions made using Equation 4.5 are in good agreement with empirical predictions and field observa-tions. The case histories reported in Table 4.1 describe only the tunnels excavated through stiff to soft clayey soil.
Table 4.1 Comparison of Estimated and Observed Surface Settlement
Trough Parameters
The closed-form formulas (Equations 4.1, 4.2 and 4.3) have been tested and proven by various researchers and practicing engineers. For example, when Phienwej et al. (2007) used these equations to predict ground movements for the Bangkok Subway tunnel project, their results were very close to field measurements, as shown in Figure 4.3 (a) and (b).
40
Case Maximum surface settlement (mm) Trough width, i (m)
Mair et al (1981) Clough & Schmidt (1981) Loganathan and Poulos (1998) Observed Mair et al (1981) Clough& Schmidt (1981) Loganathan and Poulos (1998) Heathrow Express Trial Tunnel, UK 32.5 38.1 36.3 39 9.5 8.1 12.2 Thunder Bay Tunnel, Canada 49.0 65.6 40.0 50 5.35 4.0 6.4 Green Park Tunnel, UK 6.0 8.9 5.8 6 14.7 10.0 16.9 Barcelona Subway Network, Barcelona 29.0 30.3 23.2 24 5.0 4.8 6.8 Bangkok Sewer Tunnel, Thailand 14.8 21.8 11.8 12 9.2 6.3 10.6
41
Figure 4.3(a) Subsurface Settlement
Figure 4.3(b) Lateral Deformation
Soft Clay Soft Clay Stiff Clay Dense Sand 3.42m -15m -17m -23m Stiff Clay Dense Sand Measurements Loganathan & Poulos (1998) 20 0 0 -5 -10 -15 -20 -25 -30 -35 -20 -40 -60 20 0 -20 -40 -60 D ep th (m ) Subsurface Settlement (mm) Subsurface Settlement
Instrument 23-IEX-001 (Thiam Ruam Mit - Prachart)
NB SB
Spacing = 15.65 m Tunnel Depth = 19.50 m
Monitoring
Loganathan and Poulos (1998) Verruijt & Booker (1996)
0 -5 50 -10 -15 -20 -25 -30 -35 40 30 20 10 0 -10 Soft Clay Stif f Clay Dense Sand 5.71 m
Inclinometer No. 30-IE-001 (Mo Chit - Kamphaeng Phet)
Elevation (m)