Surface Flow Visualization of the
High-Lift Common Research Model
Mehti Koklu
*, John C. Lin
†, Judith A. Hannon
‡, Latunia P. Melton
§,
Marlyn Y. Andino
**, Keith B. Paschal
††, and Veer N. Vatsa
‡‡NASA Langley Research Center, Hampton, VA, 23681, USA
Abstract
A 10% scale version of the High-Lift Common Research Model (CRM-HL) was tested in the NASA Langley 14- by 22-Foot Subsonic Tunnel (14x22) in support of the NASA Advanced Air Transport Technology (AATT) Project. The CRM-HL experiment included various configurations such as conventional and simple-hinged flaps, with and without engine nacelle/pylon, with and without nacelle chine, different Active Flow Control (AFC) methods (sweeping jets, alternating pulsed jets, and preconditioned boundary layer blowing), and their various parameters. This particular study is focused on the surface flow visualization of the conventional CRM-HL model at landing configuration. The conventional CRM-HL model with the single-slotted Fowler flap system serves as a baseline for the AFC-enabled simplified high-lift configuration as well as a high-lift technology development platform due to its publicly open geometry. Surface flow visualizations were performed using fluorescent minitufts, which were found to be nonintrusive to the aerodynamic performance. Tuft flow visualizations are supplemented with the relevant pressure and force measurements in order to understand the flow characteristics developed on the conventional CRM-HL model. In addition, three dimensional, unsteady, compressible Computational Fluid Dynamic (CFD) simulations were performed for selective cases. The surface streamlines and transverse velocity fluctuations obtained by the CFD simulations are qualitatively compared to the tuft direction and tuft unsteadiness, respectively. Force measurements of the CRM-HL model show performance degradation at higher angles of attack. Surface flow visualizations revealed the performance loss due to the nacelle/pylon wake that grows with angle of attack and eventually promotes flow separation over the inboard wing. This performance loss was successfully recovered by placing a chine on the engine nacelle.
Nomenclature
α = angle of attack CD = drag coefficient Cf = skin friction coefficient CL = lift coefficient
CLmax = maximum lift coefficient Cp = pressure coefficient M∞ = freestream Mach number Uʹn = transverse fluctuating velocity
u’, v’, w’ = standard deviation of velocities along the x, y, z coordinates, respectively. φ,ψ, θ = local flow direction angles between the x, y, z coordinates, respectively x, y, z = longitudinal, lateral, and normal axes, respectively.
* Research Scientist, Flow Physics and Control Branch, MS 170
† Senior Research Scientist, Flow Physics and Control Branch, MS 170, AIAA Associate Fellow ‡ Research Scientist, Flow Physics and Control Branch, MS 170
§ Senior Research Scientist, Flow Physics and Control Branch, MS 170, AIAA Associate Fellow ** Research Scientist, Flow Physics and Control Branch, MS 170, AIAA Senior Member
†† Research Scientist, Flow Physics and Control Branch, MS 170
‡‡ Senior Research Scientist, Computation AeroSciences Branch, MS 128, AIAA Associate Fellow
I.
Introduction
ASA Advanced Air Transport Technology (AATT) Project develops technologies and concepts for improved energy efficiency and environmental compatibility. One of the technical challenges of the NASA AATT Project is to enable optimal wing configurations for subsonic fixed wing transport aircraft by developing various technologies including light weight and mechanically simple high-lift systems. High-lift systems are a critical part of an aircraft wing. They enable safe operation of a transport aircraft at low speeds during takeoff and landing operations. Although high-lift systems are only used for a short period of time during the flight, the cost (and safety) of the aircraft strongly depends on the high-lift systems. As noted by Van Dam1, this is because, “the high-lift systems have a high part count, are heavy and complex, maintenance intensive and time consuming to design and test”. A typical conventional high-lift (CHL) system2 and the associated complex subsystems3 for its operation are shown in Fig. 1a and Fig. 1b, respectively. In addition to their complexity and weight, these subsystems often protrude into the flow (Fig. 1a) and result in parasitic drag during cruise. Therefore, any simplification in high-lift systems could produce significant payoffs on the overall performance and cost of an aircraft.
Within the framework of the efficiency and environmental compatibility goals, the NASA AATT project explores improved high-lift concepts that have less part counts, are less complex, are lighter, and more importantly provide drag reduction without sacrificing the aerodynamic performance during takeoff and landing operations. One possible option is to use simplified high-lift (SHL) systems with simple-hinged flaps4-6 (Fig. 2). The simple hinged flaps are the simplest and the most basic flaps for high-lift systems and satisfy most of the “improved high-lift concept” requirements (i.e., lighter, less part count, less complex, reduced drag) with the exception of maintaining the aerodynamic performance. This is because the simple-hinged flaps are vulnerable to flow separation that is detrimental to the aerodynamic performance during takeoff and landing operations.5-6 The SHL systems are capable of attaining the required aerodynamic performance only if the flow separation behind the flap is controlled, for example, using an Active Flow Control (AFC) system. A recent system study showed that if an AFC-enabled SHL system could achieve similar lift performance to that of a CHL system (i.e., Fowler flap system), then the benefits of such a system are: (1) estimated 750 lbs reduction in operating empty weight, (2) estimated cruise drag reduction of 3.3 counts (through elimination of the external fairings for the Fowler flaps), and (3) estimated fuel savings of about 400 gals/flight for a modern civil transport aircraft.7-8
In order to demonstrate the feasibility of the AFC-enabled SHL systems, a three-dimensional model, which is representative of a modern civil transport aircraft, was designed for wind tunnel testing. Although the initial motivation to design and build a relevant aircraft model was for AFC research, there were also strong desires for an “open” lift geometry from government, industry, and academia for R&D efforts related to noise reduction, high-lift aerodynamics/flow physics, and CFD development/validation.9 For this reason, a 10%-scale semispan high-lift version of the Common Research Model (CRM-HL) was built.10 The CRM-HL configuration includes both the conventional and AFC-enabled simplified high-lift systems. More importantly, the CRM-HL geometry is open to the public, which can serve as a high-lift technology development platform. The performance levels achieved by the geometry can also serve as a benchmark for a conventional high-lift system.10
Although the main objective of the CRM-HL test was to explore the AFC concepts and their applicability to the SHL configuration, this paper investigates the CHL system, which serves as the baseline for the AFC-enabled SHL configuration. More specifically, this paper is focused on the surface flow visualization in order to understand the flow characteristics developed on the conventional CRM-HL model.
II.
Experimental Setup
Experimental setup including the wind tunnel, model, test conditions, actuators, etc. was reported elsewhere9-13 so only a brief summary will be given for completeness. The wind tunnel test was performed at the NASA Langley Research Center 14- by 22-Foot Subsonic Tunnel (14x22). The 14x22 tunnel is an atmospheric, closed return wind tunnel with a 14.5-ft high, 21.75-ft wide, and 50-ft long test section (Fig. 3).13 The wind tunnel tests were performed for landing configurations at a nominal freestream Mach number (M∞) of 0.2 and a corresponding unit Reynolds number of 1.4 ×10⁶ per foot. The experimental measurements included forces and moments, surface static pressures, surface unsteady pressures, model deflections, and surface flow visualization.
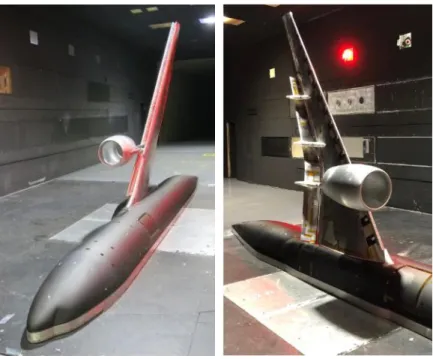
The model tested in this study is the 10%-scale, high-lift version of the NASA Common Research Model.14 Two photos of the CRM-HL in the 14x22 wind tunnel are shown in Fig. 4. The details of the CRM-HL model can be found in the papers by Lacy et al.10 and Lin et al.9 The geometry of the CRM-HL model was also selected as one of the cases for the AIAA High-Lift Prediction Workshop and it is available on the workshop website.15 The 9.64 ft. high semispan model was installed vertically on the turntable at the tunnel floor (Figs. 4-5). The length of the fuselage is 20.59 ft. (Fig. 5). Key components of the CRM-HL model (such as flaps, slats, nacelle/pylon, AFC systems) are all
N
modular and replaceable. The modular design enabled the model to be switched between different configurations while keeping the other components the same. Primarily the landing configuration was tested, where the slat deflection angle was 30° and remained the same for both the CHL and AFC-enabled SHL configurations. The flaps were deflected to 37° in the conventional CRM-HL case whereas the inboard and outboard flaps were deflected to 50° and 55° in AFC-SHL configuration, respectively, in order to recover the lift performance. Two representative airfoil-cross sections of the high-lift configurations (i.e., CHL and SHL) are illustrated in Fig. 5. This figure also shows the locations of the static pressure ports on the model as depicted by the red dots. There are approximately 900 pressure taps mostly populated in the streamwise arrays at eight spanwise stations (rows).
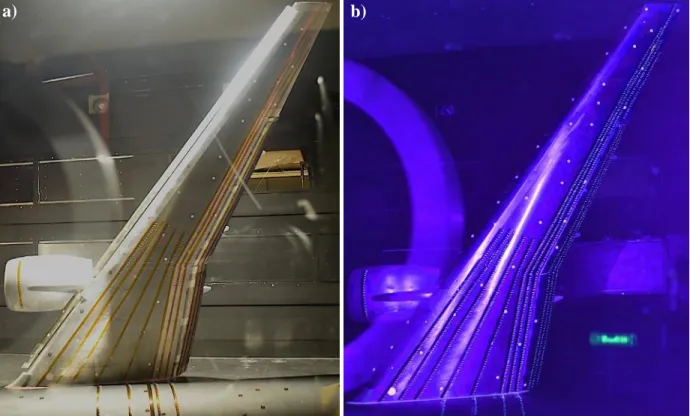
Surface flow visualizations were performed using fluorescent minitufts. Minitufts were fabricated using general purpose thin sewing thread. The tufts were prepared on a tape strip, which was then applied on the model surface (Fig. 6). The sewing thread includes polyester material; therefore, it glows under UV light (Fig. 6b). A long exposure time was used in order to see the time-averaged flow patterns. There were more than 1600 individual tufts applied on the model surface. The tufts were uniform in length (approximately 0.6 in. long). The spacing of the tufts was approximately 0.6 in. for an improved spatial resolution. The inboard region of the main wing was fully covered by eight arrays of tufts (Fig. 6). These tuft arrays extended slightly over the yehudi break to capture the effect of flow structures shedding from the engine nacelle/pylon. Most of the main wing in the outboard region was not covered to save tunnel time. However, about a 4 – 5 in. wide region upstream of flap (i.e., spoiler section) in the outboard region was covered by three arrays of tufts to detect any flow separation/unsteadiness (e.g., due to the slat brackets). These three arrays of tufts extended to the wing tip. All of the flap upper surfaces (inboard and outboard) were covered by three arrays of tufts. There were four arrays of tufts applied on the fuselage starting from the midsection of the inboard wing extending to the flap shoulder. These arrays were to see any possible flow separation/unsteadiness or flow direction change on the fuselage. Finally, one array of tufts was applied on the engine nacelle near the leading edge to detect any flow separation on the nacelle at higher angles of attack.
Numerical simulations were also performed in order to complement the tuft flow visualizations and to aid in better understanding the flow patterns. A commercial software package based on Lattice Boltzmann Method (LBM)16 was used to simulate the three-dimensional, compressible, unsteady flow over the CRM-HL model. A modified k−ϵ turbulence model, which involves a very large eddy simulation approach, was used to resolve the large energy containing scales. In addition, appropriate wall functions17 were utilized to capture the boundary layer behavior without excessive grid resolution near the solid walls. The LBM equations were solved on embedded Cartesian meshes (voxels), which were successively refined near the high gradient regions using variable resolutions. The numerical model used an explicit time advancement scheme that allowed massively parallel simulations. The computational modeling included every detail of the three-dimensional CRM-HL geometry, comprising of the main wing, fuselage, nacelle, pylon, slat, flap, leading edge strake, flap fairings, and slat brackets. Computational Fluid Dynamic (CFD) simulations were performed for in-tunnel mode (with tunnel walls) to facilitate a direct comparison with the wind tunnel results. The details of the computational setup and the simulation method can be found in Refs. [18-19].
Although the CFD simulations generated a lot of information, they are used qualitatively to better understand the surface flow but not necessarily for CFD code validation purposes. The quantitative comparison of the numerical results with the experimental data will be the subject of another study. In the numerical simulations, we focused on the surface flow characteristics and quantities to better compare them to the tuft flow visualization. The surface streamlines and skin friction coefficient (Cf) are commonly used for surface flow visualization in numerical simulations. In addition to these quantities, we used near surface transverse fluctuating velocity, Uʹn, which is a function of the standard deviations of the velocities. The motivation behind using this term is to represent the flow unsteadiness observed by the tufts. Since the model and hence the flow is three dimensional, the transverse fluctuating velocity is not necessarily the fluctuating velocity in the wing-span direction; rather, it is the fluctuating velocity component that is normal, or transverse, to the local flow direction. For a three dimensional flow, the transverse fluctuating velocity component is:
𝑈𝑛′ = 𝑢′|sin(𝜑)| + 𝑣′|sin(𝜓)| + 𝑤′|sin(𝜃)|
where u’, v’, w’ are the fluctuating components of the velocities and φ,ψ, θ are the local flow angles in x, y, z directions, respectively.
III.
Results
The main focus of this study is to investigate the surface flow characteristics of the conventional CRM-HL model with the engine nacelle and pylon on at landing configuration conditions where the slat and flap deflection angles were 30° and 37°, respectively. In all of the results, the freestream Mach number was 0.2, which corresponded to a unit
Reynolds number of 1.4x10⁶ per foot. Surface flow visualizations were performed using minitufts. Although the flow visualization and experimental measurements covered the entire angle of attack () range (from = -4° to = 19°), select angle of attack cases, = 0°, 8°, 12°, 16°, 18°, are presented in this study for brevity. These representative cases are chosen to capture the surface flow topology for the entire range. Tuft flow visualizations were supplemented with the relevant force and pressure measurement data in order to understand how the surface flow characteristics develop on the model surface. Representative pressure (Cp) distributions are given only at the y = 27.75 in. spanwise station (see Fig. 5). Both the main wing and the flap surfaces are covered with tufts around this spanwise location. In addition, the CFD simulations indicated that the wake of the nacelle/pylon spreads on the midspan of the inboard region; and the pressure taps along the y = 27.75 in. are the closest to capture the effect of the wake.
A. Baseline Flow over the CRM-HL Model
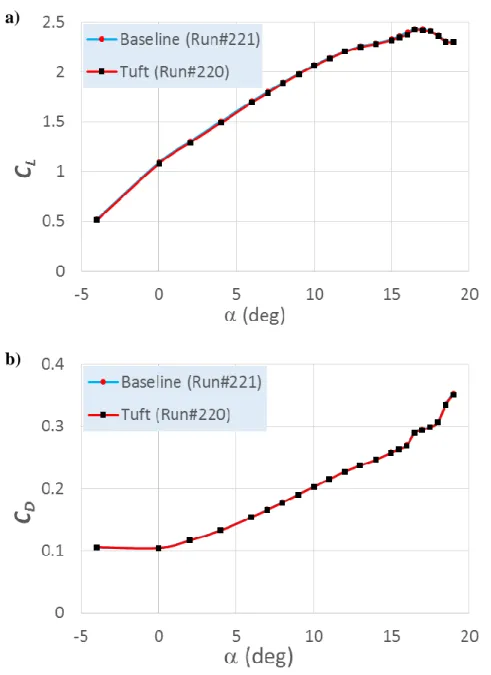
Before presenting the tuft flow visualizations of the CRM-HL model, the effect of tufts on the aerodynamic forces is presented first. It is known that the tufts can alter the aerodynamic forces on a model depending on the tuft material, number of tufts, and how they are applied on a surface.20 This can be detected in the lift curve where the tufts usually lower the lift coefficient (CL) and this intrusiveness increases with angle of attack. Crowder proposed fluorescent minitufts to minimize their intrusiveness by reducing the tuft size while keeping visibility.21 Negligible effects of the minitufts on the aerodynamic forces was reported in a range of low and high speed wind tunnel tests.21-23 The fluorescent minituft technique allows thousands of tufts to be applied on a model surface for improved spatial resolution with negligible intrusiveness. Figure 7a compares the lift coefficient (CL) values of the CRM-HL model with and without the tufts on the model. As shown in this figure, the effect of tufts on the lift coefficient is negligible. The error due to the existence of tufts is less than 1% for the entire range with the exception of the prestall condition, where it is %1 (CL = 0.026 at = 16°). The effect of tufts on the drag coefficient (CD) is even less than that of the lift coefficient (Fig. 7b). The difference due to the tufts in the drag coefficient is less than 0.5% for the entire range with the exception of the prestall condition where it is 0.6% at = 16°.
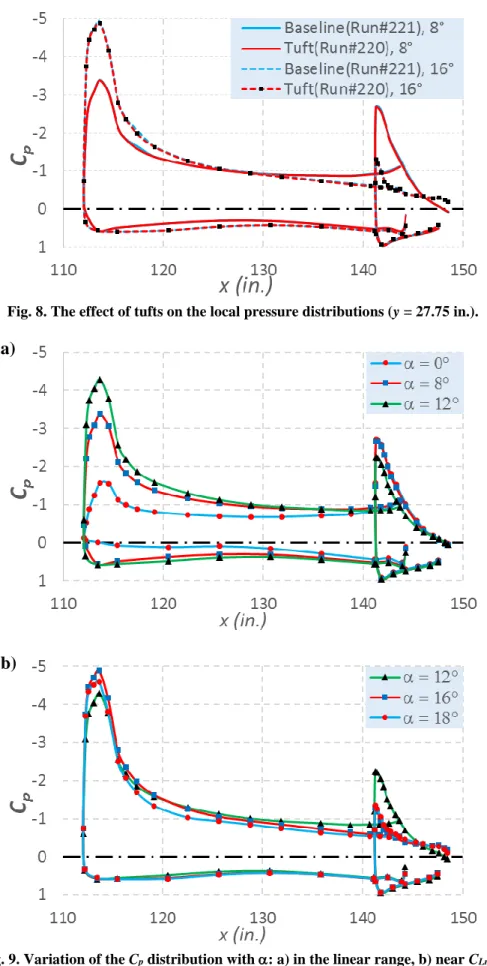
A typical Cp distribution is given in Fig. 8 to see the effect of tufts on the local pressure distribution. For this particular case, the angles of attack, , are 8° and 16°. This figure shows the Cp distribution at the y = 27.75 in. spanwise station in the inboard region where the main wing and the flaps were covered with tufts. Note that in this figure (and for the rest of the paper) the flap-pressure tap locations in the streamwise direction are for the stowed coordinates. Since no tufts were applied on the slat, it is not included in the Cp distribution. As shown in the figure, the Cp distributions with and without tufts match well for most of the regions. We see slight deviations near x = 117 in. and at the trailing edge of the main wing where the tufts resulted in lower suction pressures. Note that x = 117 in. is the location of the most forward tuft array at this particular spanwise station (y = 27.75 in.).
Before delving into the surface flow visualizations, we present the variation of Cp distributions at the y = 27.75 in. station with respect to the angle of attack (i.e., = 0°, 8°, 12°, 16°, 18°). Again, the Cp distributions over the slat are omitted. The Cp distributions are divided into two; Fig. 9a shows the Cp distributions in the linear region of the CL vs.
curve (in Fig. 7a) and Fig. 9b shows the Cp distributions near CLmax. As expected, we see higher suction pressures on the main wing as the angle of attack increases in the linear region. The Cp distributions on the flap = 0° and = 8° are similar; however, it changes for the = 12° case. This might be due to the competing effects of the slotted jet versus the adverse pressure gradient (APG) on the flap as the angle of attack increases. The reduction in the suction Cp distribution on the flap indicates that the impact of the adverse pressure gradient is more than any offset due to the higher momentum jet from the slot. Near CLmax, we see higher suction pressures especially at the leading edge of the main wing. However, the suction pressures slightly reduce toward the wing’s trailing edge with increasing angle of attack. Over the flap surface, the gradually increasing APG due to the increasing results in even lower suction pressures and possibly flow separation (Fig. 9b).
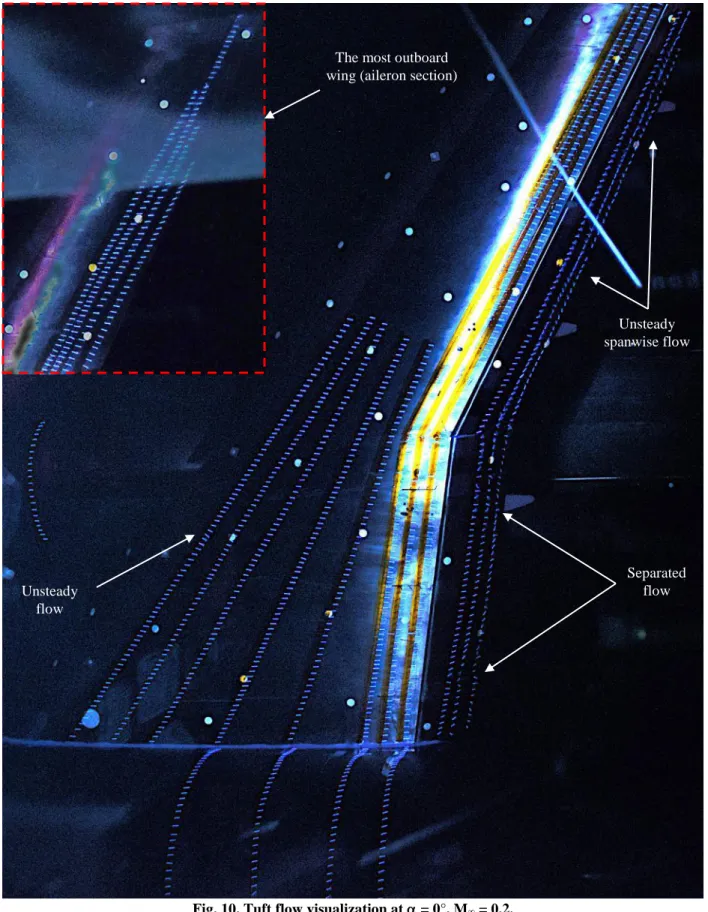
Figure 10 presents the surface flow visualization on the upper surface of the model at = 0°. In the surface flow visualization images, the most outboard section of the wing, just above the outboard flap, (referred to as “aileron section” hereafter) was cut and added as an inset on the top left corner of the figures. As expected, the flow on the main wing, aileron section, fuselage, and nacelle are well behaved and fully attached. The flow unsteadiness downstream of the nacelle/pylon on the main wing (3-4 tuft spacings wide) is possibly due to the wake generated from the edge of the slat-cut back (i.e., slatless region downstream of wing/pylon juncture). This flow unsteadiness is weak and diffuses near the third tuft array. Different flow structures appear on the flap section. There exists flow separation near the juncture between the fuselage and flap. This juncture vortex appears to extend to the flap mid-span. This is possibly because the juncture vortex also interacts with the wake shedding from the leading edge strake on the lower surface. The flow remains attached between the separated flow region and the inboard flap fairing. This is the location where the Cp distribution in Fig. 9a displayed normal pressure recovery. The flow appears to be highly unsteady and
separated upstream of the inboard flap fairing. The main reason for the unsteady/separated flow at this region could be the blockage of the slot by the flap fairing on the lower side of the wing. In addition to causing parasitic drag during the cruise conditions, the flap fairing acts as a blockage resulting in flow separation and hence performance losses during high-lift operations. The separated flow region extends to the yehudi break. Beyond the yehudi break and across the outboard flap, the flow is steady but displays a strong spanwise component due to the change in the sweep angle in the outboard region. The flow topology between the two outboard fairings is similar and dominated by spanwise unsteady flow. Tuft flow visualizations show separated flow regions upstream of the flap fairings (tufts pointing slightly upstream) and unsteady slot jet (see first tuft array over the flap).
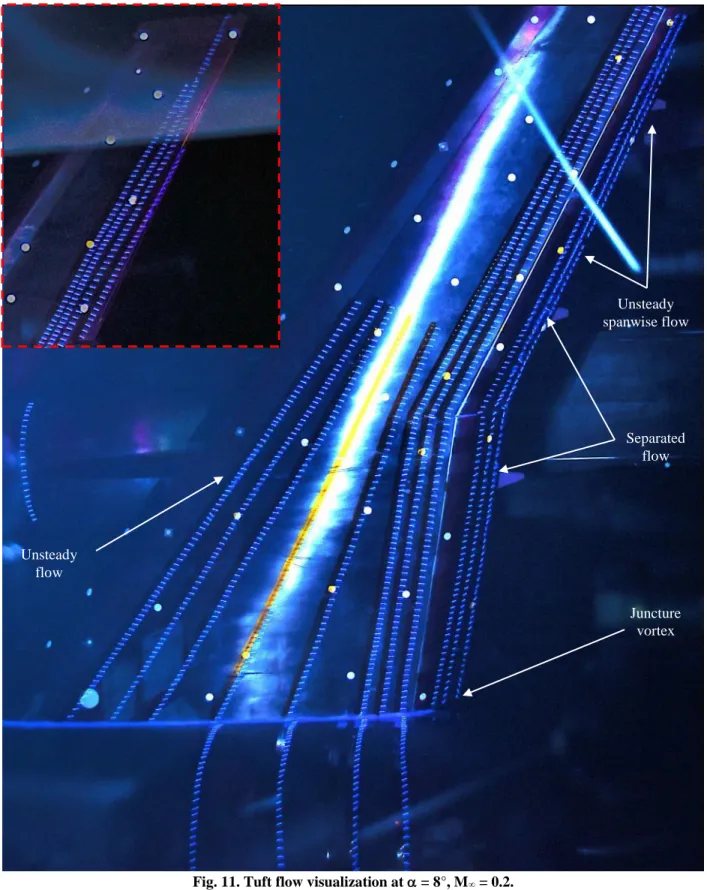
Increasing the angle of attack to the nominal approaching angle ( = 8°) made some changes in the flow topology (Fig. 11). Again, the flow on the main wing, aileron section, fuselage, and nacelle remains attached. At this angle of attack, the stagnation point moves downstream on the lower surface of the wing (not shown here); therefore, some of the wake generated by the nacelle/pylon moves on the upper surface, affecting a wider area (about 12-15 tuft spacing wide). The generated wake is strong enough to survive all the way to the flap. The flow over most of the inboard flap appears to be attached with the exception of a small juncture vortex between the flap and fuselage and the local separated flow upstream of the inboard flap fairing. Flow patterns on the outboard flap are similar to that of the = 0° case, having strong unsteady spanwise flow. One slight difference is between the yehudi break and the nearest outboard flap fairing, where the = 0° case had steadier flow compared to the = 8° case.
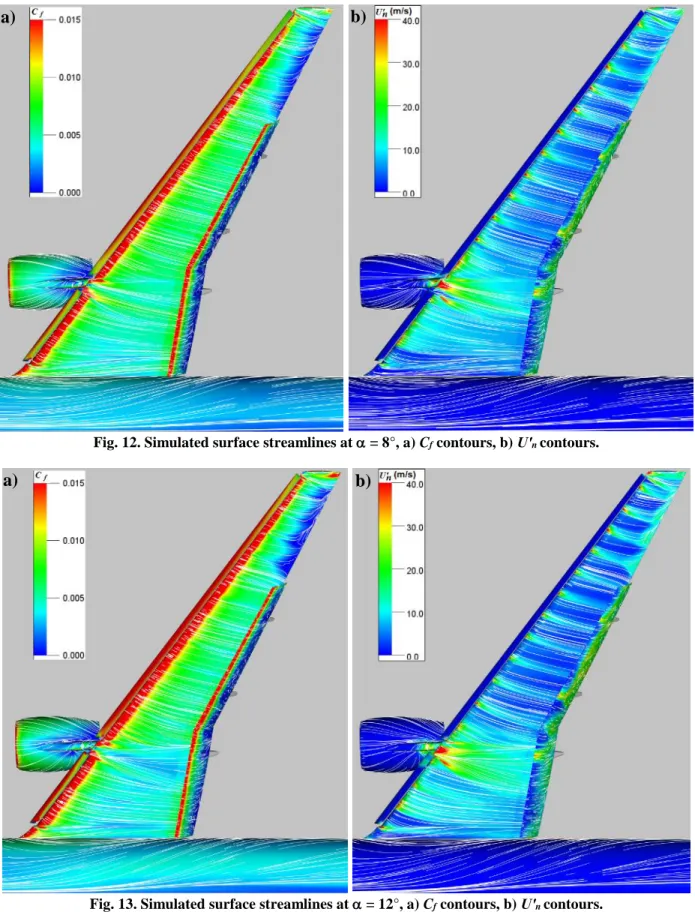
Figure 12 illustrates the surface flow visualization predicted by the numerical simulations. In these figures, the surface streamlines are superpositioned on the skin friction coefficient (Cf) (Fig. 12a) and the transverse velocity fluctuation (Uʹn) contours (Fig. 12b). High skin friction values at the leading edges of the different elements (main wing, slat, flap, and nacelle) decrease downstream as the flow decelerates due to the APG. Different from the tuft visualization, the CFD results indicate spanwise flow near the trailing edge of the inboard flap. Over the aileron section, lower skin friction values indicate boundary layer growth but the local flow appears to be attached. Surface streamlines on the inboard of the main wing demonstrate that the nacelle/pylon wake convects in two streams. The first stream, which originates from the outboard side of the pylon, travels toward the inboard flap fairing; whereas, the second stream, which originates from the inboard side of the pylon, travels toward the midsection of the inboard wing. These streams were not observed in the tuft visualizations possibly because the generated wake is weak and insufficient to move the tufts. The generated nacelle/pylon wake is small and is confined over the slat-cut back region between the inboard and outboard slats. The wake generated by the flap fairings as well as the slat brackets are easily identified in the transverse velocity fluctuation (Uʹn) contours. The higher Uʹn values upstream of the flap fairings as well as over the outboard flap compares well with the flow unsteadiness observed in the tufts in Fig. 11. The slat bracket wake appears to be gradually diffused in most of the regions with the exception of the aileron section. In this region, the slat bracket wakes first diffuse but then reamplify near the trailing edge.
As expected, increasing the angle of attack to = 12° increases the nacelle/pylon wake (Fig. 13). This is seen by the lower Cf values downstream of the pylon compared to the = 8° case. In addition, the nacelle/pylon wake spills over the slat (see Uʹn values over the slat in Fig. 13b and compare to Fig. 12b). The effect of the slat bracket wake is more distinct in the Cf contours as the wake causes a thicker boundary layer on the aileron section. Surface streamlines indicate spanwise flow near the trailing edges. At these regions, the CFD predicted more amplification in the transverse velocity fluctuations compared to the = 8° case. As the angle of attack increases from 8° to 12°, the flow over the fuselage turns slightly more toward the wing.
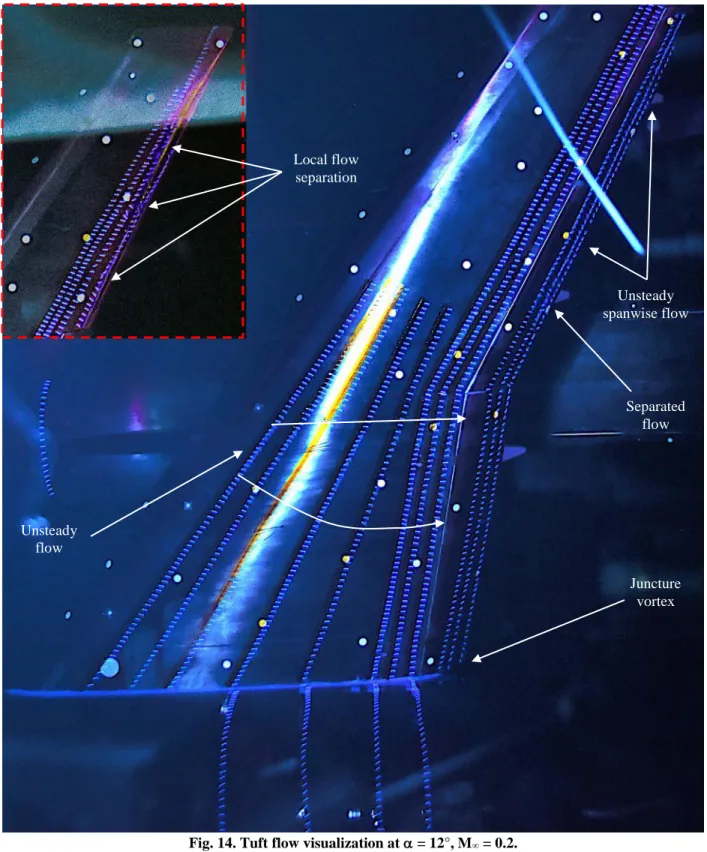
Figure 14 shows the surface tuft flow visualization when the angle of attack is 12°. This case is important because the slope of the lift curve in Fig. 7a starts to change at = 12°. The unsteady flow region becomes larger due to stronger wakes generated by the nacelle/pylon as indicated by the unsteady tufts. In addition, two streams of unsteady flow that were predicted by CFD earlier in Figs. 12-13 appear in the tuft visualization at this angle of attack. These streams indicate that the nacelle/pylon wake convects toward the inboard wing thereby most detrimental to the load distribution over the inboard wing. There is no noticeable difference in the surface flow over the main wing, fuselage, and nacelle as they remain attached. Flow over the entire inboard flap appears to be cleaner (i.e., attached). This is consistent with the higher Cf and lower Uʹn values predicted by CFD in Figs. 12-13. The separated flow on the inboard flap, which was present in the = 0° and = 8° cases, is eliminated by the stronger jet from the slot. Strong unsteady spanwise flow over the outboard flap region remains the same as the previous angle of attack cases.
Different from the previous two angle of attack cases ( = 0° and = 8°), the surface tuft flow visualization shows pockets of local flow separation, downstream of the slat brackets over the aileron section. These pockets of local flow separation are consistent with the high velocity fluctuations in numerical simulations (Fig. 13b). Interestingly, the tufts very close to the slat brackets (e.g., over the inboard wing) do not show any sign of flow unsteadiness due to the slat bracket wake. In addition, the flow unsteadiness on the aileron section appears only at the two downstream arrays
but not in the two upstream arrays. This is consistent with the reamplification of the velocity fluctuations predicted by CFD in Fig. 13b. This suggests that the local separated flow regions might not be solely due to the wake of the slat bracket as they did not appear upstream. A similar flow phenomenon was observed in the surface oil flow visualization over a Stratford ramp24 where the wake generated by the vortex generators formed local flow separation over the adverse pressure gradient region without disturbing the flow upstream. Assuming a similar analogy, the wake of the slat brackets is not strong enough to move the tufts but thickens the local boundary layer. While these wakes travel downstream, the thickened boundary layer interacts with the APG and causes these pockets of local separated flow regions. These local flow separation regions only appear downstream of the slat bracket wakes where the APG is strong enough to cause flow separation. Therefore, these local separated flow regions occur neither between two adjacent brackets (no wake) nor on the main wing (not strong enough APG).
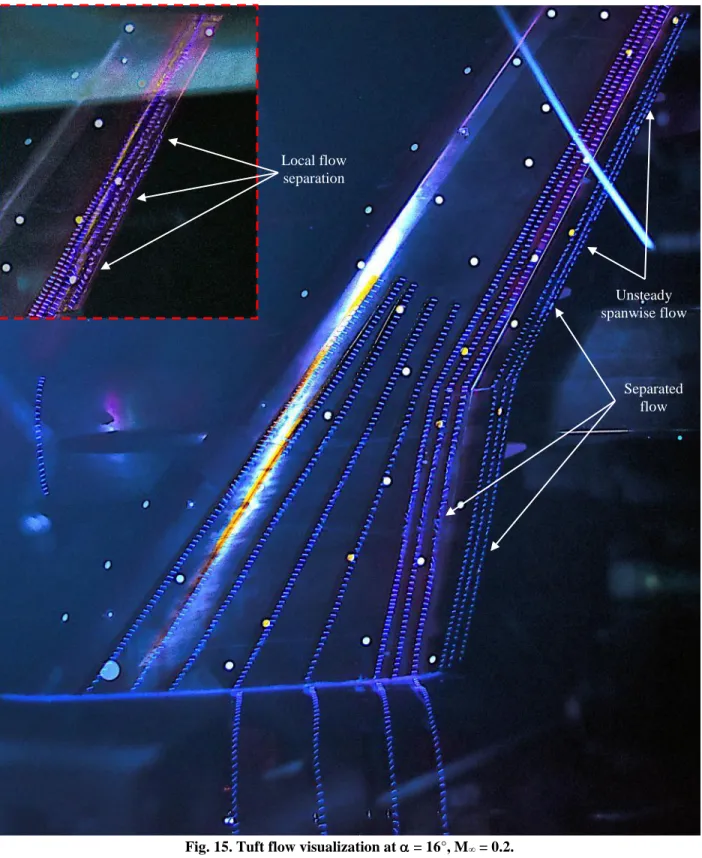
At prestall condition (= 16°), the effect of nacelle/pylon wake is more pronounced (Fig. 15). The wake causes more unsteady flow, affecting a larger area on the inboard main wing. As a result, flow separates near the trailing edge of the main wing, which explains the performance degradation in the lift curve in Fig. 7a. Flow over the nacelle and fuselage remains attached; however, more flow is directed towards the flaps over the fuselage. On the inboard flap, the tufts appear smaller because of the reduced camera viewing angle as the angle of attack increases. Nevertheless, the wake of the separated flow over the main wing spills over the inboard flap, triggering unsteady flow and possibly flow separation near the trailing edge of the inboard flap. This is also consistent with the Cp distributions given in Fig. 9b that showed a substantial drop in the suction pressures over the flap compared to the lower angle of attack cases. No noticeable difference exists in the outboard section; the flow on the main wing remains attached; whereas the flow on the outboard flap is unsteady and spanwise dominant. Local separated flow regions are also seen in the aileron section of the flap similar to the = 12° case. However, at this angle of attack (16°), these local separated flow regions move upstream, this is consistent with explanations given in the previous cases. As expected, the APG is stronger for the higher angle of attack; therefore, the local flow separates earlier for = 16° compared to the = 12° case.
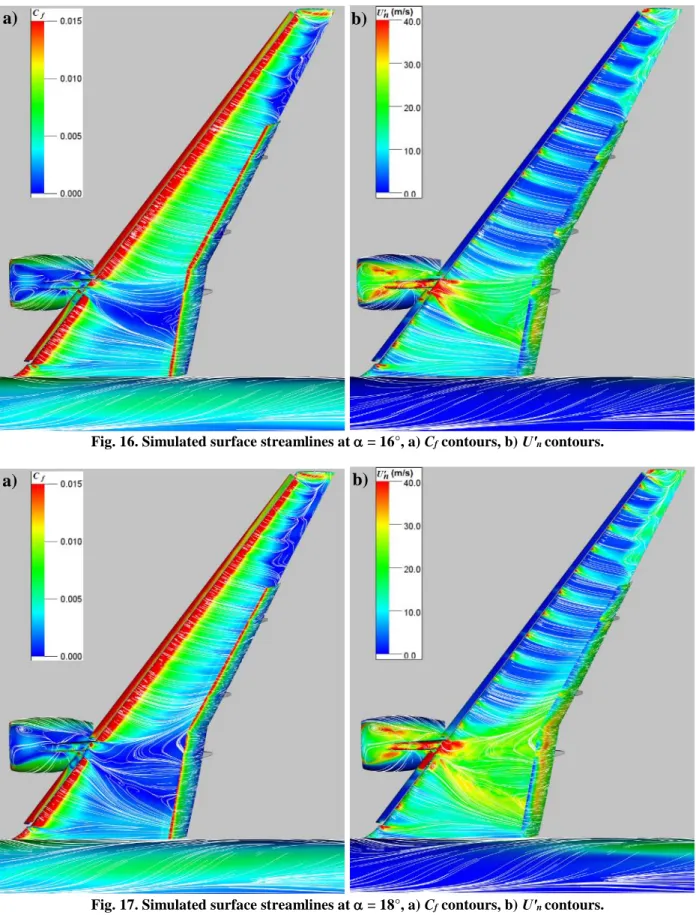
Numerical simulations also predict the larger and stronger nacelle/pylon wake affecting the inboard region for = 16° (Fig. 16). The separated flow region qualitatively agrees with the tuft flow visualization but appears to be smaller than the experiment. The low Cf (and high Uʹn) regions become larger and move upstream as the adverse pressure gradient becomes greater with increasing , comparable to the larger local separated flow regions observed in the tuft visualization. The effect of the nacelle/pylon wake on the inboard flap is shown as higher velocity fluctuations downstream of the wake (Fig. 16b). While the tuft flow visualizations showed attached flow over the nacelle, the CFD simulations predicted flow separation upstream of the pylon. In contrast, while the CFD predicted attached flow over the inboard flap, the tuft visualization (Fig.15) showed separated flow. The trend in CFD predictions are the same for the post-stall conditions ( = 18°, Fig. 17). We observe a larger and stronger nacelle/pylon wake affecting most of the inboard region. As the wake becomes larger, the attached flow region near the fuselage shrinks. The larger wake was shown to spill more on the outboard side of the inboard slat. The stronger wake also affects the flow over the inboard flap (higher Uʹn values in Fig.17b); however, it appears to be attached (see straight streamlines in Fig. 17a). The size of the separated flow regions over the inboard wing, nacelle, and the aileron section increases.
Figure 18 displays the tuft flow visualization for the post-stall conditions ( = 18°) in the experiment. As shown, the developing flow structures at the lower angles of attack, have become disruptive especially for the inboard region. The nacelle/pylon wake covers almost the entire region between the fuselage and pylon. Flow separation triggered by this wake extends to the leading edge of the main wing. A large juncture vortex appears near the trailing edge of the main wing that affects both the main wing and the fuselage. This juncture vortex as well as the tuft unsteadiness shown on the fuselage was not accurately predicted by the CFD simulations (Fig. 17). Flow visualization on the inboard flap region indicates similar flow patterns to that of the = 16° case that is also consistent with similar Cp distributions in Fig. 9b. Flow in the outboard region stays the same; attached flow on the main wing and unsteady spanwise dominant flow on the flap. The local separated flow regions over the aileron section widen especially in the spanwise direction. It is not known whether they moved further upstream, however, looking at the trend in the previous cases and the CFD simulations, one can expect that they get larger and move upstream at the post-stall conditions. At this high angle of attack, the flow over the nacelle is also seen as separated in the experiments.
B. Flow Separation Control with Nacelle Chine
As clearly shown in the surface flow visualization images, the wake of the nacelle/pylon generates large flow separation over the main wing in the inboard region, especially at higher angles of attack. This flow separation is detrimental to the aerodynamic performance. As shown in Fig. 7a, there is a slope change (i.e., performance reduction)
in the lift curve starting from = 12°. One way of controlling this flow separation is to use a nacelle chine, which is a type of vortex generator. The effect of the nacelle chine on a comparable high-lift system (JAXA Standard High Lift Model) was investigated experimentally by Kato et al.25 The same group also carried out design exploration of a nacelle chine installation using design optimization techniques.26 In this study, the nacelle chine was placed on the inboard side of the engine nacelle. Figure 19 shows the picture of a nacelle chine installed on the current CRM-HL model.
The effect of an engine nacelle chine was tested on the conventional CRM-HL model at a similar experimental condition. Figure 20 shows the effect of the chine on the lift curve. The figure shows that the nacelle chine maintained the slope of the lift curve and helped to recover the lift especially near the CLmax region. In addition, CLmax was increased approximately 0.07 by using a nacelle chine. Adding the nacelle chine generated some additional drag. The drag increase is mostly pronounced at the higher angles of attack ( > 12°), that is when the nacelle chine begins to act on flow separation (Fig. 21). At lower angles of attack, especially for the approach angle ( = 8°), the drag caused by a single nacelle chine is negligible. To examine the effects of the nacelle chine on the local pressures, the Cp distribution at the y = 27.75 in. spanwise station is given in Fig. 22 for = 16° and is compared to that of the baseline configuration (i.e., without nacelle chine). As shown in this figure, by properly managing the nacelle/pylon wake, the suction pressure increases over the entire chord. The increase in the suction pressures is more pronounced downstream, especially over the flap. Considering the angle of attack (16°) and the flap deflection angle (37°), the substantial increase in the suction pressure indicates that the increase in the drag coefficient at higher angles of attack is due to the induced drag caused by the controlled flow with the nacelle chine. The suction peaks at the leading edges (main wing, slat, and flap) are shown to be increased as well. This implies that the effect of the nacelle chine is not only eliminating the flow separation on the main wing but also indirectly affecting the upstream (i.e., slat) and downstream (flap) of the flow separation. This is because elimination of the flow separation also eliminates the virtual blockage to the incoming flow; therefore, upstream flow accelerates slightly in the absence of flow separation. On the other hand, since the flow separation is eliminated, the flow over the main wing has more momentum and is decelerated at a slower pace compared to the baseline case as shown by the higher suction pressures over the main wing. The higher momentum flow is able to overcome the adverse pressure gradient, resulting in higher suction pressures, and a better pressure recovery on the flap. The pressure distribution on the flap also indicates elimination of the flow separation on the flap when using the nacelle chine at this particular spanwise location.
The surface tuft visualization in Fig. 23 clearly shows the effectiveness of the nacelle chine at = 16°. The nacelle chine was able to eliminate the flow separation over the main wing that was shown in the tuft visualization (Fig. 15) as well as in the numerical flow visualization (Fig. 16) at the same angle of attack. The tuft flow visualization shows highly unsteady flow over the main wing; however, no sign of the separated flow, which is consistent with the Cp distribution in Fig. 22 as well as the lift curve in Fig. 20. Because of the separation control via a nacelle chine, the tufts appear to be more streamlined over the inboard flap when compared to the baseline case in Fig. 15. The flow unsteadiness over the lower part of the fuselage also appears to be reduced. For the rest of the regions, the surface flow visualization is similar to the baseline case shown in Fig. 15.
IV.
Conclusion
A 10% scale version of the High-Lift Common Research Model (CRM-HL) was successfully tested in the NASA Langley 14-by-22-Foot Subsonic Tunnel (14x22). The surface tuft flow visualization is presented for the conventional CRM-HL model with single-slotted Fowler flap system. Surface flow visualizations were performed using fluorescent minitufts. There were over 1600 individual tufts applied on the model upper surface. Tuft flow visualizations were supplemented with the relevant force and pressure measurements as well as three dimensional, unsteady CFD simulations for selective cases. Numerical surface flow visualizations were qualitatively compared to the tuft flow visualizations. The surface streamlines and transverse velocity fluctuations obtained by the CFD simulations were the quantities that were compared to the tuft direction and tuft unsteadiness, respectively.
First, the effect of tufts on the aerodynamic forces was investigated. It was found that the applied fluorescent minitufts have negligible effect on the lift and drag coefficients for the entire angle of attack range. Tuft flow visualizations displayed the nacelle/pylon wake in the form of flow unsteadiness at lower angles of attack that grows with angle of attack. The flow unsteadiness observed by the tufts is found to be in good agreement with the transverse velocity fluctuation contours in CFD simulations. At higher angles of attack, the wake of the nacelle/pylon evolved to flow separation over the inboard region of the main wing resulting in a slope change and performance degradation (as much as CL = 0.11 reduction near CLmax) in the lift curve starting from = 12°. The flow direction and flow separation observed by the tufts agree well with surface streamlines in the CFD simulations. The flow separation caused by the nacelle/pylon wake was successfully controlled by placing a nacelle chine on the inboard region of the
engine nacelle. The chine reduced the effect of the wake and hence flow separation and provided the lift recovery. The nacelle chine maintained the slope of the lift curve for > 12°and eliminated the performance degradation. The nacelle chine appeared to increase the drag coefficient at higher angles of attack compared to the baseline, which is due to the induced drag by controlling flow separation.
Surface flow visualizations indicated that the inboard flap has separated flow regions at lower angles of attack and these separated flow regions are reduced as the angle of attack increases. The flow appears to be separated upstream of the flap fairings on the flap due to the blockage effect of the fairings to the slot jet and the associated wake shedding from the fairings. Again due to the wake shedding from the fairings upstream of the (flap) slot, the tufts appear to be highly unsteady in the vicinity of the flap fairings over the flap. This region is shown to generate high transverse velocity fluctuations in the CFD simulations consistent with the unsteady tuft movement. The outboard flap region shows spanwise dominant flow due to the substantial increase in the sweep angle. In addition, the spanwise flow is highly unsteady and is not affected much with increasing angle of attack.
Tuft flow visualization also revealed localized flow separation over the most outboard region (aileron section) at higher angles of attack. These local flow separation regions occur downstream of the slat brackets implying that they are initiated/caused by the slat bracket wake. In addition, flow separation occurs at higher angles of attack (i.e., also caused by adverse pressure gradient) without any sign of flow unsteadiness at lower angles. Therefore, these local separated flow regions are assumed to be an interaction of the slat bracket wake with the adverse pressure gradient. However, note that none of the slat bracket wakes upstream of the inboard/outboard flaps caused flow separation. This is because the high momentum jet from the flap-slot eliminates the further growth of the local boundary layer. The transverse velocity fluctuations in the CFD simulations support this conclusion. The transverse velocity fluctuation contours clearly showed the wake of the slat brackets, which reduces as it convects downstream. However, for the aileron section, the transverse velocity fluctuations reamplify near the trailing edge due to the adverse pressure gradient. The APG thickens the local boundary layer, which is shown as lower surface skin friction values in the CFD flow visualizations. At higher angles of attack, the thickened boundary layer eventually separates, generating those local separated flow regions over the aileron section.
Acknowledgments
This R&D effort was sponsored by the Active Flow Control Wing (AFCW) Subproject under the NASA Advanced Air Transport Technology (AATT) Project. The effort involved many people who provided valuable contributions through their hard work that made a successful test possible. The authors would like to acknowledge and thank all those involved for their great support during the course of this investigation. Some key personnel are as follows:
Model Design: Jared Fell (design team lead), Sandy Webb, Miranda Snyder, Chris Laws, Reggie Kidd, John Mulvaney, Mark Cagle, David Lewis, Nigel Schneider, Dave Castle, Doug Weber, William Langford, and Ray Rhew, as well as NASA interns Jacob Ganzak and Steven Call.
Model Fabrication: Steve Geissinger, Chris Mclain, Danny Lovaglio, Robert Andrew, and Tom Hall. 14x22 Air Supply System and AFC Plumbing: Joe Giuliana.
14x22 Managerial Staff: Frank Quinto (Facility Manager), Ashley Dittberner (Operation Manager), Bill Krieger (Facility Safety Head), Joe Burton (Facility Coordinator).
14x22 Test Engineers: Jim Byrd (Lead), Abby Cayton, Jeremy Ulanday, and Sam Zauber. 14x22 Technician and Supporting Staff:
Lead Technician - Ronnie Hunter
Mechanical Technicians - Kyle Deaver (Lead), Josh Beasley, Marvin Le Gendre, Andrew Sawyer, Cassandra Stevens, and Patricia Christian
Instrumentation Technician - Andy Harrison, Bennie Lester, and Neil Coffey Electrical Technician - Dale Bennett and Leon Adams
Data System - Andy Boney (Manager), Ben Trower, and Charlotte Teague Facility Equipment Specialist - Karl Maddox
Environmental Coordinator - Joe Burton, Jr.
High Pressure Air Support - Mike Henshaw and Berry Askew. CRM-HL Consultation: Doug Lacy of Boeing Commercial Airplanes.
References
1.Van Dam, C. P., “The Aerodynamic Design of Multi-Element High-Lift Systems for Transport Airplanes,” Progress in
Aerospace Sciences, Vol. 38, 2002, pp. 101–144.
3.McClean, J. D., Crouch, J. D., Stoner, R. C., Sakurai, S., Feifel, G. E., Feifel, W. M., and Rush, H. M.,“Study of the
Application of Separation Control by Unsteady Excitation to Civil Transport Aircraft,” NASA/CR 1999–209338, 1999.
4.Melton, L. P., Koklu, M., Andino, M., and Lin, J. C., “Active Flow Control via Discrete Sweeping and Steady Jets on a
Simple-Hinged Flap,” AIAA Journal, Vol. 56, No. 8, 2018, pp. 2961–2973.
5.Melton, L. P., Schaeffler, N. W., and Lin, J. C., “High-Lift System for a Supercritical Airfoil: Simplified by Active Flow
Control,” AIAA Paper 2007-707, Jan., 2007.
6.Kiedaisch, J., Demanett, B., and Nagib, H., “Active Flow Control Applied to High-Lift Airfoils Utilizing Simple Flaps,”
AIAA Paper 2006-2856, June, 2006.
7.Hartwich, P. M., Dickey, E. D., Sclafani, A. J., Camacho, P., Gonzales, A. B., Lawson, E. L., Mairs, R. Y., and
Shmilovich, A., “AFC-Enabled Simplified High-Lift System Integration Study,” NASA/CR-2014-218521, September 2014.
8.Hartwich, P. M., Shmilovich, A., Lacy, D. S., Dickey, E. D., Sclafani, A. J., Sundaram, P., and Yadlin, Y., “Refined
AFC-Enabled High-Lift System Integration Study,” NASA/CR-2016-219170, March 2016.
9.Lin, J. C., Melton, L. P., Viken, S. A., Andino, M. Y., Koklu, M., Hannon, J. A., and Vatsa, V. N., “High Lift Common
Research Model for Wind Tunnel Testing: An Active Flow Control Perspective,” AIAA Paper 2017-0319, Jan., 2017
10.Lacy, D. S. and Sclafani, A. J., “Development of the High Lift Common Research Model (HL-CRM): A Representative
High Lift Configuration for Transonic Transports,” AIAA Paper 2016-0308, June 2016.
11.Lin, J. C., Melton, L. P., Hannon, J. A., Andino, M. Y., Koklu, M., Paschal, K., and Vatsa, V. N., “Wind Tunnel Testing
of Active Flow Control on the High Lift Common Research Model,” AIAA Paper 2019-xxx, June, 2019
12.Melton, L. P., Lin, J. C., Hannon, J. A., Koklu, M., Andino, M. Y., and Paschal, K., “Sweeping Jet Flow Control on the
Simplified High-Lift Version of the Common Research Model,” AIAA Paper 2019-xxx, June, 2019
13.Gentry, G. L., Quinto, F. P., Gatlin, G. G., and Applin, Z. T., “The Langley 14- by 22-Foot Subsonic Tunnel,” NASA TP
3008, 1990.
14.Vassberg, J. C., DeHaan, M. A., Rivers, S. M., and Wahls, R. A., “Development of a Common Research Model for
Applied CFD Validation Studies,”AIAA Paper 2008-6919, Aug. 2008.
15.3rd AIAA CFD High Lift Prediction Workshop, April 2019. https://hiliftpw.larc.nasa.gov/Workshop3/testcases.html 16.Chen, S. and Doolen, G., “Lattice Boltzmann Method for Fluid Flows,” Annual Review of Fluid Mechanics, Vol. 30,
1998, pp. 329–364.
17.Teixeira, C., “Incorporating Turbulence Models into the Lattice-Boltzmann Method,” International Journal of Modern
Physics, Vol. 9, 1998, pp. 1159–1175.
18.Vatsa, V., Duda, B., Lin, J., Melton, L., and O’Connell, M., “Numerical Simulation of a Simplified High-Lift CRM
Configuration Embedded with Fluidic Actuators,” AIAA Paper 2018-3063, June 2018.
19.Vatsa, V., Duda, B., Lin, J., Melton, L. P., O'Connell, M., and Hannon, J.P., “Comparative Study of Active Flow Control
Strategies for Lift Enhancement of a Simplified High-Lift Configuration”, AIAA Paper 2019-xxx, June, 2019
20.Barlow, J. B., Rae, W. H., and Pope, A., “Low-Speed Wind Tunnel Testing”. New York: Wiley, 1999.
21.Crowder, J. P., “Add Fluorescent Minitufts to the Aerodynamicists Bag of Tricks”, Astronautics and Aeronautics, Vol. 18,
No. 11, pp. 54-56, November 1980.
22.Crowder, J. P., Hill, E. G., and Pond, C. R., “Selected Wind Tunnel Testing Developments at Boeing Aerodynamics
Laboratory,” AIAA Paper 80-0458, 1980.
23.Crowder, J.P., “Tufts”, in Handbook of Flow Visualization, 2nd Edition. Yang, W.-J. (Ed) pp. 131-179, CRC Press, New
York, 2001.
24.Koklu, M., “Effects of Sweeping Jet Actuator Parameters on Flow Separation Control,” AIAA Journal, 2018, Vol.56:
100-110
25.Kato, H., Watanabe, S., Murayama, M., Yokokawa Y., and Ito, T., “PIV Investigation of Nacelle Chine Effects on High-
Lift System Performance,” AIAA Paper 2008-240, Jan. 2008
26.Kanazaki, M., Yokokawa, Y., Murayama M., Ito, T., Jeong, S., and Yamamoto, K., “Efficient Design Exploration of
Fig. 1. a) An example of a conventional high-lift system2 and, b) its subsystems inside the fairing.3
Fig. 2. A typical simple-hinged flap.4 Fig. 3. Langley 14- by 22-Foot Subsonic Tunnel (14x22).
Fig. 4. Conventional CRM-HL model installed in the 14x22 wind tunnel.
Fig. 5. CAD rendering of the CRM-HL model showing the surface pressure ports. Inset shows the cross-sections of two high-lift configurations, CHL and SHL.
Fig. 6. Tuft strips applied on the CRM-HL model under, a) standard, and b) UV lights.
SHL
CHL
a)
b)
Fig. 7. The effect of tufts on the a) lift coefficient, and b) drag coefficient.
a)
Fig. 8. The effect of tufts on the local pressure distributions (y = 27.75 in.).
Fig. 9. Variation of the Cp distribution with : a) in the linear range, b) near CLmax.
a)
Fig. 10. Tuft flow visualization at = 0°, M∞ = 0.2. Separated flow Unsteady spanwise flow Unsteady flow
The most outboard wing (aileron section)
Fig. 11. Tuft flow visualization at = 8°, M∞ = 0.2. Separated flow Unsteady flow Juncture vortex Unsteady spanwise flow
Fig. 12. Simulated surface streamlines at = 8°, a) Cf contours, b) Uʹn contours.
Fig. 13. Simulated surface streamlines at = 12°, a) Cf contours, b) Uʹn contours.
a)
b)
Fig. 14. Tuft flow visualization at = 12°, M∞ = 0.2. Separated flow Unsteady flow Juncture vortex Local flow separation Unsteady spanwise flow
Fig. 15. Tuft flow visualization at = 16°, M∞ = 0.2. Separated flow Local flow separation Unsteady spanwise flow
Fig. 16. Simulated surface streamlines at = 16°, a) Cf contours, b) Uʹn contours.
Fig. 17. Simulated surface streamlines at = 18°, a) Cf contours, b) Uʹn contours.
a)
b)
Fig. 18. Tuft flow visualization at = 18°, M∞ = 0.2. Separated flow Juncture vortex Local flow separation Unsteady flow Unsteady spanwise flow
Fig. 19. Nacelle chine installed on the inboard side of the engine nacelle.
Fig. 20. The effect of nacelle chine on the lift coefficient.
Nacelle chine
Fig. 21. The effect of nacelle chine the drag coefficient.
Fig. 23. Tuft flow visualization with flow separation control using chine ( = 16°, M∞ = 0.2). Attached flow Unsteady but attached flow Local flow separation Unsteady flow Unsteady spanwise flow