Validation of Wing Deformation Simulations
for the NASA CRM Model
using Fluid-Structure Interaction Computations
Stefan Keye
∗and Ralf Rudnik
†DLR, German Aerospace Center, 38108 Braunschweig, Germany
The virtual determination of static aeroelastic deformations of NASA’s Common Re-search Model at steady-state flow conditions is described. Aeroelastic equilibrium con-ditions are computed using a fluid-structure interaction simulation approach based on high-fidelity numerical fluid dynamics and structural analysis methods. The correlation of numerical and experimental results under varying aerodynamic loads and model de-formations is investigated and the influence of aeroelastic dede-formations on wing pressure distributions and overall aerodynamic coefficients is evaluated. Wind tunnel test data were made available from a recent test campaign performed at the European Transonic Wind Tunnel in Cologne, Germany as part of the research project ESWIRP
(European Strategic Wind tunnels Improved Research Potential).
I.
Introduction
Over the past years, DLR’s contribution to the AIAA Drag Prediction Workshop (DPW) series has included both, purely CFD-based studies and accompanying fluid-structure interaction (FSI) simulations. The latter include an analysis of the DLR-F6 wind tunnel model and a comparison to test data from NASA Langley’s National Transonic Facility (NTF) for DPW-III1 and an investigation of aeroelastic effects of
the NASA Common Research Model (CRM) designed by NASA’s Subsonic Fixed Wing Technical Working Group and Vassberg et al.2 for DPW-V.3 In both cases, a significant influence of model deformations on the
overall aerodynamic properties was found. This implicates that the wind tunnel model adopts its built-in design flight shape only for one sole design flow condition used in conjunction with the wing’s structural stiffness. For deviating flow conditions, e.g. varying angle of attack, Mach number, or Reynolds number, the correlation between numerical and experimental results will degrade due to varying aerodynamic loads and the corresponding model deformations.
So far, the studies carried out were targeted on consistency aspects of the FSI simulations and the assessment of the impact of aeroelastic deformations on the aerodynamic properties. Within ESWIRP the focus is now set on:
• the validation of computed deformations against wind tunnel data by comparing FSI simulations to measured deformation data from the European Transonic Wind Tunnel (ETW), and
• the investigation of static aeroelastic effects and their consistency.
II.
Numerical Modeling and Simulations
A. Aerodynamics
1. CFD Solver and Settings
The Reynolds-averaged Navier-Stokes solver TAU has been developed at DLR starting in the mid 1990s. The code can be traced back to the German CFD project MEGAFLOW4–6which integrated developments
∗Research Scientist, Institute of Aerodynamics and Flow Technology.
of DLR, aircraft industry, and universities. Today the software package is continuously enhanced by the institute’s C2A2S2E (Center for Computer Applications in AeroSpace Science and Engineering) department
and is used by DLR and European partners in industry and academia.
TAU is an edge-based, unstructured solver which uses the dual grid technique and fully exploits the advantages of hybrid grids. The numerical scheme is based on the Finite-Volume method and provides different spatial discretization schemes, like central and upwind.6 The central scheme is of second order
ac-curacy and employs the Jameson-type of artificial dissipation in scalar and matrix mode.7, 8 Time integration
is performed using both the explicit Runge-Kutta multistage and the Lower-Upper Symmetric Gauss-Seidel (LU-SGS) schemes. TAU has been developed with a particular focus on industrial aeronautical applications, thus providing techniques like overlapping grids for treating unsteady phenomena and complex geometries. A detailed description of TAU is provided in Ref. 6.
All CFD simulations were run using the linear, one-equation Spalart-Allmaras (SA) eddy viscosity tur-bulence model.9 For improved prediction of turbulent normal stress anisotropy near viscous walls, which is
considered responsible for secondary corner flow phenomena, the Quadratic Constitution Relation (QCR) extension10is applied. Yamamoto et al.11, 12 and Sclafani et al.13 have shown that the flow separation in the
wing-fuselage intersection of NASA’s CRM configuration, which is predicted by CFD but was not observed in the experiments, will be suppressed by QCR.
2. Grids
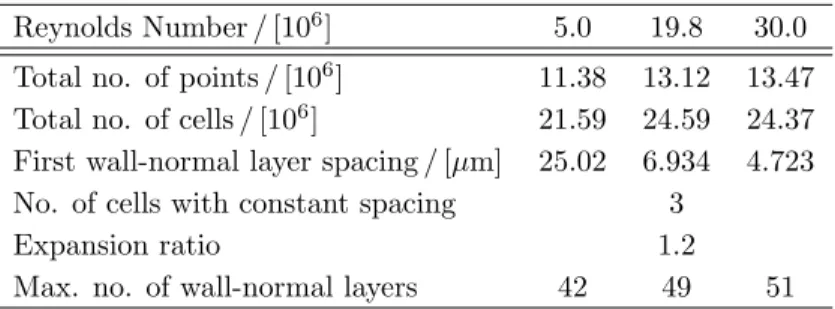
The test cases selected for this study, Table 2, include three different Reynolds numbers. Accordingly, three separate grids are required for the CFD computations, taking into account the different boundary layer thicknesses. All grids were generated using the hybrid, quad-dominant grid generation package Solar14 and
comply with DPW gridding guidelines (version number 4, November 3rd 2008)a except for list point 2)h)ii)
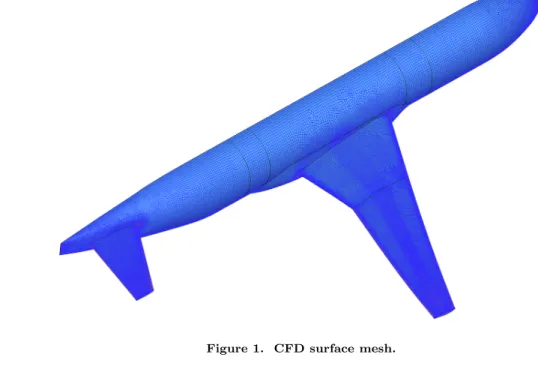
which requires a wing and tail spanwise spacing at root of∼0.1% local semispan. Due to the advancing layer approach used in Solar, this would lead to a local contraction of the prismatic/hexahedral layers in concave corners to avoid layer intersection. In order to ensure that the boundary layer edge in the concave corner is resolved with prisms/hexahedra this value has been increased to approx. 0.8 % local semispan. Details on the grid generation process are given in Table 1 and Ref. 15. The surface mesh is plotted in Figure 1.
Figure 1. CFD surface mesh.
a
Table 1. Grid details.
Reynolds Number/[106] 5.0 19.8 30.0
Total no. of points/[106] 11.38 13.12 13.47
Total no. of cells/[106] 21.59 24.59 24.37
First wall-normal layer spacing / [µm] 25.02 6.934 4.723 No. of cells with constant spacing 3
Expansion ratio 1.2
Max. no. of wall-normal layers 42 49 51
B. Structural Mechanics
1. Structural Analysis Solver
The computational structural mechanics (CSM) analysis code NASTRAN°R16
was originally developed for NASA in the late 1960s as a tool for designing more efficient space vehicles such as the Space Shuttle. The code has continuously evolved over the years with each new version providing enhancements with respect to analysis capabilities and numerical performance. After being released to the public, NASTRAN°R
became widely used throughout the aerospace and automotive industries and in civil engineering applications and has become an industry standard in many fields of application. Available analysis types include linear and non-linear static, modal, frequency and transient response, heat transfer, and design optimization.
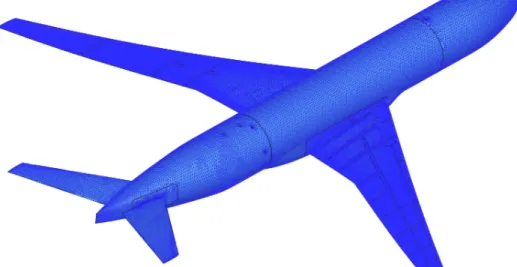
2. Finite-Element Model A NASTRAN°R
solid 4-node tetrahedral finite-element structural model of wing, fuselage, horizontal tail plane, engine nacelles, and balance interface was kindly made available by NASA Langley’s Configuration Aerodynamics Branch, Figure 2. The model includes both right and left sides to account for the wind tunnel model’s asymmetric inner structure. Joints between individual components are modeled with rigid body elements. The finite-element discretization consists of approximately 1.4·106 nodes, 6.8·106 elements, and
8.2·106 degrees of freedom. Bush elements were used to attach individual model components to each other
so that the user can remove and substitute components as needed. A variety of quality assurance checks were performed using MSC PATRAN°R17
2011 and NASTRAN°R
2010 to verify the CRM finite-element model. These checks included free-free model, 1-g static/equilibrium, strain-energy, element quality, element normal, element free-edge, coincident nodes, grid point singularities, round-off error, and grounding.
For the coupled simulations the engine nacelles and pylons were removed to more accurately represent the actual wind tunnel configuration. A rigid suspension is assumed at the balance interface. The dependency of Young’s modulus E with total temperature Ttot. for the nickel maraging steel alloy VascoMax
R ° C-250
used in the wing is given empirically byb:
E(T) = 198,204 MPa−41.6 MPa/K·Ttot./[K] . (1) Linear, static analyses were performed using NASTRAN°R
’s solution sequence 101. Coupling of aerody-namic loads between CFD simulation and finite-element analysis is established on the wing upper and lower surfaces.
C. Fluid-Structure Interaction Simulation Procedure
DLR’s fluid-structure interaction simulation procedure, Figure 3, is based on a direct coupling of high-fidelity CFD and CSM methods.18 The simultaneous interaction of surrounding flow field and flexible
aircraft structure is modeled through alternately solving the Reynolds-averaged Navier-Stokes equations and the basic equations of structural mechanics, and the interpolation of aerodynamic forces and structural deflections over the common surface of CFD and structural grids. For the investigations described here, DLR’s in-house flow solver TAU6and the commercially available structural analysis code NASTRAN°R
were used.
b
Figure 2. Finite-element model. CSM NASTRAN Interpolation CFDðCSM CFD TAU Interpolation CSMðCFD Deformation CFD-Mesh cp, F , F , Fx y z F , F , Fx y z u , u , ux y z u , u , ux y z Dx , y , zD D Surface Data CFD Surface Data CSM
III.
Wind Tunnel Test
A. The European Transonic Wind Tunnel (ETW)The ETW test facility is a continuously operated, pressurized, cryogenic, G¨ottingen type wind tunnel. The test section measures 2.4 m×2.0 m×9.0 m (width×height×length) and features optional slotted or solid walls. Mach number ranges fromM a∞= 0.15 toM a∞= 1.35, while full-scale flight Reynolds numbers up to Re= 85·106based on mean aerodynamic cord are achieved through a combination of total pressure, ranging
fromptot.= 115 kPa toptot.= 450 kPa, and total temperatures betweenTtot.= 110 K andTtot.= 313 K.
B. The ESWIRP
Test Campaign
In the scope of the ESWIRPproject, the European Union has provided a budget to open three test facilities
to the European research community, offering universities and research institutes the opportunity to perform research tests in large scale, high performance wind tunnels. From 24 to 28 February 2014 the first of the ESWIRP trans-national access (TNA) test entries took place at ETW in Cologne, Germany, using NASA’s
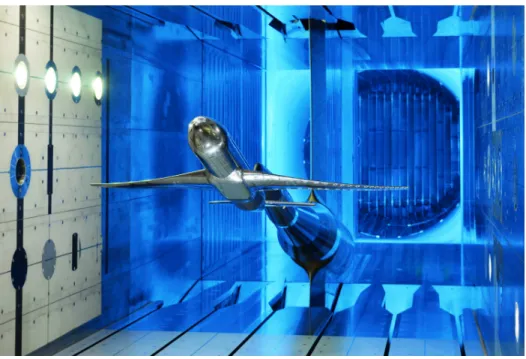
CRM. In addition to classic force, moment, and pressure measurements investigations included unsteady wake flow field measurements through time-resolved Particle Image Velocimetry (PIV) and unsteady deformation measurements at flight Reynolds and Mach numbers. Figure 4 shows the CRM wind tunnel model in the ETW slotted walls test section.
Figure 4. NASA’s Common Research Model in the ETW test section.
Model deformation data are available for a total of seven out of the 74 runs conducted during the ESWIRP
test campaign. The test cases selected for validation of computed deformations from the FSI simulations, Table 2, include three different Reynolds numbers and test section dynamic pressuresqresulting in two levels ofq/E. Besides validation, the main goals of this investigation are to identify the aerodynamic effects which cause the observed deformation behavior and to assess overall data consistency.
IV.
Results
A. Introduction
During DPW-IV and DPW-V a comparison of participants computational results to experimental data from an NTF test campaign carried out in conjunction with DPW-IV19 revealed significant offsets in overall pitching moment CM over the entire angle of attack range.20, 21 These offsets have been attributed to
Table 2. ETW test cases.
Run M a∞ Re /[106] ptot./[kPa] Ttot./[K] αmin./[deg] αmax./[deg] q/E 182 0.85 5.0 191.0 264.0 −2.0 +5.5 0.3260 218 19.8 300.0 134.5 −1.0 +3.0* 0.4922 227 19.8 199.0 101.8 −2.0 +6.0 0.3259 237 30.0 303.0 101.8 −2.0 +5.5 0.4936
* Deformation data forα >3.0 deg was removed due to large scatter.
interference effects from the model support system,22, 23 which extends vertically from the aft fuselage, cf.
Figure 4. This leads to a considerable underprediction ofCM in the numerical data, prohibiting an accurate evaluation of the comparatively small aeroelastic effects. Therefore, no pitching moment characteristics will be discussed here.
B. Polar Data
In Figures 5 to 8 the overall lift (a) and drag (b), wing tip bending (c), and wing tip twist (d) are plotted as a function of angle of attack for the test runs listed in Table 2. Two different sections are clearly distinguishable, in particular in the plots for lift and wing deformations, a mostly linear region extending fromαmin.to α= 3.0 deg, and a region dominated by nonlinear effects betweenα= 3.0 deg andαmax..
(a) Lift (b) Drag
(c) Wing Bending (d) Wing Twist
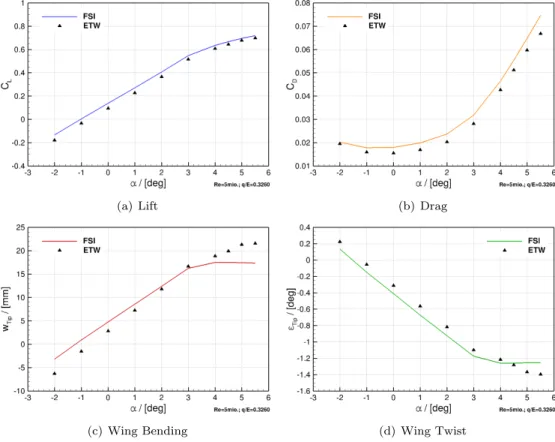
Figure 5. Polar data for Run 182,Re = 5.0·106
,q/C = 0.3260.
In all test cases lift coefficientsCLcomputed by the FSI simulations exceed the measured values over the entire range of angles of attack, with almost constant offsets in the linear and slightly increasing deviations in the nonlinear region. The only exception here is Run 182 atRe= 5.0·106, where forα >3.0 deg the slope in
lift is smaller and remains closer to the experimental data. The Reynolds number effects on overallCL, i.e. the gain in lift with higher Reynolds number due to reduced displacement thickness, is correctly captured.
(a) Lift (b) Drag
(c) Wing Bending (d) Wing Twist
Figure 6. Polar data for Run 227,Re = 19.8·106
,q/C = 0.3259.
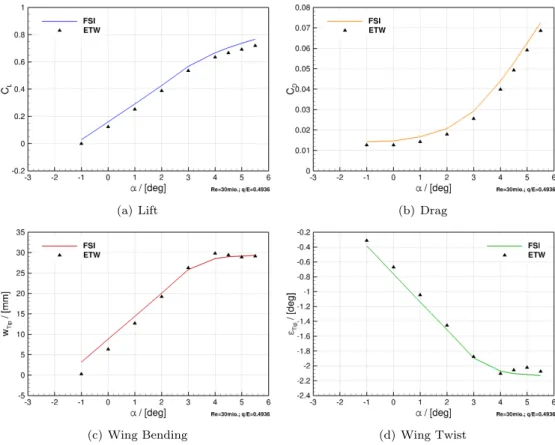
(a) Lift (b) Drag
(c) Wing Bending (d) Wing Twist
Figure 7. Polar data for Run 218,Re = 19.8·106
(a) Lift (b) Drag
(c) Wing Bending (d) Wing Twist
Figure 8. Polar data for Run 237,Re = 30.0·106
,q/C = 0.4936.
Likewise, drag coefficients CD are always overpredicted by the FSI simulations, which is due to the fully turbulent approach used in the CFD computations. Deviations are mostly independent of angle of attack, except for Run 182, where for α >3.0 deg the slope ofCD ascends more steeply than in the experimental data. The overall aerodynamic coefficients do not indicate any secondary Reynolds number scaling effects, e.g. due to flow separations at the wing-fuselage intersection.
Regarding wing bending, the largest discrepancies between numerical and wind tunnel test data occur at smaller angles of attack. The best agreement is found around the design point atα= 3.0 deg. Deviations in twist deformations for Runs 182 and 218 remain largely independent of angle of attack. With Runs 227 and 237 an improved correlation is observed around the design point. In the nonlinear region both bending and twist deformations level out to an almost horizontal gradient. Again, Run 182 is an exception in that for higher angles of attack the leveling of wing deformations predicted by the FSI simulations is not confirmed by the experiments.
C. Static Pressure Distributions
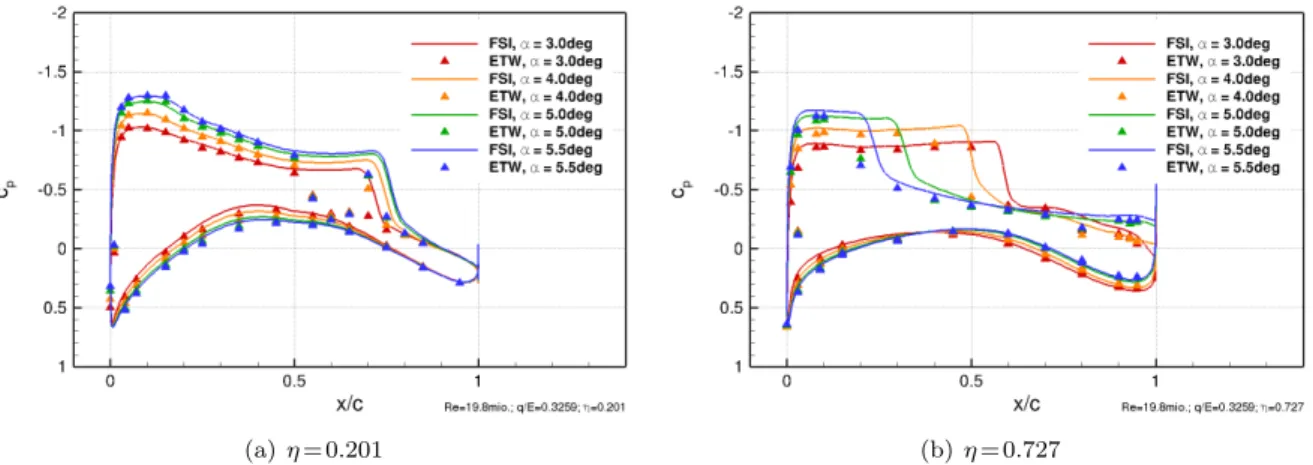
The nonlinear region observed in both the lift polar and wing deformation curves is obviously associated with local variations in shock location as angle of attack is increased. Figure 9 shows the chordwise distribution of static pressure coefficient cp for four different angles of attack between α= 3.0 deg and α= 5.5 deg. While remaining largely constant on the inboard wing, a strong upstream shift of shock location is observed, starting at η≈0.5 and extending outwards towards the wing tip. Although some deviations to measured data exist the general effect is correctly captured by the CFD computations.
Likewise, the differences in the lift curve’s nonlinear region found between the FSI predictions for Re= 5.0·106and the higher Reynolds numbers are attributed to a spanwise shock movement. In Figure 10 chordwise
static pressure distributions for α= 5.5 deg at selected spanwise sections are compared to numerical data for Re= 30.0·106 and wind tunnel results. While at the inboard section (η= 0.283) the shock is located
slightly downstream for both Reynolds numbers, shock location at the outboard sections, i.e. η= 0.603 to
(a)η= 0.201 (b)η= 0.727
Figure 9. Wing chordwise static pressure distributions for different angles of attack, Re = 19.8·106,
q/C = 0.3259.
(a)η= 0.283 (b)η= 0.603
(c)η= 0.727 (d)η= 0.846
measured location for Re= 30.0·106. This explains the lower lift coefficients forRe= 5.0·106in comparison
toRe= 30.0·106, i.e. the general tendency is reflected correctly, but a comparison to the experimental data
also implies that forRe= 5.0·106C
L should be clearly smaller than the experimental values and somewhat higher forRe= 30.0·106. Consequently, the impact of deviations in thecp(x/c)-distributions on overall lift is considered too small. The good agreement with respect to lift coefficient as seen in Figures 5 to 8 appears to be somewhat misleading. However, the compensation effect involved here remains unclear and is subject to further investigations.
D. Wing Deformations
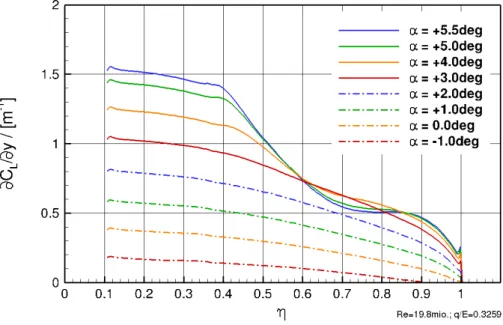
In contrast to the comparatively small influence of chordwise shock location movement on overall lift a much stronger impact on wing deformation is observed in Figures 5 to 8, where forα≥4.0 deg both bending and twist deformations become essentially independent of angle of attack. This effect is caused by changes in the wing’s spanwise aerodynamic load distribution, Figure 11. In the linear domain up toα= 3.0deg spanwise lift distribution is increasing continuously with angle of attack and a roughly elliptical shape is found. Starting fromα= 4.0 deg lift on the outboard wing no longer increases, resulting in an almost constant bending and twist deformation for the higher angles of attack and a diminished lift coefficient slope. For Runs 227 and 237, i.e. Reynolds numbers ofRe= 19.8·106andRe= 30.0·106, this is confirmed by the wind tunnel deformation
data. For Run 182 atRe= 5.0·106 the overpredicted upstream movement of shock location with angle of
attack in the numerical simulations as discussed in the previous paragraph leads to an underprediction of wing deformations by the FSI simulations which is not observed in the experiment.
Figure 11. Wing spanwise lift distributions for different angles of attack,Re = 19.8·106
,q/C = 0.3259.
E. Variation of q/E Ratio
To study the influence of varying q/E ratio on model deformations the spanwise distribution of reduced bendingw/(CL·q/E) and twist deformationsε/(CL·q/E) are plotted in Figure 12. Error bars included in Figure 12(b) depict the confidence interval determined by the wind tunnel’s Stereo Pattern Tracking (SPT) data acquisition system. The confidence interval is the fluctuation range that includes 90 % of all samples within a single data point, i.e. one angle of attack during a pitch-pause polar. Both measured and numerical results show marginally higher bending and twist deformation magnitudes for the lowerq/Eratio, which is caused by the somewhat higher aerodynamic loads for the lowerq/Eratio, Figure 13. Bending is generally underpredicted by the FSI simulations, whereas predicted twist distributions fall between the experimental data, but partially outside the confidence intervals. Apart from these minor deviations the q/E effect is considered to be correctly simulated.
(a) Bending (b) Twist
Figure 12. Wing spanwise normalized deformation for two different q/E ratios,Re = 19.8·106
,α= 3.0 deg.
(a)η= 0.603 (b)η= 0.727
(c)η= 0.846 (d)η= 0.950
Figure 13. Wing chordwise static pressure distributions for two differentq/Eratios,Re= 19.8·106
Conclusions
Fluid-structure interaction simulations were performed using NASA’s Common Research Model wind tunnel geometry. Numerical results were compared to experimental data from the ESWIRP TNA test
campaign conducted in February 2014. The purpose of the investigations was to validate computed model deformations against wind tunnel data and to study static aeroelastic effects. Flow conditions selected for validation include one Mach number, three Reynolds numbers, and twoq/E ratios. Particular interest was focused on the nonlinear flow regime beyond the design point angle of attack. Although some deviations between the FSI simulation results and experimental data exist the general agreement was found to be good. Aerodynamic and aeroelastic phenomena studied, including the Reynolds number effect on overall
CL and the influence of varying q/E ratio on model deformations, were captured correctly. No secondary effects, like flow separations at the wing-fuselage intersection, were observed. The nonlinear behavior of both aerodynamic and structural parameters was associated with variations in shock location on the outboard wing as angle of attack is increased. Wing bending and twist deformations were found to respond more sensitive to these shock movements than the overall aerodynamic parameters.
Acknowledgments
Work presented in this article has been funded through the European Union Seventh Framework Pro-gramme ([FP7/2007-2013] [FP7/2007-2011]) under grant agreement n◦227816. The authors wish to thank
Mr. Matthias Schulz, responsible ETW test engineer, and all ESWIRP TNA test campaign team members
for the excellent collaboration.
References
1
Keye, S. and Rudnik, R., “Aero-Elastic Simulation of DLR’s F6 Transport Aircraft Configuration and Comparison to Experimental Data,” AIAA Paper 2009–0580, AIAA, Jan. 2009.
2
Vassberg, J., DeHaan, M., Rivers, S., and Wahls, R., “Development of a Common Research Model for Applied CFD Validation Studies,” Paper 2008–6919, AIAA, June 2008.
3
Keye, S., Brodersen, O., and Rivers, M., “Investigation of Aeroelastic Effects on the NASA Common Research Model,” AIAA Journal of Aircraft, 2014, Vol. 51, No. 4, 2014, pp. 1323–1330.
4
Galle, M., “Ein Verfahren zur numerischen Simulation kompressibler, reibungsbehafteter Str¨omungen auf hybriden Net-zen,” Phd thesis, Uni Stuttgart, 1999.
5
Kroll, N., Rossow, C.-C., Becker, K., and Thiele, F., “MEGAFLOW – A Numerical Flow Simulation System,”Aerospace Science Technology, Vol. 4, 2000, pp. 223–237.
6
Gerhold, T., “Overview of the Hybrid RANS Code TAU,”MEGAFLOW, edited by N. Kroll and J. Fassbender, Vol. 89 ofNotes on Numerical Fluid Mechanics and Multidisciplinary Design, Springer, 2005, pp. 81–92.
7
Jameson, A., Schmidt, W., and Turkel, E., “Numerical Solution of the Euler Equations by Finite Volume Methods using Runge–Kutta Time Stepping Schemes,” AIAA Paper 81–1259, Jan. 1981.
8
Swanson, R. C. and Turkel, E., “On Central Differences and Upwind Schemes.”Journal of Computational Physics, Vol. 101, pp., 1992.
9
Spalart, P. and Allmaras, S., “A One–Equation Turbulence Model for Aerodynamic Flows,” AIAA Paper 1992–0439, 1992.
10
Spalart, P., “Strategies for turbulence modelling and simulations,” Tech. rep., Vol. 21, pp. 252-263, 2000. 11
Yamamoto, K., Tanaka, K., and Murayama, M., “Comparison Study of Drag Prediction for the 4th CFD Drag Prediction Workshop using Structured and Unstructured Mesh Methods,” Paper 2010–4222, AIAA, June 2010.
12
Yamamoto, K., Tanaka, K., and Murayama, M., “Effect of a Nonlinear Constitutive Relation for Turbulence Modeling on Predicting Flow Separation at Wing-Body Juncture of Transonic Commercial Aircraft,” Paper 2012–2895, AIAA, June 2012.
13
Sclafani, A., Vassberg, J., Winkler, C., Dorgan, A., Mani, M., Olsen, M., and Coder, J., “DPW-5 Analysis of the CRM in a Wing-Body Configuration Using Structured and Unstructured Meshes,” AIAA Paper 2013–0048, 2013.
14
Leatham, M., Stokes, S., Shaw, J., Cooper, J., Appa, J., and Blaylock, T., “Automatic Mesh Generation for Rapid-Response Navier-Stokes Calculations,” AIAA Paper 2000–2247, June 2000.
15
Crippa, S., “Application of Novel Hybrid Mesh Generation Methodologies for Improved Unstructured CFD Simulations,” AIAA Paper 2010–4672, June 2010.
16
MSC Software Corporation, “Product Information,” [online web site], https://www.mscsoftware.com/product/msc-nastran, 2013.
17
MSC Software Corporation, “Product Information,” [online web site], https://www.mscsoftware.com/product/patran, 2013.
18
Heinrich, R., Wild, J., Streit, T., and Nagel, B., “Steady Fluid-Structure Coupling for Transport Aircraft,” ONERA-DLR Aerospace Symposium, Oct. 2006.
19
20
Vassberg, J., Tinoco, E., Mani, M., Zickuhr, T., Levy, D., Brodersen, O., Crippa, S., Wahls, R., Morrison, J., Mavriplis, D., and Murayama, M., “Summary of the Fourth AIAA Drag Prediction Workshop.” Paper 2010–4547, AIAA, June 2010.
21
Levy, D., Laflin, K., Tinoco, E., Vassberg, J., Mani, M., Rider, B., Rumsey, C., Wahls, R., Morrison, J., Brodersen, O., Crippa, S., Mavriplis, D., and Murayama, M., “Summary of Data from the Fifth AIAA CFD Drag Prediction Workshop,” AIAA Paper to be published, Jan. 2013.
22
Rivers, M. and Hunter, G., “Support System Effects on the NASA Common Research Model,” Paper 2012–0707, AIAA, January 2012.
23
Rivers, M., Hunter, G., and Campbell, R., “Further Investigation of the Support System Effects and Wing Twist on the NASA Common Research Model,” Paper 2012–3209, AIAA, June 2012.