EasyChair Preprint
№
4128
A Large-scale VR Panoramic Dataset of QR Code
and Improved Detecting Algorithm
Zhu Zehao, Zhai Guangtao, Zhang Jiahe, Jia Jun and Yi Fuwang
EasyChair preprints are intended for rapid dissemination of research results and are integrated with the rest of EasyChair.
code and Improved Detecting Algorithm
Zehao Zhu, Guangtao Zhai, Jiahe Zhang, Jun Jia, and Fuwang Yi
1
Institute of Image Communication and Network Engineering
2
Shanghai Jiao Tong University
3 Shanghai, China 4
email:{zhuzehao, zhaiguangtao, jiajun0302, zhangjiahe,yifuwang}@sjtu.edu.cn
Abstract. With the rapid development of mobile payment and scan-ning technology, QR code has become widespread in both consumer and enterprise domains. However, there is the lack of corresponding research on detecting QR code in panoramic video due to the lack of high-quality datasets. To fill this gap, in this work we propose a large-scale panoram-ic QR code dataset to facilitate relevant research. Our dataset includes the following characteristics:(1)It is by far the largest dataset in terms of image quantity. (2)Compared with the existing datasets, ours is closer to the realistic setting and can derive a variety of research problems. In addition to the dataset, we propose a QR code detecting approach in a complex environment based on deep learning improving accuracy of QR code detection.
Keywords: VR video panoramic detection·QR code·deep learning.
1
INTRODUCTION
Barcode has become an integral part of life and has played an important role in shopping, advertising, communication, etc. Barcodes were invented in 1949 by Bernard Silver and Norman Woodland [1]. Barcodes can be classified into two different main categories: 1D and 2D barcodes. 1D barcode is a graphic identifier that expresses a set of information by arranging a plurality of black bars and spaces of different widths according to certain coding rules. 2D barcode is composed of black and white squares arranged in a certain regular pattern. The common types of the 2D barcode are QR Code, Micro QR Code, Data Matrix, etc.
QR code is greatly famous and popular in 2D barcodes and has a huge ap-plication space in mobile payment, advertising, and many automation scenes [20–22]. For example, Takashi Anezaki invented a robot that can identify QR code to track people [2]. In the shopping field, BlindShopping is a piece of as-sisting equipment designed to help blind people shop in the supermarket. The blind can use the barcode detecting device to get the current location and prod-uct information [3]. Library instrprod-uction and content can also be delivered with
smartphones by scanning QR codes, which is more reliable than augmented reality [4]. QR Code can also be embeddef on digital screen via temporal psy-chovisual modulation (TPVM) . QR code can be used as ”invisible watermark” and ”physical hyperlink” [14].
Due to the rapid development of machine learning and deep learning, the accuracy of object detection has now been greatly improved. Today’s barcodes are usually attached to interesting objects, such as products, express packages, corridors, and the object detection process can be simply replaced with barcode detection, which is easier and more accurate than ordinary object detection. Today, virtual vision has been applied to many fields such as video surveillance [15], intelligent cameras [16] and wearable vision assistance system [17]. The application of QR code detection to the field of virtual vision is very promising. When decoding these QR codes, the biggest challenge is that adverse en-vironments, barcode such as blurring, high contrast, dark light, etc, will have various adverse effects on the detection of the barcode. How to detect barcode quickly and reliably is still a challenging task, and has become a critical topic in the computer vision community.
As far as we know, several barcode detection approaches have been proposed and the corresponding QR code datasets have been built, such as Melinda Ka-tona [5], G´abor S¨or¨os [6], Gallo [7], Dubsk´a [8] and Zamberletti [9]. All of the above detection approaches have achieved very good detection results on the corresponding datasets. Unfortunately, these approachess are not effective in the detection of QR codes of VR panoramic videos. In addition, these datasets are far from the actual situation in terms of quantity and quality.
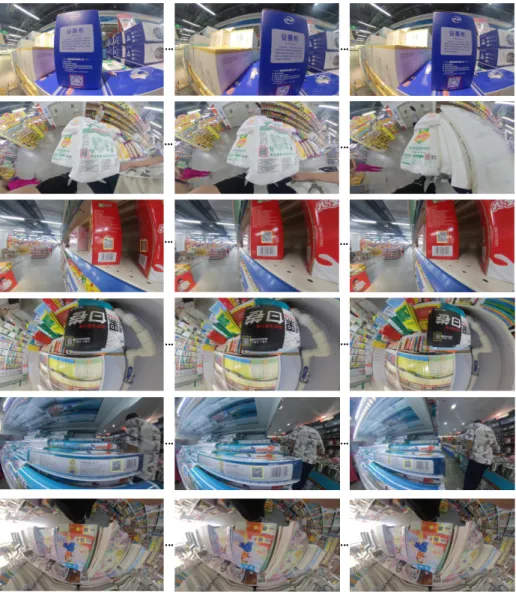
This paper builds a large-scale VR panoramic QR code dataset including QR codes and 1D barcodes. The captured environment includes blurring, excessive exposure, deformation, tilted filming angle, etc(see Fig. 1). Compared with the existing datasets, our dataset is much closer to a realistic scenario. In addtion, an improved detecting algorithm is proposed to detect QR codes. In our ap-proach, we apply region proposal network (RPN) introduced by Faster R-CNN to generate region proposals [18].
The rest of this paper is organized as follows. In Section 2, we We introduce the dataset of other authors and the corresponding detection methods. Charac-teristics of our dataset and evaluation metrics are given in Section 3. In Section 4, we describe the details of the proposed method. Section 4 concludes this paper and introduces the future work.
2
RELATED WORK
In this part, we review the existing datasets and detection approaches that are relevant to our task.
The dataset and detecting approach of G´abor S¨or¨os G´abor S¨or¨oss
dataset [6] is a 1D barcode and QR code dataset which focuses on testing the algorithm of detecting blurred 1D barcode and QR code. It includes 328 images
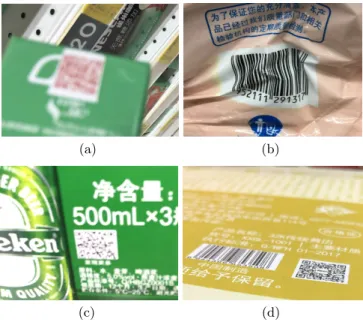
(a) (b)
(c) (d)
Fig. 1.Several types of low-quality barcodes. (a) blurring QR code; (b) deformed 1D barode; (c) the QR code under the case of high contrast; (d) the barcode under the case of tilted filming angle.
(resolution:720×1280). G´abor S¨or¨os used the saliency map to detect areas with high a concentration of edge structures as well as for areas with high a concen-tration of corner structures. However, the environment in which the barcode is located is very simple. The detection algorithm obtained from this dataset is not well suited to Panoramic video detection.
The dataset and detecting approach of Dubsk´a Dubsk´as dataset [8] is a
QR code dataset which focuses on testing the algorithm of detecting QR code. It includes 400 images (resolution:2560×1440). Most of the images in the database are very clear. Dubsk´a used Hough transformation and parallel coordinates to detect QR code. In actual situations, the QR code may be blurred or deformed in various background. The database and algorithms can only be applied to Panoramic video detection.
The dataset and detecting approach of Zamberletti Zamberlettis dataset
[9] is a 1D barcode dataset. It includes 521 images (resolution:648×488). Among them, the training set includes 366 images, and the test set includes 155 images. Zamberletti presented a novel method based on a supervised machine learning algorithm that detects 1D barcodes in the twodimensional Hough Transform space. However, the dataset is the same as the two datasets above. The captured environment of this dataset is very simple and is not well suited to Panoramic
video detection. In addition, the localization of barcode is a rectangle with an angle, however, the barcode bounding boxes are not accurate when barcodes are distorted, and the background of their training images is not complex.
The dataset and detecting approach of Hansen Hansen [10] did not
build his own dataset. In the training of 1D Barcodes Zamberletti’s dataset was used using the split into train and test as provided by the dataset. For the QR barcodes. the QR database provided by G´abor S¨or¨os and the Dubsk´aare used for training. Hansen applied YOLO [13] to detect tect QR code and 1D barcode at the same time. Due to the shortcomings of the data set, the detection results in the actual environment are not ideal.
3
A NEW DATASET FOR DETECTING QR CODE
In this section, we elaborate on the details of the QR code dataset. First, we introduce the characteristics of the dataset. Then, we propose evaluation metrics adopted for detecting QR codes.
3.1 Characteristics of Our Dataset
In this paper, we build QR code dataset to facilitate relevant research. The characteristics of the dataset can be summarized into three aspects.
2XU'DWDVHW *£ERU6¸U¸V 'XEVN£ =DPEHUOHWWL N u m b e r o f im a g e s 1XPEHURIEDUFRGHVKRRWLQJHQYLURQPHQWFDWHJRULHV Fig. 2.Comparison with other related datasets in the literature
– Large-scale: As shown in Fig. 2, our dataset is the largest dataset so far
for QR code detection. To collect this dataset, we capture 2024 images using insta360 ONE X action camera(resolution:3024×4032). Among them, the
training set includes 1300 images, and the test set includes 724 images. This is almost 4 times the size of the category of the previous largest dataset.
– Multiple environments:We made the following classifications of the
shoot-ing environment in which the images in the database are located. (1)Normal environment; (2)Blurring: The area of QR code is blurred due to inaccu-rate focus; (3)Excessive exposure: Due to excessive exposure, the black and white data area of the code is not obvious. (4)Deformation: The code on some products will change with the irregular shape of the product. (5)Tilt-ed shooting angle: If the shooting angle is tilt(5)Tilt-ed, QR code are stretch(5)Tilt-ed at an angle. Their shapes are no longer rectangles, making them undetectable. (6)Shooting light is too dark. As shown in Fig. 2, Our database includes the above six environments. Table 1 shows the number of images in different environments.
– Close to realistic scene:The images in our database are all taken in the
wild. These QR codes exist in products, advertisements, posters, books, etc. Compared to the single scene of other datasets, our dataset is closed to a realistic scene. The network trained with this data set is more suitable for the detection of the actual environment.
We use the dataset provided by G´abor S¨or¨os and Dubsk´a. These two datasets contain 328 images and 114 images, respectively. We hand-labeled our dataset and the two author’s dataset , since they do not provide ground truth. The background of these images is more complex, and some distortions, such as excessive exposure, blur, tilted shooting angle, also exist on images to simulate the real challenging situations. Besides, we also take some images containing small barcodes. We split these 2466 images into a training set and a test set randomly, and the number of the training set is 1742. We evaluate our method on the test set.
Table 1.Comparison with other related datasets in the literature
Ours G´abor S¨or¨os Dubsk´a Zamberletti
Total number 2024 328 114 521
Normal environment 1304 86 92 450
Blurring 280 242 - 43
Excessive exposure 156 - -
-Deformation 110 - -
-Tilted filming angle 94 - 12
3.2 Evaluation Metrics
In this section, we use two metrics to evaluate our experiment results.
Intersection over Union (IoU): IoU is a measure of the accuracy of
detecting a corresponding object in a particular dataset. It can reflect whether the predicted bounding box matches the ground truth. IoU can be calculated as follow:
IoU(GT, DR) =GT ∩DR
GT ∪DR (1)
whereGT is ground truth andDR is detection result. In general, ifIoU ≥0.5, the result is a good test result. We think the detection result is correct.
Mean Average Precision (mAP):The first metric is mean Average
Pre-cision. In the target detection algorithm,mAP is often used as a benchmark to measure the accuracy of the algorithm. The nature of mAP is actually an av-erage of each category of avav-erage precision(AP). Average precision is calculated from the precision-recall curve. The precision recall are defined as follow:
P = T P
T P +F P (2)
R= T P
T P +F N (3)
Calculate the average precision using the following formula:
AP =X
n
(Rn−Rn−1)Pn (4)
wherenis rank order,Rn andPnare precision and recall at rankn.mAP is the
average of each class ofAP:
mAP = 1 N N X n APn (5)
whereN is the total number of class.
Mean Area Ratio (mAR):The second metric that we propose is mean
Area Ratio. In the actual situation, it is not enough to locate only the barcode. The final purpose is to obtain the decoding result of the barcode. The more accurate the prediction bounding box is, the higher the decoding rate will be. In order to evaluate the accuracy of barcode locating, we use mAR as another evaluation metric. ThemAR is defined as follows:
AR= (|Ap−At| Ap if IoU >0.5 0 otherwise (6) mAR= 1 N N X n ARn (7)
whereApis prediction bounding box andAtthe area of barcode in prediction
bounding box.AE is the proportion of bar code in the prediction bounding box.
N is the number of prediction bounding boxes. For one ground truth,AE∈[0,1], so that if IoU is less than 0.5, we think it is a false prediction and setAE to 0
4
OUR METHODOLOGY AND EXPERIMENT
In this section, we use two metrics to evaluate our experiment results.
4.1 Our Methodology
In this section, we will introduce our approach for barcode detection. Firstly the VR Panoramic video will be divided into video frames(panoramic images), then we will use Faster R-CNN algorithm [10] to detect QR code in the panoramic image, and finally we will stitch the detected images according to the frame rate of the original video. The network structure is shown in Fig. 3. The whole process can be separated into two stages: one is region proposal network (RPN) and another is a classification network and a bounding box regression network.
濥瀂 濜濣 瀂濿濿濼 瀁濺 濖濿濴瀆瀆濼濹濼濸瀅 濵瀂瀈瀁濷濼瀁濺澳 濵瀂瀋 濠 濡 濠灤濡灤濉濇 濠濂濅灤濡濂濅灤濉濇 濆 濠濂濇灤濡濂濇灤濄濅濋 濠濂濋灤濡濂濋灤濅濈濉 濠濂濄濉灤濡濂濄濉灤濈濄濅 濙濸濴瀇瀈瀅濸澳 濠濴瀃 濥濣濡 濖瀂瀁瀉瀂濿瀈瀇濼瀂瀁澳澾澳濥濸濟瀈 濣瀂瀂濿濼瀁濺 濥瀂 濜濣 瀂濿濿濼 瀁濺 濖濿濴瀆瀆濼濹濼濸瀅 濵瀂瀈瀁濷濼瀁濺澳 濵瀂瀋 濠 濡 濠灤濡灤濉濇 濠濂濅灤濡濂濅灤濉濇 濆 濠濂濇灤濡濂濇灤濄濅濋 濠濂濋灤濡濂濋灤濅濈濉 濠濂濄濉灤濡濂濄濉灤濈濄濅 濙濸濴瀇瀈瀅濸澳 濠濴瀃 濥濣濡 濖瀂瀁瀉瀂濿瀈瀇濼瀂瀁澳澾澳濥濸濟瀈 濣瀂瀂濿濼瀁濺
Fig. 3.Network structure. Input image is on the left with sizeM ×N ×3, and filters are consistent with VGG16 [11]
We also use a classification layer to predict region proposals, and a regression layer to refine region proposals. The shape of region proposals is a horizontal rectangle which simplifies the RoI pooling. The rectangle region proposal comes from the circumscribed rectangle of the quadrilateral.
The network process is as follows. In Convolution Layers, the input is images and the output is the feature maps of the extracted image, which is used as a shared feature of the Region Proposal Network(RPN) and the fully connected
layer. In RPN, generate region proposals based on feature maps. Get the ideal proposals by bounding box regression on anchors [12]. In RoI Pooling, the input is feature map and proposals, and the output is the extracted proposal feature maps, which are used for fully connected layer pair category determination. In Classifier, the proposal feature maps are used to calculate the category of the proposal, and the bounding box regression is performed again to get the exact object detection frame position. In the last step, train classification probability and bounding tree regression using Softmax Loss (Detection classification prob-ability) and Smooth L1 Loss (Detection border regression). By regressing the
bounding box, we can get the detection frame position of the object. Softmax Loss is defined as follows.
L=
T
X
j=1
yjlogSj (8)
L is a loss.Sj is the jth value of the output vector S of softmax. The range of
j is 1 to the number of categories T. y is a 1×T vector with T values inside, and only 1 value is 1, and other T-1 values are 0. The flow chart of the algorithm is shown Table 2.
SmoothL1 is defined as follows.
SmoothL1=
(
0.5x2 |x|<1
|x| −0.5 otherwise (9) x = f(xi)−yi is the difference between the true value and the predicted
value
We apply RoIAlign method proposed by He [13] to get each Region of Interest (RoI), and extract feature from integrated feature map according to each RoI.
4.2 Experimental Details
In our experiments, we use VGG16 [10] network as our base network. The VG-G16 network is initialized with an ImageNet-pre-trained model. For testing and training the same computer has been used with an Intel(R) Xeon(R) E5-1620 v3 3.50 GHz processor, 16 GB DDR4 memory, 1TB SSD hard drive and Nvidia GeForce GTX 1080 with Windows 10 as the operating system. Before the images are fed into the network, we resize the shortest side to 600. We use four scales: 512, 256, 128 and 64, and three aspect ratio: 1:1, 1:2, and 2:1, for our anchors. The number of candidate region proposal is 300. We use insta360 ONE X to shoot VR panoramic videos with QR codes. The frame rate of this video is 30.
Data augmentation techniques are applied to expand the training set in our experiment. Inspired by Zhang [19], We use image flipping and image rotation to process our images during the training procedure. Image flipping directions are horizontal and vertical, image rotation angles are 90, 180 and 270. For each image, we randomly choose image flipping or image rotation. If image flipping is chosen, we randomly choose the flipping direction. Similarly, if image rotation is chosen, we randomly choose the rotation angle.
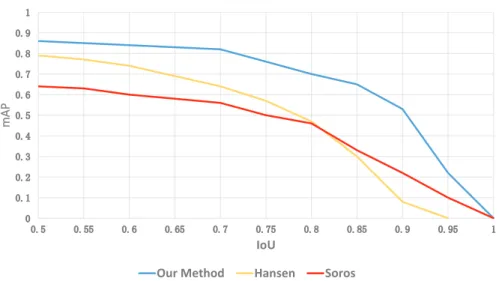
m A P IoU
Our Method Hansen Soros
Fig. 4.mAP vs: IoU overlap ratio
Table 2.Comparison with different methods
Method mAP mAR
G´abor S¨or¨os [6] 0.538 0.588 Hansen [10] 0.642 0.685 Dubsk´a [8] 0.581 0.601
Our method 0.886 0.811
4.3 Performance
In this section, we evaluate our model. In the first experiment, we compare our method with others’ methods. Henson [10] used a You Only Look Once
network(YOLO) [13] to detect QR codes. Compared to YOLO, although the calculating speed of Faster R-CNN is slower, the accuracy is higher. The methods of Dubsk´a [8] and Zamberletti [9] only detect one barcode category, as show table 2. Dubsk´as method relies on Hough Transform to detect lines. But our experimental dataset contains a distorted image, therefore, their line detector cannot detect straight lines effectively. This restricts the performance of their method. Although the method proposed by G´abor S¨or¨os [6] can resist blur, it is less effective in complex environments. In the second experiment, we compare our model with others’ models. The result is shown in Fig. 4. The superiority of the proposed method is obvious. With IoU overlap ratio increasing, the mAP of the Faster R-CNN model decreases significantly. The qualitative results can be seen in Fig. 5. we localize the barcodes and classify them. The picture in Fig. 5 represents a certain video frame in the test video. From the results, we can see that the network can detect distorted QR codes such as blur and deformation.
5
CONCLUSION AND FUTURE WORK
This paper presents a large-scale VR panoramic QR code dataset. Comparing with the existing datasets, ours is closer to the realistic setting. At the same time, we propose our method for detecting QR codes. After testing, our model is superior to other models. Compared with others, they have certain advantages. In the future, We will expand the number of images of the dataset. In addition, the algorithm will be extended to detect more barcodes.
References
1. Tuinstra T R. Reading barcodes from digital imagery[D]. PhD thesis, Cedarville University, 2006.
2. Anezaki T, Eimon K, Tansuriyavong S, et al. Development of a human-tracking robot using QR code recognition[C]//2011 17th Korea-Japan Joint Workshop on Frontiers of Computer Vision (FCV). IEEE, 2011: 1-6.
3. Lpez-de-Ipia D, Lorido T, Lpez U. Blindshopping: enabling accessible shopping for visually impaired people through mobile technologies[C]//International Conference on Smart Homes and Health Telematics. Springer, Berlin, Heidelberg, 2011: 266-270. 4. Walsh A. QR Codesusing mobile phones to deliver library instruction and help at
the point of need[J]. Journal of information literacy, 2010, 4(1): 55-65.
5. Katona M, Nyl L G. Efficient 1D and 2D barcode detection using mathematical morphology[C]//International Symposium on Mathematical Morphology and Its Applications to Signal and Image Processing. Springer, Berlin, Heidelberg, 2013: 464-475.
6. S¨or¨os G, Flrkemeier C. Blur-resistant joint 1D and 2D barcode localization for smartphones[C]//Proceedings of the 12th International Conference on Mobile and Ubiquitous Multimedia. 2013: 1-8.
7. O. Gallo and R. Manduchi, Reading 1d barcodes with mobile phones using de-formable templates, IEEE transactions on pattern analysis and machine intelligence, vol. 33, no. 9, pp. 18341843, 2011.
8. Dubsk´a M, Herout A, Havel J. Real-time precise detection of regular grids and matrix codes[J]. Journal of Real-Time Image Processing, 2016, 11(1): 193-200. 9. Zamberletti A, Gallo I, Albertini S. Robust angle invariant 1d barcode
detec-tion[C]//2013 2nd IAPR Asian Conference on Pattern Recognition. IEEE, 2013: 160-164.
10. Hansen D K, Nasrollahi K, Rasmussen C B, et al. Real-Time Barcode Detection and Classification using Deep Learning[C]//IJCCI. 2017: 321-327.
11. Simonyan K, Zisserman A. Very deep convolutional networks for large-scale image recognition[J]. arXiv preprint arXiv:1409.1556, 2014.
12. Ren S, He K, Girshick R, et al. Faster r-cnn: Towards real-time object detection with region proposal networks[C]//Advances in neural information processing sys-tems. 2015: 91-99.
13. K. He, G. Gkioxari, P. Dollar, and R. Girshick, Mask r-cnn, in Proceedings of the IEEE international conference on computer vision, pp. 29612969, 2017.
14. Gao Z, Zhai G, Hu C. The invisible qr code[C]//Proceedings of the 23rd ACM international conference on Multimedia. 2015: 1047-1050.
15. Qureshi F Z, Terzopoulos D. Surveillance camera scheduling: A virtual vision ap-proach[J]. Multimedia systems, 2006, 12(3): 269-283.
16. Qureshi F Z, Terzopoulos D. Towards intelligent camera networks: a virtual vi-sion approach[C]//2005 IEEE International Workshop on Visual Surveillance and Performance Evaluation of Tracking and Surveillance. IEEE, 2005: 177-184. 17. Jiang B, Yang J, Lv Z, et al. Wearable vision assistance system based on binocular
sensors for visually impaired users[J]. IEEE Internet of Things Journal, 2018, 6(2): 1375-1383.
18. Ren S, He K, Girshick R, et al. Faster r-cnn: Towards real-time object detection with region proposal networks[C]//Advances in neural information processing sys-tems. 2015: 91-99.
19. Zhang J, Jia J, Zhu Z, et al. Fine detection and classification of multi-class barcode in complex environments[C]//2019 IEEE International Conference on Multimedia Expo Workshops (ICMEW). IEEE, 2019: 306-311.
20. Liu Y, Yang J, Liu M. Recognition of QR Code with mobile phones[C]//2008 Chinese control and decision conference. IEEE, 2008: 203-206.
21. DeSoto D B, Peskin M A. Login using QR code: U.S. Patent 8,935,777[P]. 2015-1-13.
22. Kan T W, Teng C H, Chou W S. Applying QR code in augmented reality ap-plications[C]//Proceedings of the 8th International Conference on Virtual Reality Continuum and its Applications in Industry. 2009: 253-257.

![Fig. 3. Network structure. Input image is on the left with size M × N × 3, and filters are consistent with VGG16 [11]](https://thumb-us.123doks.com/thumbv2/123dok_us/1867067.2772266/8.918.219.714.559.788/fig-network-structure-input-image-left-filters-consistent.webp)