Aerodynamic interference for aero-engine installations
Tomasz P. Stańkowski1, David G. MacManus2 Cranfield University, Bedford, United Kingdom, MK43 0AL
Christopher T. Sheaf3, Nicholas Grech4 Rolls Royce plc., Derby, United Kingdom
Nomenclature
b = wing span
c = aircraft reference chord 𝑐𝑙𝑜𝑐 = aircraft reference chord
dc = aircraft drag counts, based on aircraft reference area CD = drag coefficient based on aircraft reference chord
Cf = skin friction coefficient
Cp = pressure coefficient
CL = lift coefficient
DFF = fan face diameter
Dmax = nacelle maximum diameter
D = drag force L = lift force
M = Mach number
V = Velocity
x, y, z = Cartesian coordinate system for the aircraft ξ, η, ζ = Cartesian coordinate system for the engine ξ, R, Θ = Cylindrical coordinate system for the engine 𝜙 = force in the drag domain
𝜃 = force in the thrust domain
Acronyms
AoA = Angle of AttackCFD = Computational Fluid Dynamics CR = intake Contraction Ratio
CRM = NASA Common Research Model MFCR = mass flow capture ratio
TFN = Through Flow Nacelle
WB = Wing Body
WBNP = Wing Body with Nacelle and Pylon WBT0 = Wing Body with 0° inclined Tailplane WBT0NP = Wing Body Tail with Nacelle and Pylon
1PhD Student Researcher, Centre for Propulsion, Cranfield University, United Kingdom
2Head of Gas Turbine Technology Group, Centre for Propulsion, Cranfield University, United Kingdom 3Installations Aerodynamics specialist
4Aerothermal Engineer – Installations Aerodynamics
SCITECH Forum, 54th AIAA Aerospace Sciences Meeting, 4-8 January 2016, San Diego, California, USA Paper number AIAA 2016-0766
I.
Introduction
The assessment of the installation and integration of turbofan engines with the airframe is becoming increasingly important due to the relative increase in engine size and the industry requirement for improvements in overall aircraft efficiency. The interest in the aerodynamic interference in the context of turbofan integration has been of on-going interest1 and a range of experimental studies was dedicated to the problem of podded nacelle installation under a swept transonic wing of a typical transport aircraft2, 3. The studies indicated that the installation drag for two nacelles was in the order of 75 dc. Currently, the effect of engine installation for a typical conventional podded under-wing engine configuration is estimated to be in the order of 30 to 50 drag counts per two engines4. Moreover, it is sensitive to the relative position on the wing4, 5, 6 and becomes more significant for larger engine diameters7. The development of computational techniques initially allowed for the potential flow of under-wing turbofan configurations8. The further development of numerical tools and an increase in computational power led a series of Drag Prediction Workshops, where the second edition was dedicated to effects of engine installation9. The success of the initial workshop triggered the development of a more modern geometry of the NASA Common Research Model (CRM)10. The publication of substantial experimental datasets with and without through-flow nacelles11, 12 makes the CRM a benchmark validation activity for the assessment of engine installation effects. In this context, it is anticipated that engine installation will become an increasingly important concern as engine diameters are expected to increase in pursuit of improved propulsive efficiency. It is also expected that knowledge of these aspects at the preliminary design stage will become more important to facilitate timely and informed decisions on engine cycle, size and airframe integration. The aim of this research is to build on experience from the Drag Prediction Workshops, to develop computational approaches to evaluate nacelle drag, and to assess the installation interference drag for a typical civil transport configuration. The long-term purpose is to create a framework that will evaluate the combined engine and aircraft configuration for a specified flight mission. In this context, the current paper presents the drag and thrust assessments for engine installation, where the work was carried out with use of the NASA CRM with an under-wing turbofan engine and a separate-jet exhaust system. The effect of aero-engine installation on the drag and on the thrust is analysed and the interference terms are quantified with regards to engine position and size.
II.
Methods and scope
A key focus of the current work is the use of computational fluid dynamics (CFD) to evaluate installation aerodynamic effects for podded underwing engine configurations for a relatively modern aircraft10. The traditional descriptors to address the impact of the engine installation are the coefficients for the ensuing loss of lift, installation and interference drag, as well as engine net propulsive force. The current research presents those descriptors for installation effects with regards to engine position and size. Furthermore, a stack-up of the individual effects is performed to deliver the final results of aerodynamic performance of the combined aircraft-engine system.
A. Project scope
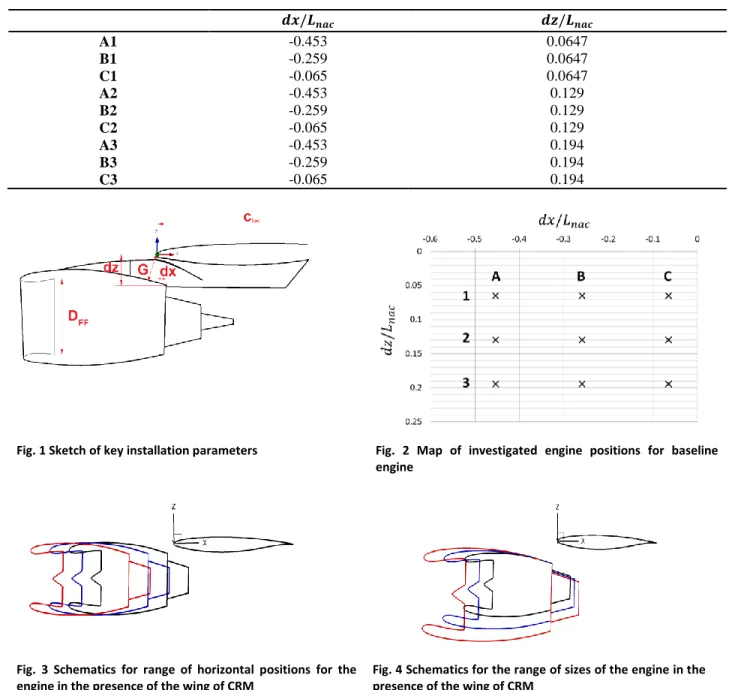
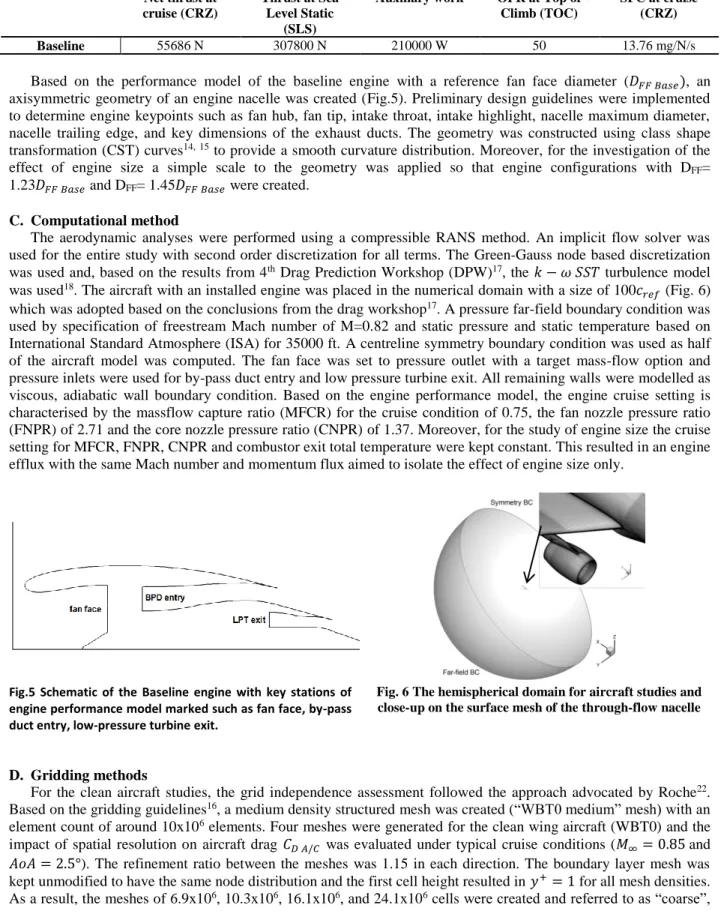
The overall project scope is to assess the impact of engine installation at cruise conditions as it is the dominant phase for long-haul flights. A typical mission at altitude of 35000 ft and a cruise Mach number of 0.82 was chosen within the limited range of aircraft angles of attack from 0°and 5°. For a given mission specification, the NASA Common Research Model (CRM)10 was chosen, which is comparable with a typical twin-engine wide-body 250-300 seater aircraft. A range of engine positions (Table 1) was considered based on the position of the fan cowl trailing edge in relation to wing leading edge (Fig. 1, Fig. 2). The effects of engine axial position (Fig. 3) and engine size (Fig. 4) are considered. Furthermore, to enable the assessment of installation, a clean wing aircraft, as well as isolated engine configurations are computed. It is necessary to compare under-wing engines, clean-wing aircraft and an isolated engine to fully appreciate the installation effects.
Table 1 Matrix of vertical and horizontal positions of the fan cowl trailing edge 𝒅𝒙/𝑳𝒏𝒂𝒄 𝒅𝒛/𝑳𝒏𝒂𝒄 A1 -0.453 0.0647 B1 -0.259 0.0647 C1 -0.065 0.0647 A2 -0.453 0.129 B2 -0.259 0.129 C2 -0.065 0.129 A3 -0.453 0.194 B3 -0.259 0.194 C3 -0.065 0.194
Fig. 1 Sketch of key installation parameters Fig. 2 Map of investigated engine positions for baseline engine
B. Engine model
To provide a range of realistic boundary conditions for an engine, it was decided to create a full engine performance model for a required specification. The engine performance modelling was done with use of the in-house code, Turbomatch13. Based on the CRM performance at M=0.82, a net thrust requirement at an altitude of 35000 ft. was estimated. Furthermore, an engine performance model for a typical modern turbofan-engine has been created to match the specification, and is referred to as the Baseline engine. Decisions on engine technology level were taken based on open source data for engines of comparable thrust class (Table 2). The engine performance model was used as a generator of engine boundary conditions to provide a consistent link between the engine intake and engine nozzles.
Fig. 3 Schematics for range of horizontal positions for the engine in the presence of the wing of CRM
Fig. 4 Schematics for the range of sizes of the engine in the presence of the wing of CRM
Table 2 Mission specification for Baseline engine Net thrust at cruise (CRZ) Thrust at Sea Level Static (SLS)
Auxiliary work OPR at Top of
Climb (TOC)
SFC at cruise (CRZ)
Baseline 55686 N 307800 N 210000 W 50 13.76 mg/N/s
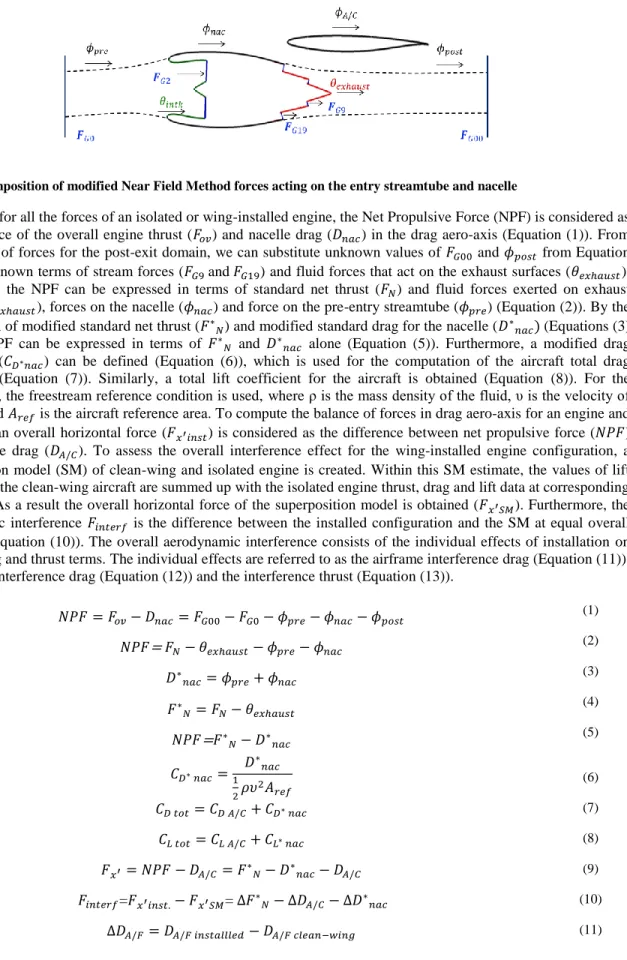
Based on the performance model of the baseline engine with a reference fan face diameter (𝐷𝐹𝐹 𝐵𝑎𝑠𝑒), an axisymmetric geometry of an engine nacelle was created (Fig.5). Preliminary design guidelines were implemented to determine engine keypoints such as fan hub, fan tip, intake throat, intake highlight, nacelle maximum diameter, nacelle trailing edge, and key dimensions of the exhaust ducts. The geometry was constructed using class shape transformation (CST) curves14, 15 to provide a smooth curvature distribution. Moreover, for the investigation of the effect of engine size a simple scale to the geometry was applied so that engine configurations with DFF= 1.23𝐷𝐹𝐹 𝐵𝑎𝑠𝑒 and DFF= 1.45𝐷𝐹𝐹 𝐵𝑎𝑠𝑒 were created.
C. Computational method
The aerodynamic analyses were performed using a compressible RANS method. An implicit flow solver was used for the entire study with second order discretization for all terms. The Green-Gauss node based discretization was used and, based on the results from 4th Drag Prediction Workshop (DPW)17, the 𝑘 − 𝜔 𝑆𝑆𝑇 turbulence model was used18. The aircraft with an installed engine was placed in the numerical domain with a size of 100𝑐
𝑟𝑒𝑓 (Fig. 6) which was adopted based on the conclusions from the drag workshop17. A pressure far-field boundary condition was used by specification of freestream Mach number of M=0.82 and static pressure and static temperature based on International Standard Atmosphere (ISA) for 35000 ft. A centreline symmetry boundary condition was used as half of the aircraft model was computed. The fan face was set to pressure outlet with a target mass-flow option and pressure inlets were used for by-pass duct entry and low pressure turbine exit. All remaining walls were modelled as viscous, adiabatic wall boundary condition. Based on the engine performance model, the engine cruise setting is characterised by the massflow capture ratio (MFCR) for the cruise condition of 0.75, the fan nozzle pressure ratio (FNPR) of 2.71 and the core nozzle pressure ratio (CNPR) of 1.37. Moreover, for the study of engine size the cruise setting for MFCR, FNPR, CNPR and combustor exit total temperature were kept constant. This resulted in an engine efflux with the same Mach number and momentum flux aimed to isolate the effect of engine size only.
Fig.5 Schematic of the Baseline engine with key stations of engine performance model marked such as fan face, by-pass duct entry, low-pressure turbine exit.
Fig. 6 The hemispherical domain for aircraft studies and close-up on the surface mesh of the through-flow nacelle
D. Gridding methods
For the clean aircraft studies, the grid independence assessment followed the approach advocated by Roche22. Based on the gridding guidelines16, a medium density structured mesh was created (“WBT0 medium” mesh) with an element count of around 10x106 elements. Four meshes were generated for the clean wing aircraft (WBT0) and the impact of spatial resolution on aircraft drag 𝐶𝐷 𝐴/𝐶 was evaluated under typical cruise conditions (𝑀∞= 0.85 and 𝐴𝑜𝐴 = 2.5°). The refinement ratio between the meshes was 1.15 in each direction. The boundary layer mesh was kept unmodified to have the same node distribution and the first cell height resulted in 𝑦+= 1 for all mesh densities. As a result, the meshes of 6.9x10⁶, 10.3x10⁶, 16.1x10⁶, and 24.1x10⁶ cells were created and referred to as “coarse”,
“medium”, “fine” and “superfine” respectively. Richardson Extrapolation23 was then conducted to estimate the grid independent solution. The aircraft drag coefficient 𝐶𝐷 𝐴/𝐶 reduced monotonically with increasing mesh size. Using a factor of safety of 1.25, the second order grid convergence index (GCI) for a medium mesh solution was 2.05% and were within the asymptotic range with a GCI aspect ratio of 0.985. At the same time the second order grid convergence index (GCI) for fine mesh solution was 1.08% and were within the asymptotic range with a GCI aspect ratio of 0.992.
For the meshes with through flow nacelles (TFN), a structured mesh with a comparable blocking strategy to the clean wing configuration was created. Additional blocking was created to accommodate the presence of through flow nacelles. The blocking around the nacelle is arranged as an o-grid concentric with the engine axis. The meshing of the TFN geometry was based on the experience from the previous studies on isolated studies19,20,21. Thus, the following criteria have been added: 40 elements for the nacelle lip, maximum axial spacing on the nacelle ∆𝑥 = 𝐿𝑛𝑎𝑐⁄110. Those criteria have been merged with the DPW4 gridding guidelines16 and the near wall treatment was facilitated with a 𝑦+= 1. In total two mesh densities were used for the aircraft with a through flow nacelle and the overall number of elements in the meshes are 22x106 and 30 x106. The meshes are called “medium”, “fine”, respectively. Also the meshes are the derivations from the clean wing meshes and the applied modifications are localised around the through-flow nacelles. On average the total drag value (𝐶𝐷 𝑡𝑜𝑡) increased by 0.2% for the fine mesh as compared with the medium mesh. To complement the research, the isolated nacelle had to be computed to enable a comparison between the nacelle with and without the presence of the wing. As a result a 7.2x10⁶ element mesh for the through-flow nacelle in isolation was created by following the ‘fine mesh’ nacelle meshing rules as for the WBT0NP mesh. The size of the domain for the isolated TFN computation was adopted based on the experience from previous studies20, 21 and it is the domain radius of 50 nacelle 𝐷
𝑚𝑎𝑥.
Furthermore, the separate jet geometry is of key interest in the current research. The intake and nacelle meshing strategy was similar to that adopted for the TFN ‘fine mesh’. The nacelle meshing guidelines were established based on previous studies24.However, the bypass duct, core duct, nozzles and core cowl required a modified blocking strategy which also facilitated the boundary layer meshes and followed. The CFD capabilities for the simulation of isolated engine configurations with separate exhaust systems were investigated by Vulgaris et al.24, based on an open source test case27, 28. A set of 2D axisymmetric computation was carried for a range of power settings for the turbine power simulator (TPS). The mesh independence study for the TPS case was conducted with three grids and a constant refinement ratio of 1.5 was used. The medium for a 2D grid has around 1.6𝑥103 cells. The obtained GCI aspect ratio was 0.999 for all the surface integrals tested such as force on the core cowl, force on the fan cowl and force on the plug. As a result, it was considered that the asymptotic range was achieved. The separate-exhaust meshing criteria were developed based on the ‘fine’ mesh density and the 3D meshing guidelines were created by introduction of circumferential node distribution. For the domain study, further proprietary studies for the separate-jet configuration indicated an increase of the engine net propulsive force by +0.0032% between 40 and 50 nacelle 𝐷𝑚𝑎𝑥 and +0.0008% between 40 and 60 nacelle 𝐷𝑚𝑎𝑥. Based on the previous experience, the meshing criteria for the separate-exhaust system were established and incorporated into the existing meshing criteria for nacelles. Moreover, the 3D engine blocking for an isolated engine with separate exhaust was created that facilitated the boundary layer blocks. The extent of the domain size was set to 50 nacelle 𝐷𝑚𝑎𝑥. As a result a mesh with 9.8 x10⁶ elements was used for an isolated baseline engine with separate exhausts and the meshing strategy is coherent with the ‘fine’ mesh resolution in the aircraft studies.
For the full engine geometry under the wing, the meshing strategy was similar to that adopted for the TFN under the wing. As for the isolated separate jet configuration, the mesh had to facilitate the boundary layer meshes for the bypass duct, core duct, nozzles and core cowl. The inclusion of the separate jet meshing rules resulted in the nominal mesh of 35 x106 elements for the configuration of CRM with engine. The mesh was derived from the fine mesh for the clean wing configuration.
E. Drag accounting methods
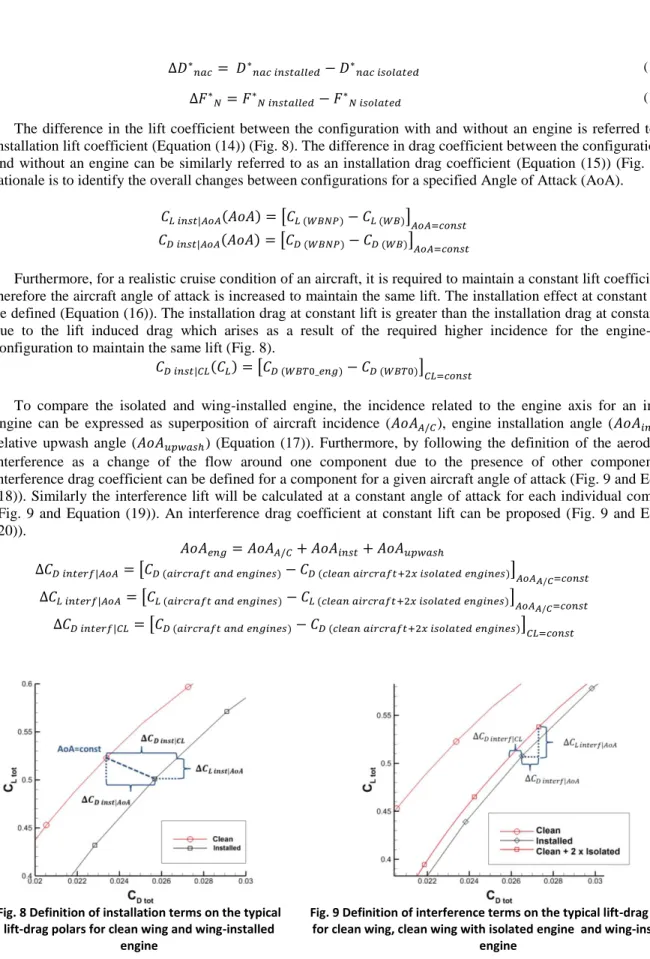
In the current work, an appropriate thrust and drag book-keeping system has to be followed20, 21, 25, 26. As a result, a modified near-field method for separate jet engines is used. The domain is split into a drag domain and thrust domain. The forces that act in the thrust domain (Fig. 7), i.e. on the inside of the streamtube, are denoted as 𝜃 and the forces in the drag domain are denoted as 𝜙. Furthermore, gauge stream forces of the flow are evaluated at characteristic engine stations from upstream to downstream infinity and are denoted 𝐹𝐺.
Fig. 7 Decomposition of modified Near Field Method forces acting on the entry streamtube and nacelle
To account for all the forces of an isolated or wing-installed engine, the Net Propulsive Force (NPF) is considered as the difference of the overall engine thrust (𝐹𝑜𝑣) and nacelle drag (𝐷𝑛𝑎𝑐) in the drag aero-axis (Equation (1)). From the balance of forces for the post-exit domain, we can substitute unknown values of 𝐹𝐺00 and 𝜙𝑝𝑜𝑠𝑡 from Equation (1) by the known terms of stream forces (𝐹𝐺9and 𝐹𝐺19) and fluid forces that act on the exhaust surfaces (𝜃𝑒𝑥ℎ𝑎𝑢𝑠𝑡). As a result, the NPF can be expressed in terms of standard net thrust (𝐹𝑁) and fluid forces exerted on exhaust surfaces (𝜃𝑒𝑥ℎ𝑎𝑢𝑠𝑡), forces on the nacelle (𝜙𝑛𝑎𝑐) and force on the pre-entry streamtube (𝜙𝑝𝑟𝑒) (Equation (2)). By the introduction of modified standard net thrust (𝐹∗
𝑁) and modified standard drag for the nacelle (𝐷∗𝑛𝑎𝑐) (Equations (3) (4)), the NPF can be expressed in terms of 𝐹∗
𝑁 and 𝐷∗𝑛𝑎𝑐 alone (Equation (5)). Furthermore, a modified drag coefficient (𝐶𝐷∗𝑛𝑎𝑐) can be defined (Equation (6)), which is used for the computation of the aircraft total drag
coefficient (Equation (7)). Similarly, a total lift coefficient for the aircraft is obtained (Equation (8)). For the coefficients, the freestream reference condition is used, where ρ is the mass density of the fluid, υ is the velocity of the fluid and 𝐴𝑟𝑒𝑓 is the aircraft reference area. To compute the balance of forces in drag aero-axis for an engine and an aircraft an overall horizontal force (𝐹𝑥′𝑖𝑛𝑠𝑡) is considered as the difference between net propulsive force (𝑁𝑃𝐹)
and airframe drag (𝐷𝐴/𝐶). To assess the overall interference effect for the wing-installed engine configuration, a superposition model (SM) of clean-wing and isolated engine is created. Within this SM estimate, the values of lift and drag of the clean-wing aircraft are summed up with the isolated engine thrust, drag and lift data at corresponding incidence. As a result the overall horizontal force of the superposition model is obtained (𝐹𝑥′𝑆𝑀). Furthermore, the aerodynamic interference 𝐹𝑖𝑛𝑡𝑒𝑟𝑓 is the difference between the installed configuration and the SM at equal overall lift force (Equation (10)). The overall aerodynamic interference consists of the individual effects of installation on the lift, drag and thrust terms. The individual effects are referred to as the airframe interference drag (Equation (11)), the engine interference drag (Equation (12)) and the interference thrust (Equation (13)).
𝑁𝑃𝐹 = 𝐹𝑜𝑣− 𝐷𝑛𝑎𝑐= 𝐹𝐺00− 𝐹𝐺0− 𝜙𝑝𝑟𝑒− 𝜙𝑛𝑎𝑐− 𝜙𝑝𝑜𝑠𝑡 (1) 𝑁𝑃𝐹= 𝐹𝑁− 𝜃𝑒𝑥ℎ𝑎𝑢𝑠𝑡− 𝜙𝑝𝑟𝑒− 𝜙𝑛𝑎𝑐 (2) 𝐷∗𝑛𝑎𝑐= 𝜙𝑝𝑟𝑒+ 𝜙𝑛𝑎𝑐 (3) 𝐹∗ 𝑁= 𝐹𝑁− 𝜃𝑒𝑥ℎ𝑎𝑢𝑠𝑡 (4) 𝑁𝑃𝐹=𝐹∗ 𝑁− 𝐷∗𝑛𝑎𝑐 (5) 𝐶𝐷∗ 𝑛𝑎𝑐= 𝐷∗ 𝑛𝑎𝑐 1 2𝜌𝜐 2𝛢 𝑟𝑒𝑓 (6) 𝐶𝐷 𝑡𝑜𝑡= 𝐶𝐷 𝐴/𝐶+ 𝐶𝐷∗ 𝑛𝑎𝑐 (7) 𝐶𝐿 𝑡𝑜𝑡= 𝐶𝐿 𝐴/𝐶+ 𝐶𝐿∗ 𝑛𝑎𝑐 (8) 𝐹𝑥′= 𝑁𝑃𝐹 − 𝐷𝐴/𝐶= 𝐹∗𝑁− 𝐷∗𝑛𝑎𝑐− 𝐷𝐴/𝐶 (9) 𝐹𝑖𝑛𝑡𝑒𝑟𝑓=𝐹𝑥′𝑖𝑛𝑠𝑡.− 𝐹𝑥′𝑆𝑀= Δ𝐹∗𝑁− Δ𝐷𝐴/𝐶− Δ𝐷∗𝑛𝑎𝑐 (10) Δ𝐷𝐴/𝐹 = 𝐷𝐴/𝐹 𝑖𝑛𝑠𝑡𝑎𝑙𝑙𝑙𝑒𝑑− 𝐷𝐴/𝐹 𝑐𝑙𝑒𝑎𝑛−𝑤𝑖𝑛𝑔 (11)
Δ𝐷∗
𝑛𝑎𝑐= 𝐷∗𝑛𝑎𝑐 𝑖𝑛𝑠𝑡𝑎𝑙𝑙𝑒𝑑− 𝐷∗𝑛𝑎𝑐 𝑖𝑠𝑜𝑙𝑎𝑡𝑒𝑑 (12)
Δ𝐹∗
𝑁= 𝐹∗𝑁 𝑖𝑛𝑠𝑡𝑎𝑙𝑙𝑒𝑑− 𝐹∗𝑁 𝑖𝑠𝑜𝑙𝑎𝑡𝑒𝑑 (13)
The difference in the lift coefficient between the configuration with and without an engine is referred to as an installation lift coefficient (Equation (14)) (Fig. 8). The difference in drag coefficient between the configuration with and without an engine can be similarly referred to as an installation drag coefficient (Equation (15)) (Fig. 8). The rationale is to identify the overall changes between configurations for a specified Angle of Attack (AoA).
𝐶𝐿 𝑖𝑛𝑠𝑡|𝐴𝑜𝐴(𝐴𝑜𝐴) = [𝐶𝐿 (𝑊𝐵𝑁𝑃)− 𝐶𝐿 (𝑊𝐵)]𝐴𝑜𝐴=𝑐𝑜𝑛𝑠𝑡 (14) 𝐶𝐷 𝑖𝑛𝑠𝑡|𝐴𝑜𝐴(𝐴𝑜𝐴) = [𝐶𝐷 (𝑊𝐵𝑁𝑃)− 𝐶𝐷 (𝑊𝐵)]𝐴𝑜𝐴=𝑐𝑜𝑛𝑠𝑡 (15) Furthermore, for a realistic cruise condition of an aircraft, it is required to maintain a constant lift coefficient and therefore the aircraft angle of attack is increased to maintain the same lift. The installation effect at constant lift can be defined (Equation (16)). The installation drag at constant lift is greater than the installation drag at constant AoA due to the lift induced drag which arises as a result of the required higher incidence for the engine-aircraft configuration to maintain the same lift (Fig. 8).
𝐶𝐷 𝑖𝑛𝑠𝑡|𝐶𝐿(𝐶𝐿) = [𝐶𝐷 (𝑊𝐵𝑇0_𝑒𝑛𝑔)− 𝐶𝐷 (𝑊𝐵𝑇0)]𝐶𝐿=𝑐𝑜𝑛𝑠𝑡 (16) To compare the isolated and wing-installed engine, the incidence related to the engine axis for an installed engine can be expressed as superposition of aircraft incidence (𝐴𝑜𝐴𝐴/𝐶), engine installation angle (𝐴𝑜𝐴𝑖𝑛𝑠𝑡) and relative upwash angle (𝐴𝑜𝐴𝑢𝑝𝑤𝑎𝑠ℎ) (Equation (17)). Furthermore, by following the definition of the aerodynamic interference as a change of the flow around one component due to the presence of other components1, an interference drag coefficient can be defined for a component for a given aircraft angle of attack (Fig. 9 and Equation (18)). Similarly the interference lift will be calculated at a constant angle of attack for each individual component (Fig. 9 and Equation (19)). An interference drag coefficient at constant lift can be proposed (Fig. 9 and Equation (20)). 𝐴𝑜𝐴𝑒𝑛𝑔= 𝐴𝑜𝐴𝐴/𝐶+ 𝐴𝑜𝐴𝑖𝑛𝑠𝑡+ 𝐴𝑜𝐴𝑢𝑝𝑤𝑎𝑠ℎ (17) Δ𝐶𝐷 𝑖𝑛𝑡𝑒𝑟𝑓|𝐴𝑜𝐴= [𝐶𝐷 (𝑎𝑖𝑟𝑐𝑟𝑎𝑓𝑡 𝑎𝑛𝑑 𝑒𝑛𝑔𝑖𝑛𝑒𝑠)− 𝐶𝐷 (𝑐𝑙𝑒𝑎𝑛 𝑎𝑖𝑟𝑐𝑟𝑎𝑓𝑡+2𝑥 𝑖𝑠𝑜𝑙𝑎𝑡𝑒𝑑 𝑒𝑛𝑔𝑖𝑛𝑒𝑠)]𝐴𝑜𝐴 𝐴/𝐶=𝑐𝑜𝑛𝑠𝑡 (18) Δ𝐶𝐿 𝑖𝑛𝑡𝑒𝑟𝑓|𝐴𝑜𝐴= [𝐶𝐿 (𝑎𝑖𝑟𝑐𝑟𝑎𝑓𝑡 𝑎𝑛𝑑 𝑒𝑛𝑔𝑖𝑛𝑒𝑠)− 𝐶𝐿 (𝑐𝑙𝑒𝑎𝑛 𝑎𝑖𝑟𝑐𝑟𝑎𝑓𝑡+2𝑥 𝑖𝑠𝑜𝑙𝑎𝑡𝑒𝑑 𝑒𝑛𝑔𝑖𝑛𝑒𝑠)]𝐴𝑜𝐴 𝐴/𝐶=𝑐𝑜𝑛𝑠𝑡 (19) Δ𝐶𝐷 𝑖𝑛𝑡𝑒𝑟𝑓|𝐶𝐿= [𝐶𝐷 (𝑎𝑖𝑟𝑐𝑟𝑎𝑓𝑡 𝑎𝑛𝑑 𝑒𝑛𝑔𝑖𝑛𝑒𝑠)− 𝐶𝐷 (𝑐𝑙𝑒𝑎𝑛 𝑎𝑖𝑟𝑐𝑟𝑎𝑓𝑡+2𝑥 𝑖𝑠𝑜𝑙𝑎𝑡𝑒𝑑 𝑒𝑛𝑔𝑖𝑛𝑒𝑠)]𝐶𝐿=𝑐𝑜𝑛𝑠𝑡 (20)
Fig. 8 Definition of installation terms on the typical lift-drag polars for clean wing and wing-installed
engine
Fig. 9 Definition of interference terms on the typical lift-drag polars for clean wing, clean wing with isolated engine and wing-installed
III.
Results
A. ValidationThe NASA CRM [10] was used as a representative modern aircraft with wing design10 for M=0.85 and 𝐶
L of 0.5. Moreover, the aerodynamics for the CRM with Through Flow Nacelles (TFN) were experimentally investigated11, 12 using a 1/37th sub-scale model at a Reynolds number of 5x10⁶. The validation section contains two parts that are the building blocks of the current research. The first part assesses the capability of CFD to determine the aerodynamics of the clean aircraft. The second part concentrates on the assessment of the installation drag.
1. Clean wing aircraft
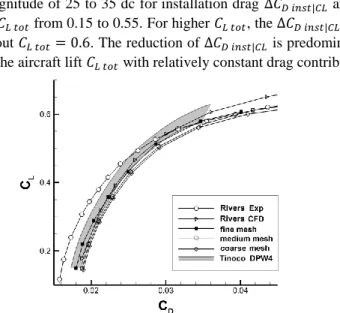
The clean aircraft (WBT0) lift-drag polar for the fine and medium meshes were compared with the experimental data as well as the results from the 4th Drag Prediction Workshop (DPW)17 (Fig. 10). At the cruise design point (𝐶𝐿= 0.5), the calculations were different by 12dc as compared with the measurements. Overall the computational results were similar to those reported at the DPW by Rivers11 and Tinoco17.
2. The effect of through-flow nacelle
To evaluate the capability of CFD in the assessment of installation drag, the clean wing aircraft (WB) and the aircraft with through flow nacelle (TFN) (WBNP) were computed. The installation of the TFN caused an increase of drag coefficient as compared with the clean-wing configuration. The computation broadly captured (Fig. 11) the magnitude of 25 to 35 dc for installation drag Δ𝐶𝐷 𝑖𝑛𝑠𝑡|𝐶𝐿 and the magnitude was roughly constant across the range of 𝐶𝐿 𝑡𝑜𝑡 from 0.15 to 0.55. For higher 𝐶𝐿 𝑡𝑜𝑡, the Δ𝐶𝐷 𝑖𝑛𝑠𝑡|𝐶𝐿 reduces rapidly beyond 𝐶𝐿 𝑡𝑜𝑡= 0.55 and equals zero at about 𝐶𝐿 𝑡𝑜𝑡= 0.6. The reduction of Δ𝐶𝐷 𝑖𝑛𝑠𝑡|𝐶𝐿 is predominantly the result of an increased contribution of the TFN to the aircraft lift 𝐶𝐿 𝑡𝑜𝑡 with relatively constant drag contribution to 𝐶𝐷 𝑡𝑜𝑡 at higher aircraft incidence.
Fig. 10 Computational drag polar for a clean wing CRM (WBT0) for ‘coarse mesh’, ‘medium mesh’ and ‘fine mesh’ compared with computational data for rigid geometry by Rivers et al.11; all data compared with measurements11. Band
of structured-mesh solutions from 4th Drag Prediction Workshop marked in grey17.
Fig. 11 Installation drag coefficient ( ∆𝑪𝑫 𝒊𝒏𝒔𝒕|𝑪𝑳) for CRM WB
and WBNP subscale as function of lift coefficient; comparison between CFD medium mesh and experimental data by Rivers et al.11 for Mach number of 0.85
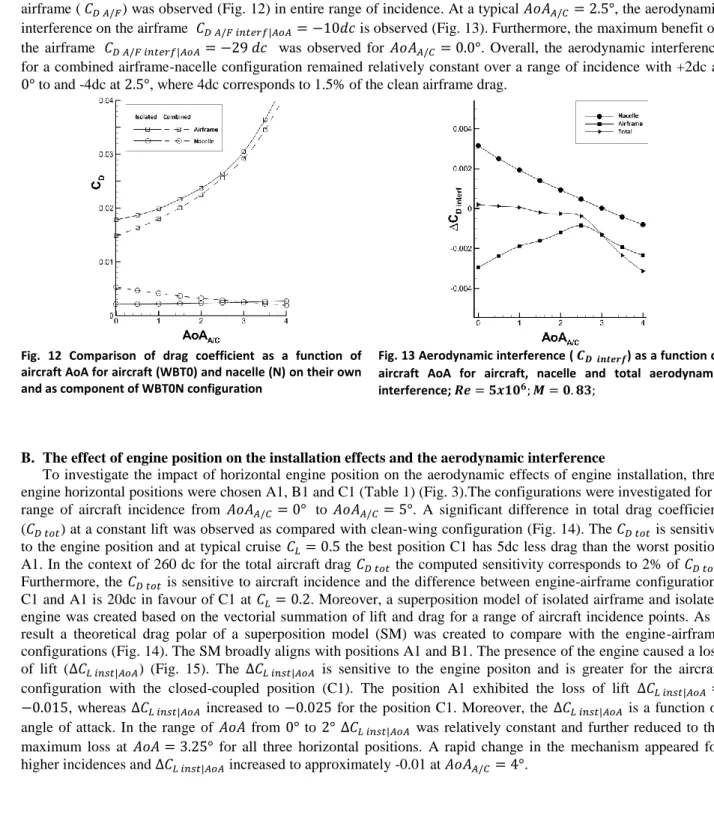
To evaluate aerodynamic interference (Equation (19)), a computation of the clean aircraft, the aircraft with a TFN but no pylon (WBT0N) and the isolated TFN was performed at 𝑅𝑒 = 5𝑥106 and 𝑀 = 0.83. The comparison of these configurations was done (Fig. 12) for a common aircraft angle of attack. In the WBT0N configuration, the nacelle installation angle was 𝐴𝑜𝐴𝑖𝑛𝑠𝑡= 1.5° and the up-wash angle was relatively small at 𝐴𝑜𝐴𝑢𝑝𝑤𝑎𝑠ℎ = −0.2°. The drag for two isolated nacelles is moderately sensitive to incidence (Fig. 12) and at typical cruise condition of 𝐴𝑜𝐴𝐴/𝐶= 2.5° the nacelle drag is 25 dc, which is approximately 9.5% of clean airframe drag. The installation of the TFN under the wing resulted in detrimental effect of the aerodynamic interference (Fig. 13) on the nacelle. At 𝐴𝑜𝐴𝐴/𝐶= 2.5° the penalty (𝐶𝐷 𝑛𝑎𝑐 𝑖𝑛𝑡𝑒𝑟𝑓|𝐴𝑜𝐴) was +5𝑑𝑐 (Fig. 13). The 𝐶𝐷 𝑛𝑎𝑐 𝑖𝑛𝑡𝑒𝑟𝑓|𝐴𝑜𝐴 is sensitive to incidence and the maximum penalty of +32dc was noted at 𝐴𝑜𝐴𝐴/𝐶= 0°. Moreover, a beneficial change in drag coefficient for the
airframe ( 𝐶𝐷 𝐴/𝐹) was observed (Fig. 12) in entire range of incidence. At a typical 𝐴𝑜𝐴𝐴/𝐶= 2.5°, the aerodynamic interference on the airframe 𝐶𝐷 𝐴/𝐹 𝑖𝑛𝑡𝑒𝑟𝑓|𝐴𝑜𝐴= −10𝑑𝑐 is observed (Fig. 13). Furthermore, the maximum benefit on the airframe 𝐶𝐷 𝐴/𝐹 𝑖𝑛𝑡𝑒𝑟𝑓|𝐴𝑜𝐴= −29 𝑑𝑐 was observed for 𝐴𝑜𝐴𝐴/𝐶 = 0.0°. Overall, the aerodynamic interference for a combined airframe-nacelle configuration remained relatively constant over a range of incidence with +2dc at 0° to and -4dc at 2.5°, where 4dc corresponds to 1.5% of the clean airframe drag.
Fig. 12 Comparison of drag coefficient as a function of aircraft AoA for aircraft (WBT0) and nacelle (N) on their own and as component of WBT0N configuration
Fig. 13 Aerodynamic interference ( 𝑪𝑫 𝒊𝒏𝒕𝒆𝒓𝒇) as a function of
aircraft AoA for aircraft, nacelle and total aerodynamic interference; 𝑹𝒆 = 𝟓𝒙𝟏𝟎𝟔; 𝑴 = 𝟎. 𝟖𝟑;
B. The effect of engine position on the installation effects and the aerodynamic interference
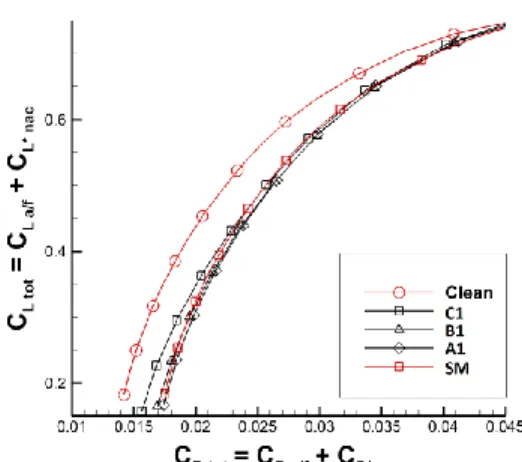
To investigate the impact of horizontal engine position on the aerodynamic effects of engine installation, three engine horizontal positions were chosen A1, B1 and C1 (Table 1) (Fig. 3).The configurations were investigated for a range of aircraft incidence from 𝐴𝑜𝐴𝐴/𝐶= 0° to 𝐴𝑜𝐴𝐴/𝐶= 5°. A significant difference in total drag coefficient (𝐶𝐷 𝑡𝑜𝑡) at a constant lift was observed as compared with clean-wing configuration (Fig. 14). The 𝐶𝐷 𝑡𝑜𝑡 is sensitive to the engine position and at typical cruise 𝐶𝐿= 0.5 the best position C1 has 5dc less drag than the worst position A1. In the context of 260 dc for the total aircraft drag 𝐶𝐷 𝑡𝑜𝑡 the computed sensitivity corresponds to 2% of 𝐶𝐷 𝑡𝑜𝑡. Furthermore, the 𝐶𝐷 𝑡𝑜𝑡 is sensitive to aircraft incidence and the difference between engine-airframe configurations C1 and A1 is 20dc in favour of C1 at 𝐶𝐿= 0.2. Moreover, a superposition model of isolated airframe and isolated engine was created based on the vectorial summation of lift and drag for a range of aircraft incidence points. As a result a theoretical drag polar of a superposition model (SM) was created to compare with the engine-airframe configurations (Fig. 14). The SM broadly aligns with positions A1 and B1. The presence of the engine caused a loss of lift (Δ𝐶𝐿 𝑖𝑛𝑠𝑡|𝐴𝑜𝐴) (Fig. 15). The Δ𝐶𝐿 𝑖𝑛𝑠𝑡|𝐴𝑜𝐴 is sensitive to the engine positon and is greater for the aircraft configuration with the closed-coupled position (C1). The position A1 exhibited the loss of lift Δ𝐶𝐿 𝑖𝑛𝑠𝑡|𝐴𝑜𝐴= −0.015, whereas Δ𝐶𝐿 𝑖𝑛𝑠𝑡|𝐴𝑜𝐴 increased to −0.025 for the position C1. Moreover, the Δ𝐶𝐿 𝑖𝑛𝑠𝑡|𝐴𝑜𝐴 is a function of angle of attack. In the range of 𝐴𝑜𝐴 from 0° to 2°Δ𝐶𝐿 𝑖𝑛𝑠𝑡|𝐴𝑜𝐴 was relatively constant and further reduced to the maximum loss at 𝐴𝑜𝐴 = 3.25° for all three horizontal positions. A rapid change in the mechanism appeared for higher incidences and Δ𝐶𝐿 𝑖𝑛𝑠𝑡|𝐴𝑜𝐴 increased to approximately -0.01 at 𝐴𝑜𝐴𝐴/𝐶 = 4°.
Fig. 14 Lift-drag polar for CRM aircraft without (Clean) and with engines (C1/B1/A1), compared with drag polar created as superposition (SM) of clean wing and isolated engines data (SM); 𝑹𝒆 = 𝟒𝟓𝒙𝟏𝟎𝟔; 𝑴 = 𝟎. 𝟖𝟐;
Fig. 15 Loss of lift (𝑪𝑳 𝒊𝒏𝒔𝒕|𝑨𝒐𝑨) between configuration with
engines (A1/B1/C1) and the clean wing configuration, calculated at constant angle of attack;
𝑹𝒆 = 𝟒𝟓𝒙𝟏𝟎𝟔; 𝑴 = 𝟎. 𝟖𝟐;
The loss of lift on the wing has a substantial impact on the overall aircraft performance. The loss of lift for a configuration has to be compensated for by re-trimming the aircraft. Therefore, the drag comparison between the positions is done at constant lift. The results clearly indicate a penalty of installation (Δ𝐶𝐷 𝑖𝑛𝑠𝑡|𝐶𝐿) (Equation (16) and Fig. 16) with magnitude of 43.4 dc, 43dc and 37 dc for A1, B1 and C1 position respectively at a typical cruise lift coefficient 𝐶𝐿 𝑡𝑜𝑡= 0.5. In context of the overall aircraft drag (𝐶𝐷 𝑡𝑜𝑡), the installation penalties contribute to the 𝐶𝐷 𝑡𝑜𝑡 by 16.4%, 16.2% and 14% for positions A1, B1, and C1 respectively. As compared with the drag of an isolated engine (𝐶𝐷∗𝑛𝑎𝑐), the position C1 has the same drag as an isolated engine and positions A1 and B1 exhibit approximately +6dc more drag as a result of aerodynamic interference. At high incidence the reduction of Δ𝐶𝐷 𝑖𝑛𝑠𝑡|𝐶𝐿 is the result of an increased relative contribution of the nacelle to the aircraft lift 𝐶𝐿 𝑡𝑜𝑡 with a relatively constant drag contribution to 𝐶𝐷 𝑡𝑜𝑡. Overall, the results from the drag domain clearly indicate that the sensitivity of installation drag to engine axial position is in order of 2.4% of 𝐶𝐷 𝑡𝑜𝑡.
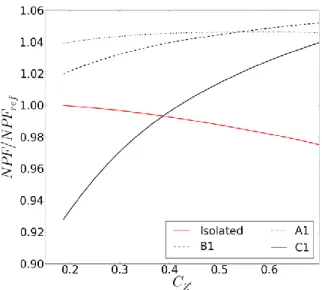
The installation of the engine at different positions had a significant effect on the net propulsive force (NPF) (Equation (5)). The NPF considered all the forces that acted on the engine both in the drag (𝐷𝑒𝑛𝑔∗ ) and in the thrust domain (𝐹𝑁∗). In this context, the balance between the thrust and drag force in the aero-axes coordinate system was considered for wing-installed engines (Fig. 17). Moreover, the aircraft lift force (𝐶𝐿 𝑡𝑜𝑡) was corrected by the vertical component of thrust and therefore an coefficient for overall lift force is used (𝐶𝑍′). To compare the combined
wing-installed engines with the isolated engine for a specific 𝐶𝑍′, a simple superposition model of clean wing airframe
and isolated engine was created. The superposition model is a vectorial summation of the lift, drag and thrust data of a clean-wing aircraft and two isolated engines for each aircraft incidence (𝐴𝑜𝐴𝐴/𝐶). As a result, a comparison between wing-installed engines and isolated engine for a range of 𝐶𝑍′ is considered. To highlight the relative
change in NPF, the results in this section (Fig. 17) are non-dimensionalised by the reference net propulsive force (𝑁𝑃𝐹𝑟𝑒𝑓 = 52947𝑁) and is considered at the nominal installed engine condition of 𝐴𝑜𝐴𝑒𝑛𝑔 = +1.75°. The equivalent aircraft condition is 𝐴𝑜𝐴𝐴/𝐶= 0° and 𝐶𝑍′= 0.18. The overall benefit in the net propulsive force (Fig. 17) was the result of a reduction in the engine drag (𝐷𝑒𝑛𝑔∗ ) and the increase in the modified standard net thrust (𝐹𝑁∗) due to the pressure-field of the wing that acted on the core cowl and plug. Moreover, the presence of the wing results in a benefit as compared with isolated engine. The magnitude of the beneficial effect on the net propulsive force increases from 2.8% for position C1 to approximately 6% for position A1 at 𝐶𝑍′= 0.5. It has to be noted that the
NPF presents only the engine perspective of installation and does not include the penalty on the airframe. Overall, there are four installation effects that were determined: loss of lift, reduction in nacelle drag (𝐷𝑒𝑛𝑔∗ ) and increase in airframe drag (𝐷𝐴/𝐹) and increase in engine thrust (𝐹𝑁∗). There is a need to develop a system that combines and compares the effects of installation and compares the aircraft configuration at constant lift.
Fig. 16 Interpolated installation drag (𝚫𝑪𝑫 𝒊𝒏𝒔𝒕 |𝑪𝑳) for
configurations with engines (A1/B1/C1) with every 10 symbol displayed; calculated at constant lift coefficient
(𝑪𝑳 𝒕𝒐𝒕); compared with isolated engine modified drag
(𝑪𝑫∗ 𝒏𝒂𝒄); 𝑹𝒆 = 𝟒𝟓𝒙𝟏𝟎𝟔; 𝑴 = 𝟎. 𝟖𝟐;
Fig. 17 Net Propulsive Force for three installed configurations (A1/B1/C1) compared with isolated engine;
𝑹𝒆 = 𝟒𝟓𝒙𝟏𝟎𝟔; 𝑴 = 𝟎. 𝟖𝟐;
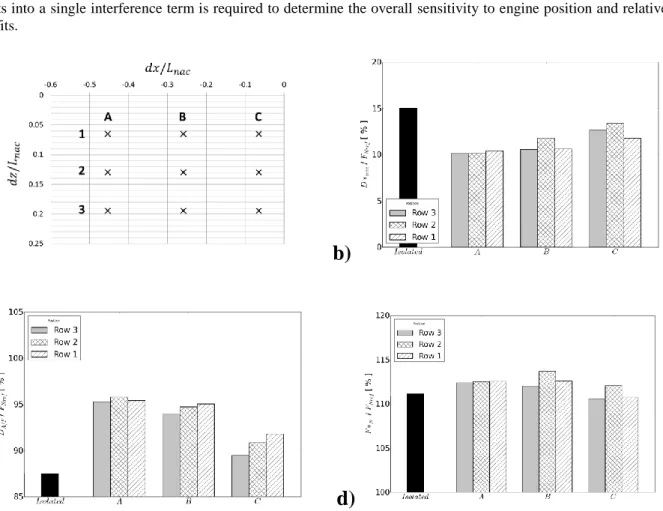
To assess the relative impact of the aerodynamic interference on all engine positions (Table 1) (Fig. 18a)), a single point analysis at cruise condition was performed. The cruise operating point was chosen at an overall lift coefficient 𝐶𝑍′= 0.5. To enable a comparison between the drag and thrust forces, all the results were
non-dimensionalised by the value of standard net thrust of an isolated engine at the incidence and Mach number (𝐹𝑁 𝑟𝑒𝑓= 54028 𝑁) and presented as a percentage fraction. The installation of the engine improved the modified nacelle drag (𝐷𝑛𝑎𝑐∗ ) significantly (Fig. 18b)) and the 𝐷𝑛𝑎𝑐∗ /𝐹𝑁 𝑟𝑒𝑓 reduced from approximately 15% for an isolated engine to a value between 10 and 13% when installed depending on engine position. Furthermore, the reduction is sensitive to the engine position and the lowest values of 𝐷𝑛𝑎𝑐∗ are noted for A3 position with 10%. The location of the engine in the horizontally closer position to the wing resulted in an increase of the 𝐷𝑛𝑎𝑐∗ /𝐹𝑁 𝑟𝑒𝑓 from 10% for A3 to approximately 12.6% for position C3. The increase of 𝐷𝑛𝑎𝑐∗ by reduction of axial distance was observed in all three rows “1”, “2” and “3”. The maximum 𝐷𝑛𝑎𝑐∗ /𝐹𝑁 𝑟𝑒𝑓 is reported for position C2 and equals 13.3%.
To compare the effect of engine installation on the airframe drag (Fig. 18c)), the airframe drag (𝐷𝐴/𝐹) of the clean wing configuration was compared with the 𝐷𝐴/𝐹 for each of the investigated positions. The presence of the engine under the wing had a detrimental effect on the airframe aerodynamics. The 𝐷𝐴/𝐹 contribution increased from approximately 87% for clean-wing to a value between 89.5% for position C3 and 95.8% for position A2. As for the positions nearest to the wing axially (column C), the 𝐷𝐴/𝐹 values are lowest from the entire dataset and the (𝐷𝐴/𝐹/ 𝐹𝑁 𝑟𝑒𝑓) increases by 2.3% over the entire vertical range as the engine is moved upward closer to the wing from C3 to C1. A similar trend is observed for the vertical positions B, where the 𝐷𝐴/𝐹 contribution increases by 1.2% over the entire vertical range as the engine is moved from B3 to B1. It is only the furthest column A, where there is little sensitivity to the engine vertical position and all positions have the (𝐷𝐴/𝐹/𝐹𝑁 𝑟𝑒𝑓) with an average of 95.5%.
To complement the analysis of forces, the comparison of the modified thrust (𝐹𝑁∗/𝐹𝑁 𝑟𝑒𝑓) for wing-installed engines with the isolated engine was performed (Fig. 18d)). The modified thrust (𝐹𝑁∗) of an isolated engine is larger than the standard net thrust (𝐹𝑁) due to the higher than ambient base pressure that acts on the core cowl and plug. For the baseline engine the 𝐹𝑁∗ is 111.1% 𝐹𝑁 𝑟𝑒𝑓. The installation of the engine under the wing resulted in an increase of 𝐹𝑁∗/𝐹𝑁 𝑟𝑒𝑓 at cruise condition in comparison to isolated engine, as a forward oriented force is exerted by the wing pressure-field on the surfaces of the core cowl and plug. Overall little sensitivity to changes in vertical position is observed with maximum of 1.7% between position B2 and B3.
Overall, it is notable that the effect on the airframe and the nacelle are the counteracting effects, and the airframe penalty opposed the benefits observed for the nacelle drag. Moreover, as the horizontal displacement of the engine increased, the wing-pressure field acted more on the exhaust section for columns A and B. The modest effect on the thrust in column C is explained by an overlap of the exhaust with the wing and as a result the exhaust is exposed to broadly neutral pressure-field of the wing. Due to the presence of three competing terms, a summation of individual effects into a single interference term is required to determine the overall sensitivity to engine position and relative benefits.
a)
b)
c)
d)
Fig. 18 Comparison of a) nacelle modified drag b) airframe drag c) engine thrust between engine-aircraft configurations and superposition model (Isolated) for all engine positions; 𝑹𝒆 = 𝟒𝟓𝒙𝟏𝟎𝟔; 𝑴 = 𝟎. 𝟖𝟐; 𝑪
𝒛′= 𝟎. 𝟓
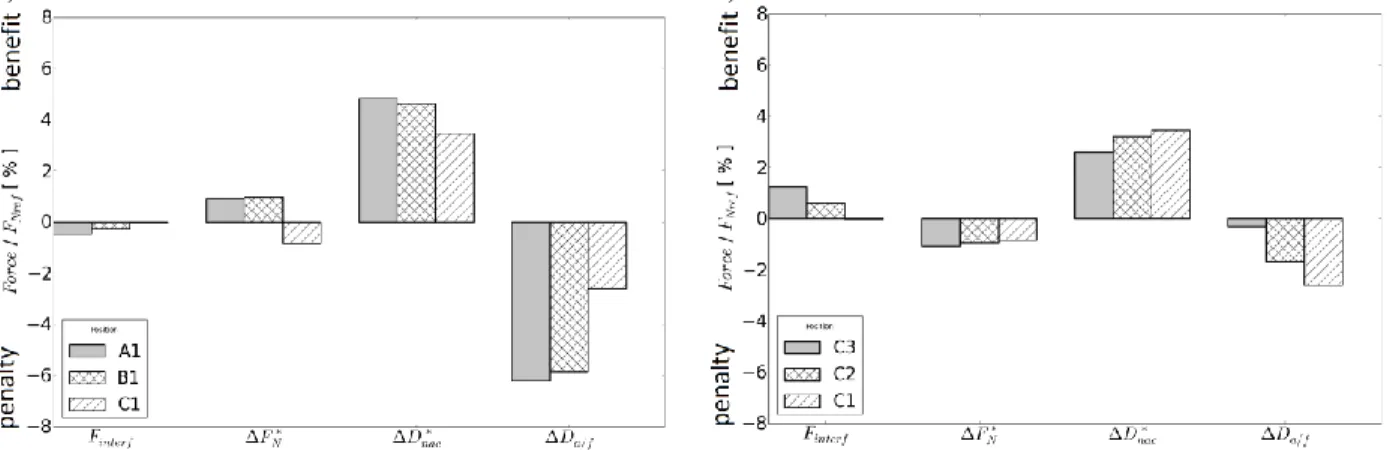
To solely concentrate on the aerodynamic interference, the interference terms for the airframe drag (Δ𝐷𝐴/𝐹, Equation (11)), modified nacelle drag (Δ𝐷𝑛𝑎𝑐∗ Equation (12)) and modified thrust (Δ𝐹𝑁∗, Equation (13)) were calculated for each position. To analyse the sensitivity of the break-down of the overall interference (𝐹𝑖𝑛𝑡𝑒𝑟𝑓) to the engine horizontal displacement, three engine positions in row “1” were chosen, namely A1, B1 and C1 (Fig. 19a)). Even though, the Δ𝐷𝑛𝑎𝑐∗ increases from 3.5% of 𝐹𝑁 𝑟𝑒𝑓 to almost 4.8% benefit as the engine is moved from C1 to A1, the detrimental reaction on the airframe (Δ𝐷𝐴/𝐹) balances out the benefit with a penalty of -2.6% of 𝐹𝑁 𝑟𝑒𝑓 at C1 and -6% at A1. Moreover, as there is an overlap of the exhaust system with the wing for the configuration C1, a detrimental effect of -0.8% in thrust is observed. For the engine position further from the wing, the benefit in thrust interference reached 1% for both A1 and B1. Overall, the installation of the engine under the wing results in an overall slightly detrimental interference of roughly -0.5% for position A1 and neutral interference for C1.
Furthermore, a greater impact of the overall interference (𝐹𝑖𝑛𝑡𝑒𝑟𝑓) is observed for a range of vertical positions in column C (Fig. 19b)). As the engine is moved further away from the wing, the beneficial 𝐹𝑖𝑛𝑡𝑒𝑟𝑓 increased from 0% for C1 to 1.5% for C3. Due to the partial overlap of the engine with the wing the external parts of the exhaust are not
exposed to the positive pressure-field generated at the wing leading edge. As a result, the Δ𝐹𝑁∗ is detrimental and remains relatively insensitive to the vertical position of the engine with an average value of -0.9%. The Δ𝐷𝑛𝑎𝑐∗ is modestly sensitive to the vertical position with a 1% increase over the entire range as engine is moved closer to the wing from C3 to C1. However, the Δ𝐷𝐴/𝐹 is very sensitive to the vertical position and it increases from 0.3% to -1.6% to -2.6% for positions C3, C2 and C1 respectively. Overall, the position C3 presents the best overall interference terms, which is dictated by the strongest buoyance force on the nacelle afterbody, but minimised penalty on the airframe side.
a) b)
Fig. 19 Break down of the overall interference force into the interference in to the modified thrust (𝑭𝑵∗), modified nacelle
drag (𝑫𝒏𝒂𝒄∗ ), airframe drag (𝑫𝑨/𝑭) for a range of a) horizontal positions in row “1” and b) range of vertical positions in
column C ; 𝑹𝒆 = 𝟒𝟓𝒙𝟏𝟎𝟔; 𝑴 = 𝟎. 𝟖𝟐; 𝑪 𝒛′= 𝟎. 𝟓
To indicate the sensitivities of the interference effects, spatial maps of individual interference effects were created based on the nine engine positions (Fig. 20) with use of natural neighbor interpolation based on Delaunay triangulation. It has to be noted, that nine points are insufficient to create detailed contours, however, the visualization was considered helpful to understand the key sensitivities at preliminary design stage of the engine installation system. The results were presented as relative to the baseline position C3. By repositioning the engine from the baseline C3 position, the nacelle drag interference (Δ𝐷𝑛𝑎𝑐∗ ) was predominantly sensitive to the horizontal position (Fig. 20 a), however the trend changes for the further positions (column A) and the Δ𝐷𝑛𝑎𝑐∗ was equally sensitive to the vertical and horizontal engine displacement but the rate of change was significantly reduced from +1.2% per 𝑑𝑥/𝐿𝑛𝑎𝑐= 0.2 to +0.5% per 𝑑𝑥/𝐿𝑛𝑎𝑐= 0.2. The (Δ𝐷𝐴/𝐹) (Fig. 20 b) has an adverse sensitivity to engine position as compared with the nacelle interference. The best position for the Δ𝐷𝐴/𝐹) is C3 and worst is A1. Furthermore, as for the interference on thrust terms (Δ𝐹𝑁∗) (Fig. 20 c), it was determined that position B1 was the best. It is explained by no overlap of the exhaust system with the wing as in column C and also by a stronger pressure-field effect than column A. The vertical proximity of the wing to the exhaust intensifies the strength of beneficial force for positon B1 as compared with B2. Overall, position B1 has the highest beneficial Δ𝐹𝑁∗, position C3 has lowest detrimental Δ𝐷𝐴/𝐹 and the position A3 presents the best beneficial Δ𝐷𝑛𝑎𝑐∗ . To determine the best engine position in terms of the overall interference (𝐹𝑖𝑛𝑡𝑒𝑟𝑓) a stack-up of the discussed effects was performed (Fig. 20 d). The position C3 was found to preform best with +1.2% of a beneficial effect as compared with the superposition model. All the other positions were presented as relative to the position C3 to clearly indicate the relative sensitivity in form of a map (Fig. 20 d). A clear trend along the C3-A1 diagonal is observed. Movement of the engine closer to the wing vertically or further axially was detrimental as compared with position C3. The worst position is A2 and it is worse by approximately -1.75% of reference thrust.
Moreover, to help in the evaluation of installation effects at a preliminary-design stage of the engine development, a force stack-up was performed (Fig. 21). The stack-up starts from a value of standard net thrust for an isolated engine (𝐹𝑁 𝑖𝑠𝑜) at cruise condition 𝑀 = 0.82, 𝐶𝑍′= 0.5. Furthermore, the effect of pressure and viscous forces on the exhaust system (+𝜃𝑒𝑥ℎ𝑎𝑢𝑠𝑡) is added to obtain the modified standard net thrust (𝐹𝑁∗). Furthermore, the modified drag of the nacelle was included (𝐷𝑛𝑎𝑐∗ ) and the net propulsive force (NPF) (Equation (5)) of isolated engine at cruise condition was obtained. It was noted that 𝐹𝑁∗ was +11.1% greater than 𝐹𝑁 𝑖𝑠𝑜. However, the effect of -15% for the 𝐷𝑛𝑎𝑐∗ had to be included to obtain the NPF. As a result, for this example, the NPF is -3.9% lower than the standard
net thrust. Furthermore, to include the interference terms due to the installation onto the aircraft, the interference for thrust (Δ𝐹𝑁∗), modified nacelle drag (Δ𝐷𝑛𝑎𝑐∗ ) and airframe drag (Δ𝐷𝐴/𝐹) are added and the sensitivity to the engine position is considered (Fig. 21). Even though some positions gain a substantial benefit from the combined Δ𝐹𝑁∗ and Δ𝐷𝑛𝑎𝑐∗ terms, it is strongly offset by Δ𝐷𝐴/𝐹 to then determine the overall result. For example, the overall best position C3 presents modest benefits on both thrust and nacelle drag terms, however it is the low interference on the airframe term that determines the final result. Overall, the resultant force that acts on the airframe is sensitive to engine position and the range is 1.8% depending on engine location. The final force for position C3 is -2.6% worse than the standard net thrust and +1.25% better than the NPF of the isolated engine at cruise condition. It is determined that, the under-wing installation caused substantial reduction in 𝐷𝑛𝑎𝑐∗ in relation to the isolated engine as a result of the beneficial push from the pressure-field of the wing. However, the Δ𝐷𝐴/𝐹 was highlighted as the main factor that determined the performance of some of the engine-aircraft configurations. The engine positions prone to the large values of airframe interference were located further upstream of the wing and at higher vertical position.
a)
b)
c)
d)
Fig. 20 Sensitivity to engine vertical and horizontal position for a) modified nacelle drag (𝑫𝒏𝒂𝒄∗ ), b) airframe drag (𝑫𝑨/𝑭) and
Fig. 21 Stack-up of forces: standard net thrust of isolated engine at cruise (𝑭𝑵 𝒊𝒔𝒐|𝑪𝑳=𝟎.𝟓) plus the effect of exhaust forces
(+𝜽𝒆𝒙𝒉𝒂𝒖𝒔𝒕), nacelle drag (+𝑫𝒏𝒂𝒄∗ ), and detailed interference effects (𝚫𝑭𝑵∗ / 𝚫𝑫𝒏𝒂𝒄∗ / 𝚫𝑫𝑨/𝑭); 𝑹𝒆 = 𝟒𝟓𝒙𝟏𝟎𝟔; 𝑴 = 𝟎. 𝟖𝟐;
𝑪𝒛′= 𝟎. 𝟓
C. The Effect of engine size on installation effects and aerodynamic interference
To evaluate the impact of engine size on the installation effects, a simple geometrically scaled engine geometry was applied to the Baseline engine (𝐷𝐹𝐹 𝐵𝑎𝑠𝑒). Two larger engine sizes were created with 1.23𝐷𝐹𝐹 𝐵𝑎𝑠𝑒 and 1.46𝐷𝐹𝐹 𝐵𝑎𝑠𝑒 scales (Fig. 22). The engines were tested in position C3 under the wing and the trailing edge position of the top of the fan cowl was kept constant. As a result, an increase of engine size causes an increase of loss of lift and an increase of installation drag (Fig. 23).
Fig. 22 Sketch of three engine sizes under the wing; Baseline
(𝑫𝑭𝑭 𝑩𝒂𝒔𝒆) and 1.23𝑫𝑭𝑭 𝑩𝒂𝒔𝒆 and 1.46𝑫𝑭𝑭 𝑩𝒂𝒔𝒆
Fig. 23 Lift-drag polar for CRM aircraft without (Clean) and with engines (Baseline, 1.23𝑫𝑭𝑭 𝑩𝒂𝒔𝒆 and 1.46𝑫𝑭𝑭 𝑩𝒂𝒔𝒆),
compared with drag polar of clean-wing; 𝑹𝒆 = 𝟒𝟓𝒙𝟏𝟎𝟔; 𝑴 = 𝟎. 𝟖𝟐;
The presence of different size engines affected the overall loss of lift Δ𝐶𝐿 𝑖𝑛𝑠𝑡|𝐴𝑜𝐴 (Fig. 24) (Equation (14)). The smallest engine ‘Baseline’ has the Δ𝐶𝐿 𝑖𝑛𝑠𝑡|𝐴𝑜𝐴 of broadly −0.02 across the range of AoA from 0° to 2.5°. As compared with the baseline engine the loss for the 1.23𝐷𝐹𝐹 𝐵𝑎𝑠𝑒 and 1.46𝐷𝐹𝐹 𝐵𝑎𝑠𝑒 engines increased to Δ𝐶𝐿 𝑖𝑛𝑠𝑡|𝐴𝑜𝐴 of −0.032 and −0.05, respectively. Moreover, the Δ𝐶𝐿 𝑖𝑛𝑠𝑡|𝐴𝑜𝐴 is a function of angle of attack. In the range of incidences (𝐴𝑜𝐴) from 0° to 2° the Δ𝐶𝐿 𝑖𝑛𝑠𝑡|𝐴𝑜𝐴 is relatively constant for all three sizes. It is at 𝐴𝑜𝐴 = 3,25°, where all three engine sizes present the maximum loss of lift.
Furthermore, to evaluate the drag penalty compared at equal lift the installation drag coefficient at constant lift (Δ𝐶𝐷 𝑖𝑛𝑠𝑡|𝐶𝐿) (Equation (16)) was used (Fig. 25). The results indicate that Δ𝐶𝐷 𝑖𝑛𝑠𝑡|𝐶𝐿 has its peak at 𝐶𝐿 𝑡𝑜𝑡= 0.6 with a magnitude of 33dc for the Baseline engine. Moreover, two larger engines also have the peak Δ𝐶𝐷 𝑖𝑛𝑠𝑡|𝐶𝐿 at 𝐶𝐿 𝑡𝑜𝑡= 0.6 and the Δ𝐶𝐷 𝑖𝑛𝑠𝑡|𝐶𝐿 is 47dc and 72dc for the engine scaled by 1,23 and 1.46 respectively. The Δ𝐶𝐷 𝑖𝑛𝑠𝑡|𝐶𝐿 for the full combined engine-aircraft system was compared with the engine drag (𝐷𝑛𝑎𝑐∗ ) for two isolated engines. The isolated engine drag 𝐶𝐷∗𝑛𝑎𝑐 was 38, 57 and 79 dc at a typical cruise 𝐶𝐿 𝑡𝑜𝑡= 0.5 for the baseline engine and 1,23 and
1.46 scales respectively. The observed interference benefits for the three engines were 3dc 10dc and 10 dc at 𝐶𝐿 𝑡𝑜𝑡= 0.5. Furthermore, to appreciate the combination of all the installation effects, a more detailed interference analysis with forces stack-up was performed.
Fig. 24 Interpolated loss of lift (𝑪𝑳 𝒊𝒏𝒔𝒕|𝑨𝒐𝑨) between
configuration with engines (Baseline, 1.23𝑫𝑭𝑭 𝑩𝒂𝒔𝒆 and
1.46𝑫𝑭𝑭 𝑩𝒂𝒔𝒆) and the clean wing configuration, calculated at
constant angle of attack; 𝑹𝒆 = 𝟒𝟓𝒙𝟏𝟎𝟔; 𝑴 = 𝟎. 𝟖𝟐;
Fig. 25 Installation drag (𝚫𝑪𝑫 𝒊𝒏𝒔𝒕 |𝑪𝑳) between configuration
with engines (Baseline, 1.23𝑫𝑭𝑭 𝑩𝒂𝒔𝒆 and 1.46𝑫𝑭𝑭 𝑩𝒂𝒔𝒆) and
the clean wing configuration, calculated at constant lift coefficient; compared with isolated engine modified drag (𝑪𝑫∗); 𝑹𝒆 = 𝟒𝟓𝒙𝟏𝟎𝟔; 𝑴 = 𝟎. 𝟖𝟐;
To investigate the impact of engine size on the installation effects, a more detailed single point analysis at cruise condition was performed based on the interference terms (Δ𝐹𝑁∗, Δ𝐷𝑛𝑎𝑐∗ , Δ𝐷𝐴/𝐹 ) (Fig. 26). The cruise operating point was chosen at the steady state flight condition of a superposition model of the baseline engine. The overall lift coefficient obtained is 𝐶𝑧′= 0.5 at M=0.82. To isolate the effect of the geometric scaling, constant values of the total pressure and total temperature were used for the jet regardless the engine size. As a result the standard net thrust increases broadly proportionally with engine fan area. The aim of the comparison is to determine the magnitude of interference effects for different size engines. Therefore, the results for an engine of each size were non-dimensionalised by a respective reference thrust 𝐹𝑁 𝑟𝑒𝑓 = 54028 𝑁 of the baseline engine at cruise condition.
Fig. 26 Break down of the overall interference force into the interference in to the modified thrust (𝑭𝑵∗), modified nacelle
drag (𝑫𝒏𝒂𝒄∗ ), airframe drag (𝑫𝑨/𝑭) for a three engine sizes Baseline, x1.23 and x1.46; 𝑹𝒆 = 𝟒𝟓𝒙𝟏𝟎𝟔; 𝑴 = 𝟎. 𝟖𝟐; 𝑪𝒛′= 𝟎. 𝟓
The overall interference broadly scales with size and greater interference benefits are observed for larger engines. As compared with +1.5% benefit for the baseline engine (𝐷𝐹𝐹 𝐵𝑎𝑠𝑒), the two larger engines exhibited +3.09% and +4.7% for the 1.23𝐷𝐹𝐹 𝐵𝑎𝑠𝑒 and 1.46𝐷𝐹𝐹 𝐵𝑎𝑠𝑒 configurations, respectively. However, the break-down of the overall interference is different and depends on the engine size. The Δ𝐷𝑛𝑎𝑐∗ is a beneficial force for all three engine sizes and the benefit broadly scaled with engine size. The beneficial contribution of +2.3% increased to roughly +3.2% for the size of 1.23𝐷𝐹𝐹 𝐵𝑎𝑠𝑒 and +5.5% for 1.46𝐷𝐹𝐹 𝐵𝑎𝑠𝑒. However, the significant benefit for large size engine is observed in the effect of interference on airframe drag (Δ𝐷𝐴/𝐹). The detrimental effect of -0.3% for the Baseline engine changed to roughly +1.9% for 1.23𝐷𝐹𝐹 𝐵𝑎𝑠𝑒 and 4.2% for 1.46𝐷𝐹𝐹 𝐵𝑎𝑠𝑒. The Δ𝐹𝑁∗ was determined as -0.5% for baseline engine. The 1.23𝐷𝐹𝐹 𝐵𝑎𝑠𝑒 engine exhibited a penalty of -2% and it is explained by the greater overlap of the exhaust with the wing as the exhaust was scaled proportionally with the fixed geometric point at the nacelle trailing edge. The largest engine 1.46𝐷𝐹𝐹 𝐵𝑎𝑠𝑒 has the greatest exhaust overlap with the wing and -5.5% effect on Δ𝐹𝑁∗. Furthermore, a stack-up of forces was performed to identify the overall outcome of the installation effects as compared with the isolated engine thrust and drag (Fig. 27).
Fig. 27 Stack-up of forces for three engine sizes in baseline position C3; standard net thrust of isolated engine at cruise
(𝑭𝑵 𝒊𝒔𝒐|𝑪𝑳=𝟎.𝟓) plus the effect of exhaust forces (+𝜽𝒆𝒙𝒉𝒂𝒖𝒔𝒕), nacelle drag (+𝑫𝒏𝒂𝒄∗ ), and detailed interference effects (𝚫𝑭𝑵∗
It was determined that the modified standard net thrust (𝐹𝑁∗) was +11% greater than the 𝐹𝑁 𝑟𝑒𝑓 for the baseline engine as a result of the beneficial forces that act on the exhaust (+𝜃𝑒𝑥ℎ𝑎𝑢𝑠𝑡). Moreover, the 𝜃𝑒𝑥ℎ𝑎𝑢𝑠𝑡 increase is approximately proportional with engine size, as a result of the same efflux conditions for all the engine sizes. Furthermore, the modified nacelle drag (+𝐷𝑛𝑎𝑐∗ ) was added to obtain the NPF. The isolated nacelle drag also broadly scaled with size. As a result the NPF for three engines is -3.6%, -5.5% and -7.5% less than the standard net thrust for baseline, 1.23 scale and 1.64 scale respectively.
Furthermore, the installation of the different sized engine had a modest effect on 𝐹𝑁∗ as the engines were located in a position with an overlap of the exhaust system (C3). Even though, the baseline engine gained significant benefit from the Δ𝐷𝑛𝑎𝑐∗ as compared with both larger engines, the interference on the airframe (Δ𝐷𝐴/𝐹) determined the final result. Overall, the final force depends on the engine size. The spread between baseline engine and the largest engine (1.46 𝐷𝐹𝐹) is 0.5%. Even though it was anticipated that the aerodynamic interference could be more penalizing for the larger engines than for the baseline, it is not. The large penalties of the modified drag of the nacelle (𝐷𝑛𝑎𝑐∗ ) increased proportionally to the engine size, however, they were offset by the beneficial effect on the exhaust term (+𝜃𝑒𝑥ℎ𝑎𝑢𝑠𝑡). Overall, the 1.46 scale engine exhibited -3.9% less net propulsive force than the baseline engine. However, the beneficial aerodynamic interference resulted in the total difference between wing-installed engines of 0.5% in the standard net thrust (𝐹𝑁).
IV.
Conclusions
The research assesses the engine installation effects for a typical twin-engine wide-body 250-300 seater aircraft during a mission at an altitude of 35000 ft and a cruise Mach number of 0.82. A range of engine horizontal and vertical positions was investigated. It was determined that the engine installation is sensitive to engine position with the maximum difference in the resultant installed net propulsive force between the positions of 1.7% of reference thrust. The best position was located closest to the wing horizontally and lowest from the wing vertically. The installed net propulsive force for this best position is -2.4% lower than the standard net thrust (𝐹𝑁) of an isolated engine at cruise condition. In comparison the worst position performed -4.1% worse than the standard net thrust of an isolated engine. The overall effect was deconstructed into the interference effects on thrust, nacelle drag and airframe drag and the sensitivity of the local interference effects was assessed. Furthermore, the effect of engine size on the engine installation aspects was assessed. Even though, the nacelle drag increased with size from 15% for the baseline engine to 30% of 𝐹𝑁 for the 1.46 larger engine, the negative effect was offset by an increase of the beneficial force on the external exhaust (𝜃𝑒𝑥ℎ𝑎𝑢𝑠𝑡). It was found that the aerodynamic interference for the larger engines is not more penalizing relative to that of the baseline sized engine. Overall, it is required to increase the standard net thrust of the engine by +0.1% and +0.5% to compensate for the modest detrimental effects of engine size.
References
1. Advisory Group for Aerospace Research and Development (AGARD), “Special course on Subsonic/Transonic Aerodynamic Interference for Aircraft”, AGARD Report No. 712, 1983. Tech. rep. AGARD-R-712
2. Lee, E. E., Pendergraft Jr, O. C., “Installation effects of long-duct pylon-mounted nacelles on a twin-jet transport model with swept supercritical wing”, NASA. 1985. Tech. rep.
3. Carlson, J. R., Compton, W. B., “An experimental investigation of Nacelle-pylon installation on an unswept wing at susbonic and transonic speeds”, NASA. 1984. Tech. rep.
4. Hoheisel, H., “Aerodynamic aspects of engine-aircraft integration of transport aircraft”,Aerospace Science and Technology,Vol. 1, No 7, 1997, pp. 475-487.
5. Brodersen, O. “Computation of Engine-Airframe Installation Drag” MEGAFLOW - Numerical Flow Simulation for Aircraft Design, edited by Kroll, N., Fassbender, J.,Vol. 89, Springer, Berlin, 2005. pp. 151-161.
6. Rossow, C-C., Nashville, T. N., “Investigations of Propulsion Integration Interference Effects on a Transport Aircraft Configuration”,AIAA/SAE/ASME/ASEE 28th Joint Propulsion Conference and Exhibit.,6-8 July 1992. Vols. AIAA 92-3097.
7. Geyr, H. Frhr. Von, Rossow, C. C., “A correct thrust detemination method for turbine powered simulatiors in wind tunnel testing”,41st AIAA/ASME/SAE/ASEE Joint Propulsion Conference & Exhibit,2005, pp. 1-12. AIAA Paper No. 2005-3707
8. Oliveira, G.L., Trapp, L.G., Puppin-Macedo, A., “Integration Methodology for Regional Jet Aircraft with Underwing Engines”, 41st Aerospace Sciences Meeting and Exhibit, 6-9 January, Reno, Nevada, United States,
AIAA Paper No. 2003-934
9. Frink N. T., 2nd AIAA CFD Drag Prediction Workshop. [Online] AIAA, June 21-22, 2003. [Cited: 10.04.2015] http://aaac.larc.nasa.gov/tsab/cfdlarc/aiaa-dpw/Workshop2/workshop2.html
10.Vassberg, J. C., et al. “ Development of a Common Research Model for Applied CFD Validation Studies”, AIAA. 2008. AIAA Paper No. 2008-6919.
11.Rivers, M. B., Dittberner, A., “Experimental investigations of the NASA Common Research Model in the NASA Langley National Transonic Facility and NASA Ames 11-Ft transonic wind tunnel (invited)”, 49th AIAA aerospace sciences meeting including the new horizons forum and aerospace exposition, Orlando, Florida, US 2010, AIAA Paper No. 2011-1126.
12.Rivers, M. B., “Experimental investigation of the NASA Common Research Model (Invited)”, 28th AIAA Applied Aerodynamics Conference, Chicago, Illinios, US, 2010, AIAA.2010-4218
13.Palmer, J. and Pachidis, V. “The TURBOMATCH scheme for aero/industrial gas turbine engine design point/offdesign performance calculation” School of Mechanical Engineering, 1983, Cranfield University. 14.Kulfan, B., Bussoletti, J., “"Fundamental" Parameteric Geometry Representations for Aircraft Component
Shapes” in 11th AIAA/ISSMO Multidisciplinary Analysis Optimization Conference, American Institute of Aeronautics and Astronautics, 2006.
15.Ceze, M., Hayashi, M., Volpe, E., “A Study of the CST Parameterization Characteristics,” in 27th AIAA Aplied Aerodynamics Conference, American Institute of Aeronautics and Astronautics, 2009.
16.Frink N. T., 4th AIAA CFD Drag Prediction Workshop. [Online] AIAA, June 20, 2009. [Cited: 10.04.2015.] http://aaac.larc.nasa.gov/tsab/cfdlarc/aiaa-dpw/Workshop4/workshop4.html.
17.Tinoco, E. N., Levy, D., Brodersen, O., “DPW-IV Summary of Participants Data”, AIAA 4th CFD Drag Prediction Workshop, San Antonio, Texas, 2009.
18.Menter, F. R., “Two-equation eddy-viscosity turbulence models for engineering applications”, AIAA Journal, Vol. 32, No. 8, 1994, , pp. 1598-1605.
19.Christie, R., Ramirez, S. and MacManus, D. G., “Aero-engine installation modelling and the impact on overall flight performance”, In: Advanced Aero Concepts, Design and Operations Conference, 27 June 2014, Bristol, United Kingdom.
20.Stańkowski, T.P., MacManus, D.G., “Engine installation module development for an aircraft mission analysis framework” , In: Advanced Aero Concepts, Design and Operations Conference, 27 June 2014, Bristol, United Kingdom.
21.Stańkowski, T.P., MacManus, D.G., “Aerodynamics of aero-engine installation”, IMECHE Part G (in review process)
22.Roache, P.J., “Perspective: a method for uniform reporting of grid refinement studies”Journal of Fluids Engineering, Vol. 116, No. 3, 1994, , pp. 405-413.
23.Kwasniewski, L., “Application of grid convergence index in FE computation”, Bulletin of the Polish Academy of Sciences, Technical Sciences, Vol. 61, No. 1, 2013, pp. 123-128.
24.Voulgaris, I., Civil Aircraft Nacelle and Afterbody Aerodynamics, Master’s thesis, Cranfield University, Bedfordshire, UK, MK430AL, August 2014.
25.ESDU,“Introduction to the Measurement of Thrust in Flight (Air Breathing Ducted Flow Engines)”, ESDU. 1981. Tech. rep. ESDU-69006
26.Ministry-Industry Drag Analysis Panel (MIDAP) Study Group, “Guide to in-flight thrust measurement of turbojets and fan engines”, AGARDograph No. 237 AGARD. 1979.
27.Kiock, R. and Baumert, W., “A Selection of Experimental Test Cases for the Validation of CFD codes, Volume II,” Advisory Group for Aerospace Research and Development, AOARD-AR-303 Vol. 2, 7 Rue Ancelle, 92200 Neuilly-Sur-Seine, France, August 1994.
28.Baumert,W., Binder, B., and Stager,W., “Engine Simulator Tests: Comparison of Calibration andWind Tunnel Results,” Advisory Group for Aerospace Research and Development, AGARD-CP 429, 7 Rue Ancelle, 92200, Neuilly-sur-Seine, France, 1987.