ARISTIDES GIONIS, HEIKKI MANNILA, and PANAYIOTIS TSAPARAS
HIIT Basic Research Unit, Department of Computer Science, University of Helsinki
We consider the following problem: given a set of clusterings, find a clustering that agrees as much as possible with them. This problem,clustering aggregation, appears naturally in various contexts. For example, clustering categorical data is an instance of the problem: each categorical variable can be viewed as a clustering of the input rows. Moreover, clustering aggregation can be used as a meta-clustering method to improve the robustness of clusterings. The problem formulation does not require a-priori information about the number of clusters, and it gives a natural way for handling missing values. We give a formal statement of the clustering aggregation problem, discuss related work, and suggest a number of algorithms. For several of the methods we provide theoretical guarantees on the quality of the solutions. We also show how sampling can be used to scale the algorithms for large data sets. We give an extensive empirical evaluation demonstrating the usefulness of the problem and of the solutions.
Categories and Subject Descriptors: H.2.8 [Database Management]: Database Applications—
Data mining; F.2.2 [Analysis of Algorithms and Problem Complexity]: Nonnumerical Algorithms and Problems
General Terms: Algorithms
Additional Key Words and Phrases: Data clustering, Clustering categorical data, Clustering ag-gregation, Correlation clustering
1. INTRODUCTION
Clustering is an important step in the process of data analysis with applications to numerous fields. Informally, clustering is defined as the problem of partitioning data objects into groups (clusters), such that objects in the same group are similar, while objects in different groups are dissimilar. This definition assumes that there is some well definedquality measure that captures intra-cluster similarity, and/or inter-cluster dissimilarity. Clustering then becomes the problem of grouping to-gether data objects so that the quality measure is optimized. There is of course an extensive body of literature on clustering methods, see e.g., [Jain and Dubes 1988; Hand et al. 2001; Han and Kamber 2001].
In this paper we consider an approach to clustering that is based on the concept of aggregation. We assume that given a set of data objects we can obtain some information on how these objects should be clustered. This information comes in the form ofmclusteringsC1, . . . ,Cm. The objective is to produce a single clustering
Cthat agrees as much as possible with themclusterings. We define a disagreement A shorter version of this paper appeared in International Conference on Data Engineering (ICDE), 2005.
Permission to make digital/hard copy of all or part of this material without fee for personal or classroom use provided that the copies are not made or distributed for profit or commercial advantage, the ACM copyright/server notice, the title of the publication, and its date appear, and notice is given that copying is by permission of the ACM, Inc. To copy otherwise, to republish, to post on servers, or to redistribute to lists requires prior specific permission and/or a fee.
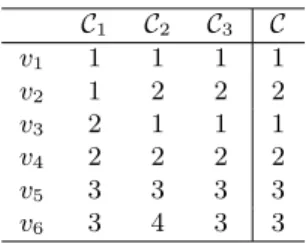
C1 C2 C3 C v1 1 1 1 1 v2 1 2 2 2 v3 2 1 1 1 v4 2 2 2 2 v5 3 3 3 3 v6 3 4 3 3
Fig. 1. An example of clustering aggregation.
C1,C2 andC3 are the input clusterings, and
v1, . . . , v6 are the objects to be clustered. A valuekin the entry (vi,Cj) means that object vi belongs to clusterkof the clusteringCj.
ColumnCis the clustering that minimizes the disagreements with clusteringsC1,C2andC3.
v4
v6 v5 v2
v1 v3
Fig. 2. Correlation clustering instance for the dataset in Figure 1. Solid edges indicate dis-tances of 1/3, dashed edges indicate disdis-tances of 2/3, and dotted edges indicate distances of 1. The circles depict the clusters of cluster-ingCthat minimizes the number of disagree-ments.
between two clusteringsCandC0as a pair of objects (v, u) such thatCplaces them in the same cluster, while C0 places them in different clusters, or vice versa. If d(C,C0) denotes the number of disagreements betweenCandC0, then the task is to find a clusteringC that minimizesPm
i=1d(Ci,C).
As an example, consider the dataset V ={v1, v2, v3, v4, v5, v6}that consists of six objects, and letC1={{v1, v2},{v3, v4},{v5, v6}},C2={{v1, v3},{v2, v4},{v5},
{v6}}, andC3 ={{v1, v3}, {v2, v4},{v5, v6}} be three clusterings of V. Figure 1 shows the three clusterings, where each column corresponds to a clustering, and a valueidenotes that the tuple in that row belongs in thei-th cluster of the clustering in that column. The rightmost column is the clustering C = {{v1, v3},{v2, v4},
{v5, v6}} that minimizes the total number of disagreements with the clusterings
C1,C2,C3. In this example the total number of disagreements is 5: one with the clustering C2 for the pair (v5, v6), and four with the clustering C1 for the pairs (v1, v2),(v1, v3),(v2, v4),(v3, v4). It is not hard to see that this is the minimum number of disagreements possible for any partition of the datasetV.
We defineclustering aggregation as the optimization problem where, given a set of m clusterings, we want to find the clustering that minimizes the total number of disagreements with themclusterings. Clustering aggregation provides a general framework for dealing with a variety of problems related to clustering: (i) it gives a natural clustering algorithm for categorical data, which allows for a simple treat-ment of missing values, (ii) it handles heterogeneous data, where tuples are defined over incomparable attributes, (iii) it determines the appropriate number of clus-ters and it detects outliers, (iv) it provides a method for improving the clustering robustness, by combining the results of many clustering algorithms, (v) it allows for clustering of data that is vertically partitioned in order to preserve privacy. We elaborate on the properties and the applications of clustering aggregation in Section 2.
The algorithms we propose for the problem of clustering aggregation take ad-vantage of a related formulation, which is known ascorrelation clustering[Bansal
et al. 2002]. We map clustering aggregation to correlation clustering by considering the tuples of the dataset as vertices of a graph, and summarizing the information provided by the m input clusterings by weights on the edges of the graph. The weight of the edge (u, v) is the fraction of clusterings that placeuandvin different clusters. For example, the correlation clustering instance for the dataset in Figure 1 is shown in Figure 2. Note that if the weight of the edge (u, v) is less than 1/2 then the majority of the clusterings placeuandv together, while if the weight is greater than 1/2, the majority placesuand v in different clusters. Ideally, we would like tocut all edges with weight more than 1/2, and not cut all edges with weight less than 1/2. The goal in correlation clustering is to find a partition of the vertices of the graph that it cuts as few as possible of the edges with low weight (less than 1/2), and as many as possible of the edges with high weight (more than 1/2). In Figure 2, clusteringC={{v1, v3},{v2, v4},{v5, v6}}is the optimal clustering.
Clustering aggregation has been previously considered under a variety of names (consensus clustering, clustering ensemble, clustering combination) in a variety of different areas: machine learning [Strehl and Ghosh 2002; Fern and Brodley 2003], pattern recognition [Fred and Jain 2002], bioinformatics [Filkov and Skiena 2003], and data mining [Topchy et al. 2004; Boulis and Ostendorf 2004]. The problem of correlation clustering is interesting in its own right, and it has recently attracted a lot of attention in the theoretical computer science community [Bansal et al. 2002; Charikar et al. 2003; Demaine and Immorlica 2003; Emanuel and Fiat 2003]. We review some of the related literature on both clustering aggregation, and correlation clustering in Section 7.
Our contributions can be summarized as follows.
—We formally define the problem of clustering aggregation, and we demonstrate the connection between clustering aggregation and correlation clustering. —We present a number of algorithms for clustering aggregation and correlation
clustering. We also propose a sampling mechanism that allows our algorithms to handle large datasets. The problems we consider are NP-hard, yet we are still able to provide approximation guarantees for many of the algorithms we propose. For the formulation of correlation clustering we consider we give a combinatorial 3-approximation algorithm.
—We present an extensive experimental study, where we demonstrate the benefits of our approach. Furthermore, we show that our sampling technique reduces the running time of the algorithms, without sacrificing the quality of the clustering. The rest of this paper is structured as follows. In Section 2 we discuss the various applications of the clustering-aggregation framework, which is formally defined in Section 3. In Section 4 we describe in detail the proposed algorithms for clustering aggregation and correlation clustering, and the sampling-based algorithm that al-lows us to handle large datasets. Our experiments on synthetic and real datasets are presented in Section 6. Finally, Section 7 contains a review of the related work, and Section 8 is a short conclusion.
2. APPLICATIONS OF CLUSTERING AGGREGATION
Clustering aggregation can be applied in various settings. We will now present some of the main applications and features of our framework.
Clustering categorical data: An important application of clustering aggregation is that it provides a very natural method for clustering categorical data. Consider a dataset with tuplest1, . . . , tnover a set of categorical attributesA1, . . . , Am. The idea is to view each attributeAj as a way of producing a simple clustering of the data: ifAj containskj distinct values, thenAj partitions the data inkj clusters— one cluster for each value. Then, clustering aggregation considers all those m clusterings produced by themattributes and tries to find a clustering that agrees as much as possible with all of them.
For example, consider aMoviedatabase. Each tuple in the database corresponds to a movie that is defined over a set of attributes such asDirector,Actor,Actress,
Genre, Year, etc, some of which take categorical values. Note that each of the
categorical attributes defines naturally a clustering. For example, theMovie.Genre
attribute groups the movies according to their genre, while the Movie.Director
according to who has directed the movie. The objective is to combine all these clusterings into a single clustering.
Methods for aggregating clusterings can also be extended to incorporate domain knowledge, when available. For example, if some attributes are more important than others, then we can increase their influence on the aggregate solution by including multiple copies of the specific attributes in the clustering aggregation. Similarly, if we have some prior knowledge for the relation of the values of a specific attribute (e.g., a hierarchy that rendersthrillercloser tohorrorthan tocomedy) we can incorporate it by adding clusterings that place similar values together. In the movie database example, if theMovie.Genretakes the valuesthriller, horror,
and comedy, we can add to the clustering aggregation a clustering that places all
movies with genre thriller and horror together; this will bias the aggregation algorithm towards merging these two values. In this way we can incorporate the available domain knowledge in the final result in a very natural way.
Clustering heterogeneous data: The clustering aggregation method can be
par-ticularly effective in cases where the data are defined over heterogeneous attributes that contain incomparable values. Consider for example the case that there are many numerical attributes whose units are incomparable (say,Movie.Budgetand
Movie.Year) and so it does not make sense to compare numerical vectors directly
using anLp-type distance measure. A similar situation arises in the case where the data contains a mix of categorical and numerical values. In such cases the data can be partitioned vertically into sets of homogeneous attributes, obtain a clustering for each of these sets by applying the appropriate clustering algorithm, and then aggregate the individual clusterings into a single clustering.
Missing values: One of the major problems in clustering, and data analysis in
general, is the issue of missing values. These are entries that for some reason (mis-takes, omissions, lack of information) are incomplete. The clustering aggregation framework provides several ways for dealing with missing values in categorical data. One approach is to average them out: an attribute that contains a missing value in some tuple does not have any information about how this tuple should be clustered, so we should let the remaining attributes decide. When computing the fraction of clusterings that disagree over a pair of tuples, we only consider the attributes that actually have a value on these tuples.
Another approach, which we adopt in this paper, is to assume that given a pair of tuples for which an attribute contains at least one missing value, the attribute tosses a random coin and with probabilityp, for some chosenp∈[0,1] it reports the tuples as being clustered together, while with probability 1−pit reports them as being in separate clusters. Each pair of tuples is treated independently. We are then interested in minimizing the expected number of disagreements between the clusterings.
Identifying the correct number of clusters: One of the most important
fea-tures of the formulation of clustering aggregation is that there is no need to specify the number of clusters in the result. The automatic identification of the appropriate number of clusters is a deep research problem that has attracted significant atten-tion (see, e.g., [Schwarz 1978; Hamerly and Elkan 2003; Smyth 2000]). For most clustering approaches the quality (likelihood, sum of distances to cluster centers, etc.) of the solution improves as the number of clusters is increased. Thus, the trivial solution of all singleton clusters is the optimal. There are two ways of han-dling the problem. The first is to have a hard constraint on the number of clusters, or on their quality. For example, in agglomerative algorithms one can either fix in advance the number of clusters in the final clustering, or impose a bound on the distance beyond which no pair of clusters will be merged. The second approach is to use model selection methods, e.g., Bayesian information criterion (BIC) [Schwarz 1978], or cross-validated likelihood [Smyth 2000] to compare models with different numbers of clusters.
The formulation of clustering aggregation gives one way of automatically select-ing the number of clusters. If many input clusterselect-ings place two objects in the same cluster, then it will not be beneficial for a clustering-aggregation solution to split these two objects. Thus, the solution of all singleton clusters is not a trivial solution for our objective function. Furthermore, if there areksubsets of data objects in the dataset, such that the majority of the input clusterings places them together, and separates them from the rest, then the clustering aggregation algorithm will cor-rectly identify thekclusters, without any prior knowledge ofk. A simple instance is the example in Figures 1 and 2 where the optimal solutionCdiscovers naturally a set of 3 clusters in the dataset.
Indeed, the structure of the objective function ensures that the clustering aggre-gation algorithms will naturally settle to the appropriate number of clusters. As we will show in our experimental section, our algorithms take advantage of this feature and for all our datasets they generate clusterings with very reasonable number of clusters. On the other hand, if the user insists on a predefined number of clusters, most of our algorithms can be easily modified to return that specific number of clusters. For example, the agglomerative algorithm described in Section 4 can be made to continue merging clusters until the predefined number is reached.
Detecting outliers: The ability to detect outliers is closely related with the ability
to identify the correct number of clusters. If a node is not close to any other nodes, then, from the point of view of the objective function, it would be beneficial to assign that node in a singleton cluster. In the case of categorical data clustering, the scenarios for detecting outliers are very intuitive: if a tuple contains many uncommon values, it is does not participate in clusters with other tuples, and it
will be identified as an outlier. Another scenario where it pays off to consider a tuple as an outlier is when the tuple contains common values (and therefore it participates in big clusters in the individual input clusterings) but there is no consensus to a common cluster (for example, a horror movie featuring actress Julia.Roberts
and directed by the “independent” directorLars.vonTrier).
Improving clustering robustness: Different clustering algorithms have different
qualities and different shortcomings. Some algorithms might perform well in specific datasets but not in others, or they might be very sensitive to parameter settings. For example, the single-linkage algorithm is good in identifying elongated regions but it is sensitive to clusters being connected with narrow strips of points. The k-means method is a widely-used algorithm, but it favors spherical clusters, it is sensitive to clusters of uneven size, and it can get stuck in local optima.
We suggest that by aggregating the results of different clustering algorithms we can improve significantly the robustness and quality of the final clustering. The idea is that different algorithms make different types of mistakes that can be canceled out in the final aggregation. Furthermore, for objects that are outliers or noise, it is most likely that there will be no consensus on how they should be clustered, and thus they will be singled out by the aggregation algorithm. The intuition is similar to performing rank aggregation for improving the results of web searches [Dwork et al. 2001]. Our experiments indicate that clustering aggregation can significantly improve the results of individual algorithms.
Privacy-preserving clustering: Consider a situation where a database table is
vertically split and different attributes are maintained in different sites. Such a situation might arise in cases where different companies or governmental adminis-trations maintain various sets of data about a common population of individuals. For such cases, our method offers a natural model for clustering the data maintained in all sites as a whole in a privacy-preserving manner, that is, without the need for the different sites to reveal their data to each other, and without the need to rely on a trusted authority. Each site clusters its own data independently and then all resulting clusterings are aggregated. The only information revealed is which tuples are clustered together; no information is revealed about data values of any individual tuples.
3. DESCRIPTION OF THE FRAMEWORK
We begin our discussion of the clustering aggregation framework by introducing our notation. Consider a set ofnobjects V ={v1, . . . , vn}. A clusteringCof V is apartitionofV intokdisjoint setsC1, . . . , Ck, that is,Ski Ci=V andCi∩Cj =∅ for all i6=j. The k sets C1, . . . , Ck are the clusters ofC. For each v∈ V we use
C(v) to denote the label of the cluster to which the objectv belongs, i.e.,C(v) =j if and only ifv∈Cj. In the sequel we considermclusterings: we writeCito denote theith clustering, andki for the number of clusters ofCi.
In the clustering aggregation problem the task is to find a clustering that min-imizes the disagreements with a number of already-existing clusterings. To make the notion more precise, we need to define a measure of disagreement between clus-terings. Consider first two objectsuandvinV. The following simple 0/1 distance function checks if two clusteringsC1andC2 agree on the clustering ofuandv.
du,v(C1,C2) =
1 ifC1(u) =C1(v) andC2(u)6=C2(v), orC1(u)6=C1(v) andC2(u) =C2(v), 0 otherwise.
The distance between two clusteringsC1 andC2 is defined as the number of pairs of objects on which the two clusterings disagree, that is,
dV(C1,C2) = X
(u,v)∈V×V
du,v(C1,C2).
The clustering aggregation problem can now be formalized as follows.
Problem 1 Clustering aggregation. Given a set of objects V andm clus-teringsC1, . . . ,CmonV, compute a new clusteringCthat minimizes the total num-ber of disagreements with all the given clusterings, i.e., it minimizes
D(C) = m X
i=1
dV(Ci,C).
The clustering aggregation problem is also defined in [Filkov and Skiena 2003], where it is shown to be NP-complete using the results of Barthelemy and Leclerc [Barthelemy and Leclerc 1995].
It is easy to show that the distance measuredV(·,·) satisfies thetriangle inequality on the space of clusterings.
Observation 1. Given a set of objects V, and clusterings C1, C2, C3 on V, we have
dV(C1,C3)≤dV(C1,C2) +dV(C2,C3)
Proof. It is sufficient to show that for each pair (u, v) we have du,v(C1,C3)≤ du,v(C1,C2) +du,v(C2,C3). and the lemma follows from the definition ofdV. Since du,vtakes 0/1 values the only case that the triangle inequality could be violated is whendu,v(C1,C3) = 1 anddu,v(C1,C2) =du,v(C2,C3) = 0. However,du,v(C1,C3) = 1 implies that either C1(u) = C1(v) and C3(u) =6 C3(v), or that C1(u) 6= C1(v) and
C3(u) =C3(v). Assume thatC1(u) =C1(v) andC3(u)6=C3(v). Thendu,v(C1,C2) = 0 clusteringsC1 andC2 must agree on the clustering ofuandv; thereforeC2(u) =
C2(v). Similarly,du,v(C1,C2) = 0 implies thatC3(u) =C3(v), which contradicts our assumption thatC3(u)6=C3(v). The case whereC1(u)6=C1(v) andC3(u) =C3(v)
is treated symmetrically. 2
The algorithms we propose for the problem of clustering aggregation take advan-tage of a related formulation, which is known ascorrelation clustering[Bansal et al. 2002]. Formally, correlation clustering is defined as follows.
Problem 2 Correlation clustering. Given a set of objects V, and dis-tances Xuv ∈ [0,1] for all pairs u, v ∈ V, find a partition C for the objects in
V that minimizes the score function d(C) = X (u,v) C(u)=C(v) Xuv+ X (u,v) C(u)6=C(v) (1−Xuv).
Correlation clustering is a generalization of clustering aggregation. Given the mclusterings C1, . . . ,Cm as input one can construct an instance of the correlation clustering problem by defining the distances Xuv appropriately. In particular, let Xuv = m1 · |{i | 1 ≤ i ≤ mandCi(u) 6= Ci(v)}| be the fraction of clusterings that assign the pair (u, v) into different clusters. For a candidate solution C of correlation clustering, if C places u, v in the same cluster it will disagree with mXuv of the original clusterings, while if C placesu,v in different clusters it will disagree with the remainingm(1−Xuv) clusterings. Thus, clustering aggregation can be reduced to correlation clustering, and as a result correlation clustering is also an NP-complete problem. We note that an instance of correlation clustering produced by an instance of clustering aggregation is a restricted version of the correlation clustering problem.
It is easy to show that the valuesXuv obey the triangle inequality.
Observation 2. For allu, v andwin V, we have thatXuw≤Xuv+Xvw.
Proof. Define Xi
uv = 1 if Ci(u) 6= Ci(v) and zero otherwise. Then Xuv = 1
m
Pm
i=1Xuvi . Therefore, it suffices to show thatXuwi ≤Xuvi +Xvwi . The only way that this inequality can be violated is if Xi
uw = 1 and Xuvi =Xvwi = 0. However, the latter equality suggests that u, v, w are all placed in the same cluster, thus
reaching a contradiction. 2
Since both problems we consider are NP-complete it is natural to seek algorithms with provable approximation guarantees. For the clustering aggregation problem, it is easy to obtain a 2-approximation solution. The idea is to take advantage of the triangle inequality property of the distance measuredV(·,·). Assume that we are given m objects in a metric space and we want to find a new point that minimizes the sum of distances from the given objects. Then it is a well known fact that selecting the best among themoriginal objects yields a factor 2(1−1/m) approximate solution. For our problem, this method suggests taking as the solution to clustering aggregation the clusteringCithat minimizesD(Ci). Despite the small approximation factor, this solution is non-intuitive, and we observed that it does not work well in practice.
The above algorithm cannot be used for the problem of correlation clustering— there are no input clusterings to choose from. In general, the correlation clustering problem we consider is not equivalent to the clustering aggregation. There is an ex-tensive literature in the theoretical computer science community on many different variants of the correlation clustering problem; we review some of these results in Section 7. Our problem corresponds to the weighted correlation clustering problem with linear cost functions [Bansal et al. 2002], where the weights on the edges obey the triangle inequality.
4. ALGORITHMS
4.1 Description of the algorithms
In this section we present several algorithms for clustering aggregation. Most of our algorithms approach the problem through the correlation clustering problem, and most of the algorithms are parameter-free.
TheBestClustering algorithm: This is the simple algorithm that was already mentioned in the previous section. GivenmclusteringsC1, . . . ,Cm,
BestCluster-ingfinds the input clusteringCi that minimizes the total number of disagreements D(Ci). Using the data structures described in [Barthelemy and Leclerc 1995] the best clustering can be found in time O(mn). As discussed, this algorithm yields a solution with approximation ratio of at most 2(1−1/m). We can show that this bound is tight, that is, there exists an instance of the clustering aggregation problem, where the algorithm BestClustering produces a solution that is ex-actly 2(1−1/m) worse than the optimal. The proof of the lower bound appears in Section 5.
The algorithm is specific to clustering aggregation – it cannot be used for cor-relation clustering. An interesting approach to the corcor-relation clustering problem, that might lead to a better approximation algorithm, is to reconstruct m cluster-ings from the input distance matrix [Xuv]. Unfortunately, we are not aware of a polynomial-time algorithm for this problem of decomposition into clusterings.
The Balls algorithm: The Balls algorithm is inspired by the algorithm in [Charikar et al. 2003] and it works on the correlation clustering problem. It takes as input the matrix of pairwise distancesXuv. Equivalently, we view the input as a graph whose vertices are the tuples of a dataset, and the edges are weighted by the distancesXuv. The algorithm is defined with an input parameter α, and it is the only algorithm that requires an input parameter. Following the theoretical analysis in Section 5 we can setαto a constant that guarantees a constant approximation ratio. However, different values ofαcan lead to better solutions in practice.
The intuition of the algorithm is to find a set of vertices that are close to each other and far from other vertices. Given such a set, we consider it to be a cluster, we remove it from the graph, and we proceed with the rest of the vertices. The difficulty lies in finding such a set, since in principle any subset of the vertices can be a candidate. We overcome the difficulty by resorting again to the triangle inequality – this time for the distancesXuv. In order to find a good cluster we take all vertices that are close (within a “ball”) to a vertexu. The triangle inequality guarantees that if two vertices are close tou, then they are also relatively close to each other. We also note that for the correlation clustering problem it is intuitive that good clusters should be ball-shaped: since our cost function penalizes for long edges that are not cut, we do not expect to have elongated clusters in the optimal solution.
More formally the algorithm is described as follows. It first sorts the vertices in increasing order of the total weight of the edges incident on each vertex. This is a heuristic that we observed to work well in practice. The ordering does not affect the approximation guarantee of the algorithm. At every step, the algorithm picks the first unclustered nodeuin that ordering. It then finds the set of nodesB that are
at a distance of at most 1/2 from the nodeu, and it computes the average distance d(u, B) of the nodes inB to nodeu. Ifd(u, B)≤αthen the nodes inB∪ {u}are considered to form a cluster; otherwise, nodeuforms a singleton cluster.
We can prove that, when setting α = 14, the cost of solution produced by the
Ballsalgorithm is guaranteed to be at most 3 times the cost of the optimal clus-tering. The proof appears in Section 5. In our experiments we have observed that the value 14 tends to be small, as it creates many singleton clusters. For many of our real datasets we have found thatα= 25 leads to better solutions. The complex-ity of the algorithm isO(mn2) for generating the table andO(n2) for running the algorithm.
TheAgglomerativealgorithm: TheAgglomerativealgorithm is a standard bottom-up procedure for the correlation clustering problem. It starts by placing every node into a singleton cluster. It then proceeds by considering the pair of clusters with the smallest average distance. The average distance between two clusters is defined as the average weight of the edges between the two clusters. If the average distance of the closest pair of clusters is less than 1/2 then the two clusters are merged into a single cluster. If there are no two clusters with average distance smaller than 1/2, then no merging of current clusters can lead to a solution with improved costd(C). Thus, the algorithm stops, and it outputs the clusters it has created so far.
TheAgglomerativealgorithm has the desirable feature that it creates clusters where the average distance of any pair of nodes is at most 1/2. The intuition is that the opinion of the majority is respected on average. Using this property we are able to prove that when m = 3, the Agglomerative algorithm produces a solution with cost at most 2 times that of the optimal solution. The proof appears in Section 5. The complexity of the algorithm is O(mn2) for creating the matrix plusO(n2logn) for running the algorithm.
The Furthest algorithm: The Furthest algorithm is a top-down algorithm that works on the clustering correlation problem. It is inspired by thefurthest-first traversal algorithm, for which Hochbaum and Shmoys [Hochbaum and Shmoys 1985] showed that it achieves a 2-approximation for the clustering formulation of p-centers. As the Balls algorithm uses a notion of a center to find clusters and repeatedly remove them from the graph, theFurthestalgorithm uses centers to partition the graph in a top-down fashion.
The algorithm starts by placing all nodes into a single cluster. Then it finds the pair of nodes that are furthest apart, and places them into different clusters. These two nodes become the centers of the clusters. The remaining nodes are assigned to the center that incurs the least cost. This procedure is repeated iteratively: at each step a new center is generated that is the furthest from the existing centers, and the nodes are assigned to the center that incurs the least cost. At the end of each step, the cost of the new solution is computed. If it is lower than that of the previous step then the algorithm continues. Otherwise, the algorithm outputs the solution computed in the previous step. The complexity of the algorithm is O(mn2) for creating the matrix andO(k2n) for running the algorithm, wherek is the number of clusters created.
The LocalSearchalgorithm: TheLocalSearchalgorithm is an application of a local-search heuristic to the problem of correlation clustering. The algorithm starts with some clustering of the nodes. This clustering could be a random parti-tion of the data, or it could be obtained by running one of the algorithms we have already described. The algorithm then goes through the nodes and it considers placing them into a different cluster, or creating a new singleton cluster with this node. The node is placed in the cluster that yields the minimum cost. The process is iterated until there is no move that can improve the cost. The LocalSearch
can be used as a clustering algorithm, but also as a post-processing step, to improve upon an existing solution.
When considering a nodev, the costd(v, Ci) of assigning a node v to a cluster Ci is computed as follows. d(v, Ci) = X u∈Ci Xvu+ X u∈S∩Ci (1−Xvu)
The first term is the cost of mergingv in Ci, while the second term is the cost of not merging node v with the nodes not in Ci. We compute d(v, Ci) efficiently as follows. For every clusterCiwe compute and store the costM(v, Ci) =Pu∈CiXvu and the size of the cluster|Ci|. Then the distance ofv toCiis
d(v, Ci) =M(v, Ci) + X
j6=i
(|Cj| −M(v, Cj)) The cost of assigning nodevto a singleton cluster is P
j(|Cj| −M(v, Cj)). The running time of the LocalSearch algorithm, given the distance matrix Xuv, isO(T n2), whereY is the number of local search iterations until the algorithm converges to a solution for which no better move can be found. Our experiments showed that the LocalSearch algorithm is quite effective, and it improves the solutions found by the previous algorithms significantly. Unfortunately, the number of iterations tends to be large, and thus the algorithm is not scalable to large datasets.
4.2 Handling large datasets
The algorithms we described in Section 4.1 take as input the distance matrix, so their complexity is quadratic in the number of data objects in the dataset. The quadratic complexity is inherent in the correlation clustering problem, since the input to the problem is a complete graph. Given a node, the decision of placing the node to a cluster has to take into account not only the cost of merging the node to the cluster, but also the cost ofnot placing the node to the other clusters. Furthermore, the definition of the cost function does not allow for an easy sum-marization of the clusters, a technique that is commonly used in many clustering algorithms. However, the quadratic complexity makes the algorithms inapplica-ble to large datasets. We will now describe the algorithm Sampling, which uses sampling to reduce the running time of the algorithms.
TheSamplingalgorithm is run on top of the algorithms we described Section 4. The algorithm performs a pre-processing and post-processing step that are linear on the size of the dataset. In the pre-processing step the algorithm samples a set of nodes,S, uniformly at random from the dataset. These nodes are given as
input to one of the clustering aggregation algorithms. The output is a set of ` clusters {C1, ..., C`}of the nodes in S. In the post-processing step the algorithm goes through the nodes in the dataset not inS. For every node it decides whether or to place it in one of the existing clusters, or to create a singleton cluster. In order to perform this step efficiently, we use the same technique as for theLocalSearch
algorithm. We observed experimentally that at the end of the assignment phase there are too many singleton clusters. Therefore, we collect all singleton clusters and we run the clustering aggregation again on this subset of nodes.
The size of the sample S is determined so that if there is a large cluster in the dataset the sample will contain at least one node from the cluster with high probability. Large cluster means a cluster that contains a constant fraction of the nodes in the dataset. Using the Chernoff bounds we can prove that sampling O(logn) nodes is sufficient to ensure that we will select at least one of the nodes in a large cluster with high probability. Note that although nodes in small clusters may not be selected, these will be assigned in singleton clusters in the post-processing step. When clustering the singletons, they will be clustered together. Since the size of these clusters is small this does not incur a significant overhead on cost of the algorithm.
5. THEORETICAL ANALYSIS
In this section we consider some of the algorithms described in Section 4 and we prove guarantees for the cost of the solution they produce with respect to the cost of the optimal solution. For any algorithmAlg, letAlg(I) denote the cost of the algorithmAlgon inputI. Also letOpt(I) denote the cost of the optimal solution on input I. Let |I| denote the length of the input. Define I to be the set of all possible inputs to Alg. We say that the algorithmAlg has approximation ratio R(Alg,|I|) if for allI ∈ I, it holds that
Alg(I)≤R(Alg,|I|)·Opt(I)
For simplicity we will usually use R(Alg) to denote the approximation ratio of
Alg. We are interested in bounding R(Alg) for the different algorithms.
5.1 TheBestClustering algorithm
TheBestClusteringalgorithm is an approximation algorithm for Problem 1, the clustering aggregation problem. The inputI is a set of mclusterings ofn points. The cost function D(C) is the number of disagreements of the output clusteringC
with the input clusterings. We know thatR(BestClustering)≤2− 1
m. We will now prove that this bound is tight.
Theorem 1. The BestClusteringalgorithm has approximation ratio
R(BestClustering)≥2− 1
m for Problem 1.
Proof. In order to prove the lower bound to the approximation ratio of Best-Clustering it suffices to construct an instance I of the clustering aggregation problem, such that BestClustering(I)
Opt(I) = 2−
1 m.
LetV be the set of objects and letndenote the size of the setV. We construct m clusterings C1, . . . ,Cm on V as follows. We partition (arbitrarily) the set V
into m subsetsV1, V2, . . . , Vm of equal size. For simplicity assume here that n is divisible bym. The clusteringCi assigns each element ofVi into singleton clusters, while it groups the elements of each setVj, j 6=i, into a single cluster. Formally, the clustering Ci assigns distinct labels to all elements of the subset Vi, that is,
Ci(u)6=Ci(v), for allu, v ∈Vi. It assigns the same label to all elements in subset Vj, for allj 6=i, that is, Ci(u) =Ci(v), for allu, v ∈Vj. Furthermore, for allj 6=k,
Ci(u)6=Ci(v), for allu∈Vj andv∈Vk.
Due to the symmetry in the definition of subsetsV1, V2, . . . , Vm, and the cluster-ingsC1, . . . ,Cm, selecting any clusteringCigives the same number of disagreements D(Ci). Specifically, D(Ci) = (m−1) n/m 2 + (m−1) n/m 2 = 2(m−1) n/m 2 The first (m−1) n/m2
term is due to the elements of the setVi. The clustering
Ci assigns a different label to each element in Vi, while each of the other m−1 clusterings assigns the same label to all elements inVi. There are n/m2 pairs, and each of them contributes a disagreement between clusterCiand each of the m−1 other clusters.
The second (m−1) n/m2
term appears due to the remainingm−1 subsets. For each such subset Vj, the clusteringCi assigns the same label to all elements in Vj. All other clusterings, except for clustering Cj do exactly the same, thus being in agreement with Ci. Clustering Cj assigns distinct labels to all the elements ofVj, thus generating one disagreement for each pair of elements.
LetC∗ denote the clustering produced by the optimal algorithm. ClusteringC∗ creates a cluster for each subsetVi. The total number of disagreements isD(C∗) = m n/m2
. ThereforeD(Ci) = 2(1−m1)D(C∗), and BestClusteringOpt(I) (I) = 2−m1.
2
5.2 TheBallsalgorithm
TheBallsalgorithm is an approximation algorithm for Problem 2, the correlation clustering problem. The inputI to the problem is a set ofnpoints and the pairwise distancesXuv. The cost function is d(C) defined in Section 3. We will prove that the approximation ratio of the algorithm is bounded by a constant.
We first prove the following general lemma.
Lemma 1. For any algorithmAlg and any pair of objectsuandv
(a). ifXuv≤c andAlgassignsuandv in the same cluster, or (b). if Xuv≥1−cand Algassignsuandv in different clusters, then
the cost payed by Alg on edge (u, v) is at most 1−cc times the cost of the optimal algorithm for (u, v).
Proof. In both case (a) and (b) the algorithm Alg pays at most c. If the optimal takes the same decision asAlg, then it pays the same cost. If the optimal takes the opposite decision, then it pays at least 1−c, hence the ratio c
As an obvious corollary, if Xuv ≤1/2 and an algorithm assignsuand v to the same cluster, or ifXuv≥1/2 and an algorithm assignsuandvto different clusters, then the algorithm cannot do worse than the optimal on (u, v).
We are now ready to prove the following theorem. Our proof follows along the lines of the analysis in [Charikar et al. 2003].
Theorem 2. For α=1
4, the Ballsalgorithm has approximation ratio 3
Proof. We analyze the algorithm by bounding the cost that the algorithm pays for each edge in terms of the cost that the optimal algorithm pays for the same edge. Consider an iteration of theBallsalgorithm, and letube the node selected to be the center of the ball. We now consider the following cases.
Singleton clusters: First, we consider the case that C={u}is selected to be a
singleton cluster. Recall thatBis the set of nodes that are within distance 1/2 from u. For all edges (u, i) withi6∈B, we haveXui ≥1/2. Since the algorithm separates ufromi, the cost of the optimal cannot be less on each (u, i). The algorithm also splits all edges (u, i) withi∈B, so the cost of the algorithm is
X i∈B (1−Xui) =|B| − X i∈B Xui≤(1−α)|B|, where the factP
i∈BXui≥α|B|follows from the fact that the algorithm chose{u} to be a singleton cluster. On the other hand, the optimal algorithm might choose to place uin the same cluster with some vertices M ⊆ B. Thus the cost of the optimal for the edges fromuto the setB is
X i∈M Xui+ X i∈B\M (1−Xui)≥ X i∈B Xui≥α|B|,
where we used the fact that sincei∈Bwe have thatXui≤1/2, and thus 1−Xui≥ Xui. As a result, the approximation ratio within the singleton clusters is at most R1= (1−α)|B|α|B| =1−αα .
Next, we analyze the case where the Balls algorithm creates the clusterC = B∪ {u}.
Edges within clusters: For the edges of type (u, i), withi∈B, that the algorithm
places in the clusterC, we haveXui≤1/2, so the optimal cannot improve the cost by splitting those edges.
The other type of edges within the cluster C = B∪ {u} are edges (i, j) with i, j∈B. We order the verticesi∈B in order of increasing distanceXui from the nodeu. For afixedj we will bound the cost of the edges (i, j) fori < j.
IfXuj ≤β, for a constantβ <1/2 to be specified later, by the triangle inequality for all i < j, we have that Xij ≤Xui+Xuj ≤ 2β. Therefore, by Lemma 1 the approximation ratio for those edges is at mostR2= 1−2β2β .
If Xuj > β, let Cj be the set of vertices i with i < j. Notice that since the average distance fromuto verticesi∈B is less thanα, the average distance from uto vertices in Cj is also less than α, since Cj contains a prefix from the list of vertices, ordered in ascending order of their distanceXui from nodeu. The cost of
the algorithm for the edges inCj is Aj= X i∈Cj Xij≤ X i∈Cj Xuj+ X i∈Cj Xui≤ 1 2+α |Cj|.
On the other hand, assume that the optimal algorithm places some vertices i ∈
Mj⊆Cj in the same cluster withj, and the rest of the verticesi∈Sj=Cj\Mj in different clusters thanj; thus|Cj|=|Mj|+|Sj|. The cost of the optimal algorithm for the edges inCj can now be written as
OP Tj = X i∈Mj Xij+ X i∈Sj (1−Xij) ≥ X i∈Mj (Xuj−Xui) + X i∈Sj (1−Xuj−Xui) = (|Mj| − |Sj|)Xuj+|Sj| − X i∈Cj Xui ≥ (|Mj| − |Sj|)Xuj+|Sj| −α|Cj| = (|Mj| − |Sj|)Xuj+|Sj| −α(|Mj|+|Sj|) We now have two cases.
—If|Mj|<|Sj|, we use the fact thatXuj≤1/2 or equivalently (|Mj| − |Sj|)Xuj≥ (|Mj| − |Sj|)/2, and so the cost of the optimal isOP Tj≥(|Mj| − |Sj|)/2 +|Sj| − α(|Mj|+|Sj|) = (12−α)(|Mj|+|Sj|) = (12−α)|Cj|. In this case the approximation factor is at mostR3= 1 2+α 1 2−α = 1+2α 1−2α.
—If|Mj| ≥ |Sj|, we use the fact thatXuj ≥β, implying that the cost of the optimal isOP Tj≥β(|Mj| − |Sj|) +|Sj| −α(|Mj|+|Sj|) = (β−α)|Mj|+ (1−β−α)|Sj|. Selectingβ≥α, we have thatOP Tj≥(1−2α)|Sj|.
We now consider differenceAj−OP Tj. We have that Aj−OP Tj = X i∈Cj Xij− X i∈Mj Xij+ X i∈Sj (1−Xij) = X i∈Sj Xij− X i∈Sj (1−Xij) = 2 X i∈Sj Xij− |Sj| ≤ 2X i∈Sj 1− |Sj|=|Sj|
where the last nequality follows from the fact that Xij ≤ 1 for all edges (i, j). We now look at the ratio Aj−OP TjOP Tj . We have that
Aj−OP Tj OP Tj ≤ |Sj| (1−2α)|Sj| = 1 (1−2α) and therefore Aj OP Tj ≤2−2α 1−2α
In this case, the approximation factor is at mostR4=2−2α1−2α.
Note thatR2is a increasing function ofβ. Sinceβ≥α, it takes its minimum value forβ =α which isR2 = 1−2α2α . We also have that R2 ≤R3, andR2≤R4 for all α∈(0,1/2). Therefore, the approximation ratio for the edges within a cluster is at most max{R3, R4}.
Edges across clusters: Finally, we have to bound the cost of edges going from
inside C to clusters outside C. For edges of the type (u, i) with i 6∈ C, we have thatXui>1/2 and the algorithm split those edges, so the optimal cannot perform better on any one those edges. Therefore, we concentrate on edges of the type (i, j) withi∈C andj 6∈C. In particularXui ≤1/2 andXuj >1/2. IfXuj ≥γ, for a constant γ >1/2 to be specified later, we have that Xij ≥Xuj−Xui ≥γ−1/2, so, from Lemma 1 the approximation ratio on those edges will be at most R5 =
1−(γ−1/2)
γ−1/2 =
3/2−γ γ−1/2.
In the remaining case 1/2< Xuj < γ, we proceed by fixingj and bounding the cost ofalledges (i, j) fori∈C. For some fixedjassume that the optimal algorithm places some verticesi ∈ Mj ⊆C in the same cluster with j, and the rest of the verticesi∈Sj=C\Mj in different clusters thanj. Again|C|=|Mj|+|Sj|. The cost of the algorithm for all edges (i, j) withi∈C is
Aj = X i∈C (1−Xij)≤ X i∈C (1−(Xuj−Xui))≤ X i∈C (1−Xuj)+ X i∈C Xui≤ 1 2+α |C|. The cost of the optimal is bounded from below exactly as in the previous case, that is, OP Tj ≥ (|Mj| − |Sj|)Xuj +|Sj| −α(|Mj|+|Sj|). If |Mj| ≥ |Sj|, we use the fact that Xuj > 1/2, so the cost of the optimal is OP Tj ≥ (12 −α)|C|, and the approximation ratio is againR3.
If |Mj| <|Sj|, we use the fact thatXuj < γ, and thereforeOP Tj ≥γ(|Mj| −
|Sj|) +|Sj| −α(|Mj|+|Sj|) = (γ−α)|Mj|+ (1−γ−α)|Sj|. Selectingγ≤1−α, we have thatOP Tj ≥(1−2α)|Mj|. We consider again the differenceAj−OP Tj. We have that Aj−OP Tj = X i∈C (1−Xij)− X i∈Mj Xij+ X i∈Sj (1−Xij) = X i∈Mj (1−Xij)− X i∈Mj Xij= X i∈Mj (1−2Xij) ≤ |Mj| −2 X i∈Mj (Xuj−Xui) ≤ |Mj| −2 X i∈Mj Xuj+ 2 X i∈Mj Xui ≤ |Mj| − |Mj|+|Mj|=|Mj|
Similar to before we obtain that Aj OP Tj
≤ 2−2α
1−2α
Therefore the approximation ration in this case is again at mostR4.
We note that the ratioR5is a decreasing function ofγ. Since we selectγ≤1−α, R4 takes its minimum value forγ= 1−α, which isR5= 1/2+α1/2−α =R3.
Bringing it all together: The overall approximation ratio of theBallsalgorithm
is R(Balls) ≤ max{R1, R3, R4}. The ratiosR1, R3 and R4 are functions of the parameterα. We have that 0≤α≤ 1
2, and that R1 is a decreasing function ofα, while R3 and R4 are increasing functions of α. For α= 14, the values of all three ratios agree to the value 3. Therefore, we conclude that the approximation ratio of
theBallsalgorithm is at most 3. 2
There are special cases where theBallsalgorithm can perform better. Consider an instance of the correlation clustering problem that is derived when we consider the aggregation of three clusterings. In this case the weights Xuv take values in the set {0,1/3,2/3,1}. Then, for 1/3 ≤ α ≤ 1/2 the Balls algorithm achieves approximation ratio 2. This is due to the fact that in a ball B of radius 1/2 centered at some nodeu, there are only nodes that are at distance 0 or 1/3 from node u. Selecting αsuch that 1/3≤α ≤ 1/2, we force the algorithm to always create a cluster with the nodes inB. Therefore, by definition, the algorithm takes all edges with weight 0, and breaks all edges with weight 1. For the remaining edges, Lemma 1 guarantees that the approximation ratio is at most 2.
However, this is not so interesting, since even the simple algorithm that merges only the edges of weight zero achieves the same approximation ratio. In general, assume that theXuvsatisfy the following property: there exists a value 1/2≤c≤1 such that if Xuv 6∈ {0,1}, thenXuv ∈(1−c, c). We say that the values Xuv are symmetrically bounded byc. In this case, Lemma 1 guarantees that the approxima-tion ratio of any algorithm that merges all the zero weight edges, and none of the weight one is at at mostc/(1−c). Forc <3/4 we guarantee that the approximation ratio is strictly less than 3. Note that for correlation clustering problems derived from clustering aggregation instances the distance values are always symmetrically bounded by (m−1)/m, yielding an approximation ratiom−1.
5.3 TheAgglomerative algorithm
For theAgglomerative algorithm we can prove that for all input instances such that the Xuv values are symmetrically bounded byc, the algorithm achieves ap-proximation ratioc/(1−c). Although, as we noted before, this is achieved by any algorithm that merges all edges of weight zero, and splits all edges of weight one, it is not clear that theAgglomerativealgorithm satisfies this requirement, since we cannot guarantee that the algorithm will not merge any edge of weight one. We can prove the following theorem.
Theorem 3. Assume that for all input instancesI ∈ I for the correlation clus-tering problem the values Xuv are symmetrically bounded by c, for 1/2 ≤c < 1. Then theAgglomerativealgorithm has approximation ratioR(Agglomerative)≤
c c−1.
Proof. We are going to bound the approximation ratio ofAgglomerativeby bounding the approximation ratio achieved at each step of the algorithm. First we note that in the first steps theAgglomerative algorithm will merge all edges of weight zero. This is due to the fact that edges with zero weight appear always in cliques (once again due to triangle inequality). Obviously no approximation error is induced for these merges, thus we can examine the behavior of the algorithm after these merges have been completed. We can thus assume that all subsequent merges involve only edges with weight greater than zero.
Consider now one step of the algorithm after all zero-weight edges have been merged, and let k be the number of edges merged by the algorithm at that step. Let{c1, c2, ..., cp}denote the set of all distinct weights that these edges take (p≤ k), in decreasing order. Assume that c1 = 1, otherwise Lemma 1 provides the upper bound to the approximation ratio.1 We have that c
p > 0, since we have assumed that all edges of weight zero have already been merged. Let ki denote the number of edges of weightci. The cost paid by the agglomerative algorithm is A=k1+k2c2+· · ·+kpcp. From the definition of the algorithm we have that
k1+k2c2+· · ·+kpcp k1+· · ·+kp
≤1
2. Solving fork1 we obtain
k1≤(1−2c2)k2+ (1−2c3)k3+· · ·+ (1−2cp)kp Therefore
A≤(1−c2)k2+ (1−c3)k3+· · ·+ (1−cp)kp≤c(k2+k3+· · ·+kp), since for all weights 1−c≤ci≤c, and thus 1−c≤1−ci≤c.
Now let cq denote the smallest of the weights such that cq >1/2. The cost of the optimal solution for these edges is at least
O= (1−c2)k2+· · ·(1−cq)kq+cq+1kq+1+· · ·cpkp≥(1−c)(k2+k3+· · ·+kp) Therefore, the approximation ratio isA/O≤c/(1−c) which concludes the proof.
2
For correlation clustering problems that arise from clustering aggregation prob-lem instances, Theorem 3 guarantees that when merging m clusterings the Ag-glomerativealgorithm has approximation ratio at mostm−1.
6. EXPERIMENTAL EVALUATION
We have conducted extensive experiments to test the quality of the clusterings produced by our algorithms on a varied collection of synthetic and real datasets. Furthermore, for ourSamplingalgorithm, we have experimented with the quality vs. running-time trade off.
1There are cases where a better approximation ratio may be proven, whenc
p<1. For example,
6.1 Improving clustering robustness
The goal in this set of experiments is to show how clustering aggregation can be used to improve the quality and robustness of widely used vanilla clustering algo-rithms. For the two experiments we are describing we used synthetic datasets of two-dimensional points.
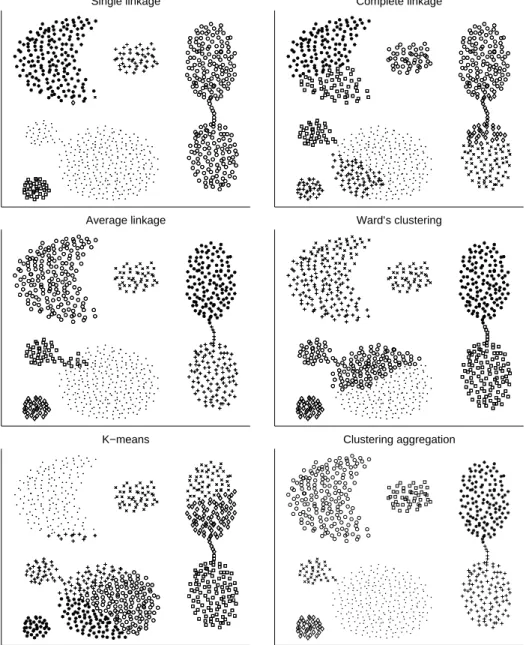
The first dataset is shown in Figure 3. An intuitively good clustering for this dataset consists of the seven perceptually distinct groups of points. We ran five different clustering algorithms implemented in MATLAB: single linkage, complete linkage, average linkage, Ward’s clustering, andk-means. For all of the clusterings we set the number of clusters to be 7, and for the rest parameters, if any, we used MATLAB’s defaults. The results for the five clusterings are shown in the first five panels of Figure 3. One sees that all clusterings are imperfect. In fact, the dataset contains features that are known to create difficulties for the selected algorithms, e.g., narrow “bridges” between clusters, uneven-sized clusters, etc. The last panel in Figure 3 shows the results of aggregating the five previous clusterings. The aggregated clustering is better than any of the input clusterings (although average-linkage comes very close), and it shows our intuition of how mistakes in the input clusterings can be “canceled out”.
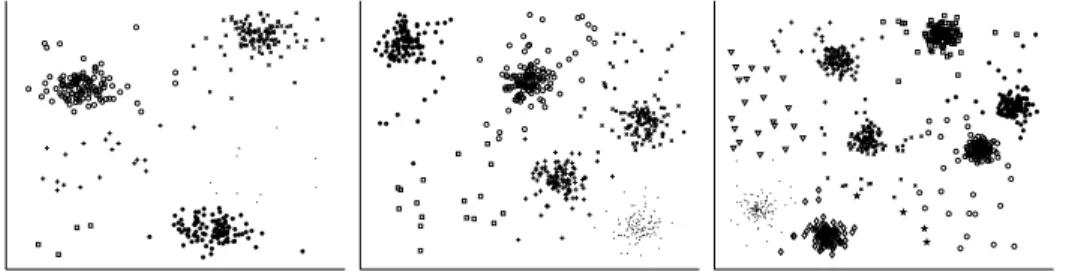
In our second experiment the goal is to show how clustering aggregation can be used to identify the “correct” clusters, as well as outliers. Three datasets were created as follows: k∗ cluster centers were selected uniformly at random in the unit square, and 100 points were generated from the normal distribution around each cluster center. For the three datasets we used k∗ = 3, 5, and 7, respectively. An additional 20% of the total number of points were generated uniformly from the unit square and they were added in the datasets. For each of the three datasets we ran k-means withk= 2,3, . . . ,10, and we aggregated the resulting clusterings, that is, in each dataset we performed clustering aggregation on 9 input clusterings. For lack of space, the input clusterings are not shown; however, most are imperfect. Obviously, whenkis too small some clusters get merged, and whenkis too large some clusters get split. The results of clustering aggregation for the three datasets are shown in Figure 4. We see that the main clusters identified are precisely the correct clusters. Some small additional clusters are also found that contain only points from the background “noise”, and they can be clearly characterized as outliers.
6.2 Clustering categorical data
In this section we use the ideas we discussed in Section 2 for performing clustering of categorical datasets. We used three datasets from the UCI Repository of ma-chine learning databases [Blake and Merz 1998]. The first dataset,Votes, contains voting information for 435 persons. For each person there are votes on 16 issues (yes/novote viewed as categorical values), and a class label classifying a person
as republicanor democrat. There are a total of 288 missing values. The second
dataset, Mushrooms, contains information on physical characteristics of mush-rooms. There are 8,124 instances of mushrooms, each described by 22 categorical attributes, such as shape, color, odor, etc. There is a class label describing if a mushroom is poisonous or edible, and there are 2,480 missing values in total. Finally, the third dataset, Census, has been extracted from the census bureau
Single linkage Complete linkage
Average linkage Ward’s clustering
K−means Clustering aggregation
Fig. 3. Clustering aggregation on five different input clusterings. To obtain the last plot, which is the result of aggregating the previous five plots, theAgglomerative
Fig. 4. Finding the correct clusters and outliers.
database, and it contains demographic information on 32,561 people in the US. There are 8 categorical attributes (such as education, occupation, marital status, etc.) and 6 numerical attributes (such as age, capital gain, etc.). Each person is classified according to whether they receive an annual salary of more than 50K or less.
For each of the datasets we perform clustering based on the categorical attributes, and we evaluate the clustering using the class labels of the datasets. The intuition is that clusterings with “pure” clusters, i.e., clusters in which all objects have the same class label, are preferable. Thus, if a clustering contains k clusters with sizes s1, . . . , sk, and the sizes of themajorityclass in each cluster arem1, . . . , mk, respectively, then we measure the quality of the clustering by an impurity index
measure, defined as I = Pk i=1(si−mi) Pk i=1si = Pk i=1(si−mi) n .
If a clustering hasI value equal to 0 it means that it contains only pure clusters. Notice that clusterings with many clusters tend to have smaller I values—in the extreme case if k = n then I = 0 since singleton clusters are pure. We remark that this measure is only indicative of the cluster quality. It is not clear that the best clusters in the dataset correspond to the existing classes. Depending on the application one may be interested in discovering different clusters.
We also run comparative experiments with the categorical clustering algorithm ROCK [Guha et al. 2000], and the much more recent algorithm LIMBO [Andritsos et al. 2004]. ROCK uses the Jaccard coefficient to measure tuple similarity, and places alink between two tuples whose similarity exceeds a thresholdθ. For our experiments, we used values of θ suggested by Guha et al. [Guha et al. 2000] in the original ROCK paper. LIMBO uses information theoretic concepts to define clustering quality. It clusters together tuples so that the conditional entropy of the attribute values within a cluster is low. For the parameter φof LIMBO we used again values suggested in [Andritsos et al. 2004].
The results for the Votes and Mushrooms datasets are shown in Tables III and IV, respectively. Except for the impurity index (I), we also show the number of clusters of each clustering (k), and the disagreement error (ED), that is, the objective function in Problem 2 optimized by our algorithms. This is the measure explicitly optimized by our algorithms. Since the clustering aggregation algorithms
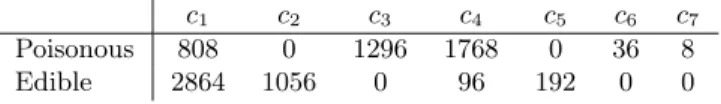
c1 c2 c3 c4 c5 c6 c7
Poisonous 808 0 1296 1768 0 36 8 Edible 2864 1056 0 96 192 0 0
Table I. Confusion matrix for class labels and clusters found by theAgglomerativealgorithm onMushroomsdataset.
make their own decisions for the resulting number of clusters, we have run the other two algorithms for the same values ofkso that we ensure fairness. Overall the impu-rity indices are comparable with the exception of LIMBO’s impressive performance
on Mushrooms for k = 7 and k = 9. Our algorithms achieve the low distance
error, with LocalSearch always having the lowest distance error. The distance error for LocalSearchis close to the theoretical lower bound that is computed by considering an idealized algorithm that merges all edges with weight less than
1
2, and splits all edges with weight more than 1
2. Furthermore, the attractiveness of the algorithmsAgglomerative,Furthest, andLocalSearchis in the fact that they are completely parameter-free. Neither a threshold nor the number of clusters need to be specified. The number of clusters discovered by our algorithms seem to be very reasonable choices: for the Votesdataset, most people vote according to the official position of their political parties, so having two clusters is natural; for the Mushroomsdataset, notice that both ROCK and LIMBO achieve much better quality for the suggested valuesk = 7 and k = 9, so it is quite likely that the correct number of clusters is around these values. Indicatively, in Table I we present the confusion matrix for the clustering produced by theAgglomerative
algorithm on theMushroomsdataset.
For the Census dataset, clustering aggregation algorithms report about 50-60 clusters. To run clustering aggregation on the Census dataset we need to resort to theSamplingalgorithm. As an indicative result, when theSamplinguses the
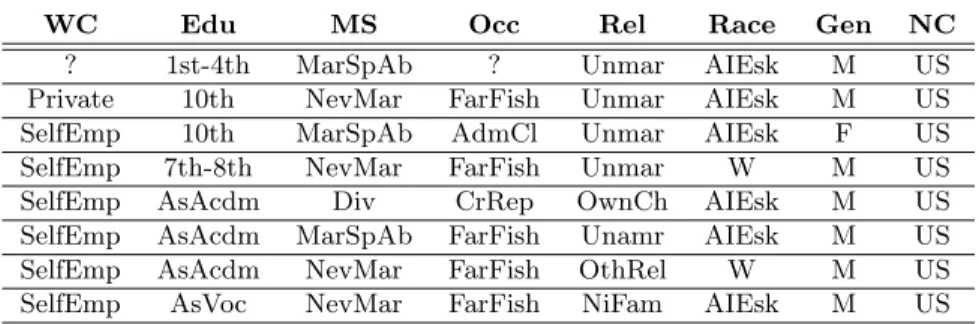
Furthest algorithm to cluster a sample of 4,000 persons, we obtain 54 clusters and the impurity index is 24%. ROCK does not scale for a dataset of this size, while LIMBO with parametersk= 2 andφ= 1.0 gives impurity index 27.6%. For contrasting these numbers, we mention that supervised classification algorithms (like decision trees and Bayes classifiers) yield classification error between 14 and 21%—but again, we note that clustering is a conceptually different task than classi-fication. We visually inspected some of the smallest of the 54 different clusters, and many corresponded to distinct social groups; for example, male Eskimos occupied with farming-fishing, married Asian-Pacific islander females, unmarried executive-manager females with high-education degrees, etc. An example of such a small cluster is shown in Table II.
6.3 Handling large datasets
In this section we describe our experiments with theSamplingalgorithm that al-lows us to apply clustering aggregation to large datasets. First we use the
Mush-rooms dataset to experiment with the behavior of our algorithms as a function
of the sample size. As we saw in Table IV, the number of clusters found with the non-sampling algorithms is around 10. When sampling is used, the number of clus-ters found in the sample remains close to 10. For small sample size, clustering the
WC Edu MS Occ Rel Race Gen NC
? 1st-4th MarSpAb ? Unmar AIEsk M US
Private 10th NevMar FarFish Unmar AIEsk M US SelfEmp 10th MarSpAb AdmCl Unmar AIEsk F US SelfEmp 7th-8th NevMar FarFish Unmar W M US SelfEmp AsAcdm Div CrRep OwnCh AIEsk M US SelfEmp AsAcdm MarSpAb FarFish Unamr AIEsk M US SelfEmp AsAcdm NevMar FarFish OthRel W M US SelfEmp AsVoc NevMar FarFish NiFam AIEsk M US
Table II. An example of a small cluster representing a distinct social group. The attributes of the table are as follows: WC: Workclass, Edu: Education, MS: Mar-status, Occ: Occupation, Rel: Re-lationship, Race: Race, Gen: Gender, and NC: Nat-country. The values in the table are as follows: ?: missing value, SelfEmp: Self-emp-not-inc, MarSpAb: Married-spouse-absent, AsAcdm: Assoc-acdm, AsVoc: Assoc-voc, NevMar: Never-married, Div: Divorced, FarFish: Farming-fishing, Cr-Rep: Craft-repair, Unmar: Unmarried, OthRel: Other-relative, OwnCh: Own-child, NiFam: Not-in-family, AIEsk: Amer-Indian-Eskimo, W: White, M: Male, F: Female, AdmCl: Adm-clerical.
Algorithm k I(%) ED Class labels 2 0 34,184 Lower bound 28,805 BestClustering 3 15.1 31,211 Agglomerative 2 14.7 30,408 Furthest 2 13.3 30,259 Ballsα=0.4 2 13.3 30,181 LocalSearch 2 11.9 29,967 ROCKk=2,θ=0.73 2 11 32,486 LIMBOk=2,φ=0.0 2 11 30,147 Table III. Results on Votes dataset. k is the number of clusters,Iis the impurity index, and
ED is the disagreement error. The lower bound
onED is computed by considering an algorithm
that merges all edges with weight less than 12, and splits all edges with weight greater than 12.
Algorithm k I(%) ED(×106) Class labels 2 0 13.537 Lower bound 8.388 BestClustering 5 35.4 8.542 Agglomerative 7 11.1 9.990 Furthest 9 10.4 10.169 Ballsα=0.4 10 14.2 11.448 LocalSearch 10 10.7 9.929 ROCKk=2,θ=0.8 2 48.2 16.777 ROCKk=7,θ=0.8 7 25.9 10.568 ROCKk=9,θ=0.8 9 9.9 10.312 LIMBOk=2,φ=0.3 2 10.9 13.011 LIMBOk=7,φ=0.3 7 4.2 10.505 LIMBOk=9,φ=0.3 9 4.2 10.360 Table IV. Results onMushroomsdataset.
sample is relatively fast compared to the post-processing phase of assigning the non-sampled points to the best cluster, and the overall running time of theSampling
algorithm is linear. In Figure 5 (left), we plot the running time of the Sampling
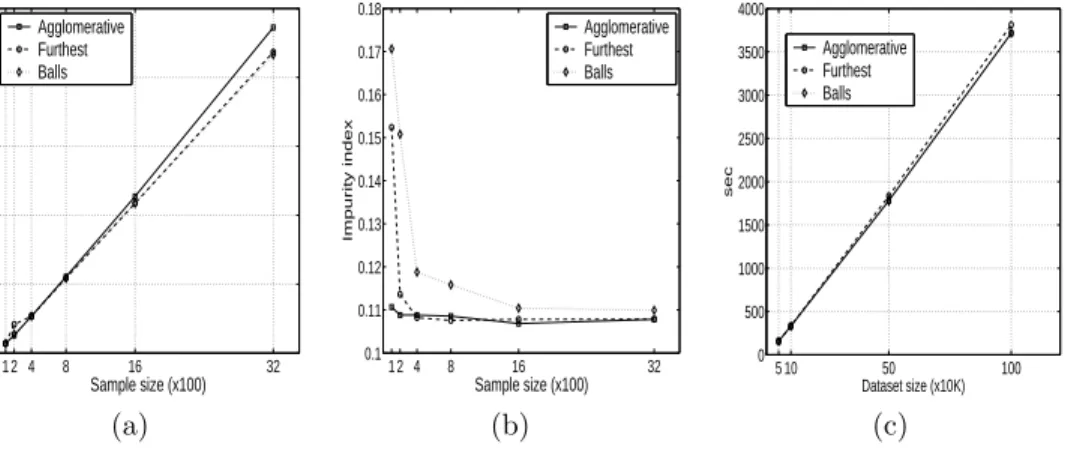
algorithm, as a fraction of the running time of the non-sampling algorithm, and we show how it changes as we increase the sample size. For a sample of size 1600 we achieve more than 50% reduction of the running time. At the same time, the impurity index of the algorithm converges very fast to the value achieved by the the non-sampling algorithms. This is shown in Figure 5 (middle). For sample size 1600 we have almost the same impurity index, with only half of the running time. We also measured the running time of theSamplingalgorithm for large synthetic datasets. We repeated the configuration of the experiments shown in Figure 4 but on a larger scale. Each dataset consists of points generated from clusters normally distributed around five centers plus an additional 20% of uniformly distributed
1 2 4 8 16 32 0 0.2 0.4 0.6 0.8 1 Running time Sample size (x100) Mushrooms dataset Agglomerative Furthest Balls 1 2 4 8 16 32 0.1 0.11 0.12 0.13 0.14 0.15 0.16 0.17 0.18 Impurity index Sample size (x100) Mushrooms dataset Agglomerative Furthest Balls 5 10 50 100 0 500 1000 1500 2000 2500 3000 3500 4000 sec Dataset size (x10K) Synthetic dataset Agglomerative Furthest Balls (a) (b) (c)
Fig. 5. Scalability Experiments for theSamplingalgorithm. (a)The running time as a fraction of the time for the whole dataset plotted against the sample size. (b)
The impurity index as a function of the sample size. (c) The running time as a function of the dataset size.
points. We generate datasets of sizes 50K, 100K, 500K, and 1M points. We then cluster the points using MATLAB’sk-means for k= 2, . . . ,10, and we run Sam-plingclustering aggregation on the resulting 9 clusterings. The results are shown in Figure 5 (right). These results are for sample size equal to 1000. Once again, the five correct clusters were identified in the sample, and the running time is dom-inated by the time to assign the non-sampled points in the clusters of the sample, resulting to the linear behavior shown in the figure.
7. RELATED WORK
A source of motivation for our work is the literature on comparing and merging multiple rankings [Dwork et al. 2001; Fagin et al. 2003]. Dwork et al. [Dwork et al. 2001] demonstrated that combining multiple rankings in a meta-search engine for the Web yields improved results and removes noise (spam). The intuition behind our work is similar. By combining multiple clusterings we improve the clustering quality, and remove noise (outliers).
The problem of clustering aggregation has been previously considered in the machine learning community, under the nameClustering Ensemble andConsensus Clustering. Strehl and Ghosh [Strehl and Ghosh 2002] consider various formulations for the problem, most of which reduce the problem to a hyper-graph partitioning problem. In one of their formulations they consider the same graph as in the correlation clustering problem. The solution they propose is to compute the best k-partition of the graph, which does not take into account the penalty for merging two nodes that are far apart. All of their formulations assume that the correct number of clusters is given as a parameter to the algorithm.
Fern and Brodley [Fern and Brodley 2003] apply the clustering aggregation idea to a collection of soft clusterings they obtain by random projections. They use an agglomerative algorithm similar to ours, but again they do not penalize for merging
dissimilar nodes. Fred and Jain [Fred and Jain 2002] propose to use a single linkage algorithm to combine multiple runs of thek-means algorithm. Dana Cristofor and Dan Simovici [Cristofor and Simovici 2001] observe the connection between clus-tering aggregation and clusclus-tering of categorical data. They propose information theoretic distance measures, and they propose genetic algorithms for finding the best aggregation solution. Boulis and Ostendorf [Boulis and Ostendorf 2004] use Linear Programming to discover a correspondence between the labels of the indi-vidual clusterings and those of an “optimal” meta-clustering. Topchy et al. [Topchy et al. 2004] define clustering aggregation as a maximum likelihood estimation prob-lem, and they propose an EM algorithm for finding the consensus clustering. Filkov and Skiena [Filkov and Skiena 2003] consider the same distance measure between clusterings as ours. They propose a simulating annealing algorithm for finding an aggregate solution, and a local search algorithm similar to ours. They consider the application of clustering aggregation to the analysis of microarray data.
There is an extensive literature in the field of theoretical computer science for the problem of correlation clustering. The problem was first defined by Bansal et al. [Bansal et al. 2002]. In their definition, the input is a complete graph with +1 and -1 weights on the edges. The objective is to partition the nodes of the graph so as to minimize the number of positive edges that are cut, and the number of negative edges that are not cut. The best known approximation algorithm for this problem is by Charikar et al. [Charikar et al. 2003] who give an LP-based algorithm that achieves a 4 approximation factor. When the edge weights are arbitrary, the problem is equivalent to the multi-way cut, and thus there is a tight O(logn)-approximation bound [Demaine and Immorlica 2003; Emanuel and Fiat 2003]. If one considers the corresponding maximization problem, that is, maximize the agreements rather than minimize disagreements, then the situation is much better. Even in the case of graphs with arbitrary edge weights there is a 0.76-approximation algorithm using semi-definite programming [Charikar et al. 2003; Swamy 2004].
Recently, Ailon et al. [Ailon et al. 2005] considered a variety of correlation clus-tering problems. They proposed an algorithm very similar to theBallsalgorithm, and they showed that if the weights obey theprobability condition(that is, for every edge (i, j), the cost for taking that edge is Xij ∈[0,1], while the cost for splitting an edge is 1−Xij), then their algorithm achieves expected approximation ratio 5. If the weightsXij obey also the triangular inequality, then the algorithm achieves expected approximation ratio 2. For the clustering aggregation problem they show that choosing the best solution between their algorithm and theBestClustering
algorithm yields a solution with expected approximation ratio 11/7.
Our work differs from the work of Ailon et al. [Ailon et al. 2005] in that we provide a worst case approximation ratio for the correlation clustering problem. Furthermore, we investigate experimentally the performance of our algorithms for various applications, such as clustering of categorical data, clustering robustness, and finding the correct number of clusters. For the problem of categorical clustering we compare our algorithms with various existing algorithms to demonstrate the benefits of our approach.