WORKING PAPER #500 PRINCETON UNIVERSITY
INDUSTRIAL RELATIONS SECTION FEBRUARY 2006
http://www.irs.princeton.edu/pubs/working_papers.htm
Racial Segregation and the Black-White Test Score Gap
David Card Jesse Rothstein
Department of Economics Department of Economics University of California Berkeley Princeton University
and NBER and NBER
February 2006
ABSTRACT
Racial segregation is often blamed for some of the achievement gap between blacks and whites. We study the effects of school and neighborhood segregation on the relative SAT scores of black students across different metropolitan areas, using large microdata samples for the 1998-2001 test cohorts. Our models include detailed controls for the family background of individual test-takers, school-level controls for selective participation in the test, and city-level controls for racial composition, income, and region. We find robust evidence that the black-white test score gap is higher in more segregated cities. Holding constant family background and other factors, a shift from a fully segregated to a completely integrated city closes about one-quarter of the raw black-white gap in SAT scores. Specifications that distinguish between school and neighborhood segregation suggest that neighborhood segregation has a consistently negative impact but that school segregation has no independent effect (though we cannot reject equality of the two effects). We find similar results using Census-based data on schooling outcomes for youth in different cities. Data on enrollment in honors courses suggest that within-school segregation increases when schools are more highly integrated, potentially offsetting the benefits of school desegregation and accounting for our findings.
We are grateful to the Andrew Mellon Foundation and the College Board for assistance in obtaining the SAT data used in this study, and to Jacob Vigdor, Jon Guryan, and Sarah Reber for supplying other data. We thank Florence Neymotin and Ashley Miller for outstanding research assistance, and Ken Chay, Nicole Fortin, Jeff Kling, Thomas Lemieux, Justin McCrary, and seminar participants at Berkeley, Columbia, Syracuse, Yale, NBER, and the Universities of Connecticut, Illinois, and Maryland for helpful comments and suggestions. Card’s research was supported by a grant from the NICHD and Rothstein’s by Princeton’s Center for Economic Policy Studies.
Racial Segregation and the Black-White Test Score Gap
February 2006
ABSTRACT
Racial segregation is often blamed for some of the achievement gap between blacks and whites. We study the effects of school and neighborhood segregation on the relative SAT scores of black students across different metropolitan areas, using large microdata samples for the 1998-2001 test cohorts. Our models include detailed controls for the family background of individual test-takers, school-level controls for selective participation in the test, and city-level controls for racial composition, income, and region. We find robust evidence that the black-white test score gap is higher in more segregated cities. Holding constant family background and other factors, a shift from a fully segregated to a completely integrated city closes about one-quarter of the raw black-white gap in SAT scores. Specifications that distinguish between school and neighborhood segregation suggest that neighborhood segregation has a consistently negative impact but that school segregation has no independent effect (though we cannot reject equality of the two effects). We find similar results using Census-based data on schooling outcomes for youth in different cities. Data on enrollment in honors courses suggest that within-school segregation increases when schools are more highly integrated, potentially offsetting the benefits of school desegregation and accounting for our findings.
The racial gap in student achievement is a pervasive and divisive feature of American life. Black-white differences in standardized test scores lie at the core of the debate over affirmative action in college admissions (Bowen and Bok, 1998; Kane, 1998) and public sector hiring (McCrary, 2004), and figure prominently in the recent No Child Left Behind Act. Many years before the Supreme Court’s Brown v. Board decision, segregation was identified as a possible factor in the academic achievement of black children.1 Studies since
the Coleman Report (Coleman, 1966) have found that test scores are lower at schools with higher black enrollment shares (see, e.g., Ferguson 1998, and the review by Schofield 1995). Likewise, there is a strong negative correlation between education outcomes and the fraction of black residents in a neighborhood (e.g., Massey and Denton, 1993).
Establishing whether segregation actually causes lower achievement is difficult, however, because individuals are not randomly assigned to neighborhoods or schools.2 A
credible research design has to address the possibility that students who attend schools with larger black enrollment shares – or live in predominantly black neighborhoods – have other characteristics that contribute to their lower achievement. In this paper, we circumvent the endogeneity of school and neighborhood choice by aggregating to the metropolitan level and relating the black-white achievement gap in a metropolitan area to black-white differences in relative exposure to minority neighbors and schoolmates.3 Differencing eliminates the
effects of city-wide variables that may be correlated with racial segregation (such as the level
1 Crowley (1932) presents an early study of the effect of racially segregated schools on academic achievement,
based on comparisons of test scores for black students in two all-black and four mixed-race schools in Cincinnati. She constructed matched samples from the two groups of schools, matching on age, grade, and IQ, and found no difference in achievement test scores between the schools.
2 On the general problem of inferring peer group effects from observational data, see Manski (1993) and Brock
and Durlauf (2001).
3 Although cities with segregated neighborhoods tend to have segregated schools, school segregation also
depends on institutional features like the number of school districts (Urquiola, 2005) and the presence of desegregation programs (Reber, 2005). We show below that the two have substantial independent variation.
of school spending or the efficiency of local schools). 4 We also control for a rich set of
measured differences in the family backgrounds of test-takers, and for other variables, like city size and income inequality, that may affect black student’s relative achievement. We apply this approach to a large sample of SAT-takers from the 1998-2001 cohorts of high school graduates.
We reach two main conclusions. First, there is a robust and quantitatively important relationship between black relative test scores and the degree of segregation in different metropolitan areas. Our estimates suggest that the move from a highly segregated city to an integrated city is associated with a 45 point narrowing of the black-white SAT gap – about one-quarter of the raw differential. Second, neighborhood segregation seems to matter more than school segregation: In models that include both measures we consistently find that neighborhood segregation exerts a strong negative effect on relative test scores, whereas the effects of school segregation are small and statistically insignificant. We cannot reject, however, that the two have equal effects.
These findings are robust to a variety of specifications and estimation strategies. We focus on two main problems that might lead us to overstate the effects of segregation: differential sorting of white and black families across different cities, and the possibility that segregation is affected by the relative abilities of black and white students in a city. We show that our estimated segregation effects are unaffected by including a control for the residual wage gap between black and white workers in a city, which should proxy for unobserved family background differences that would result from either source of endogeneity. We also examine the changing inter-city distributions of higher- and lower-educated whites and blacks and find no evidence of selective migration, once we control for
4 Throughout this paper we use “cities” to refer to metropolitan areas – specifically, Metropolitan Statistical
observed city characteristics. Finally, we show that measures of residential and school segregation in a city are highly persistent, and therefore unlikely to be responsive to recent shocks to unobserved student ability. Even controlling for neighborhood segregation the remaining component of school segregation is extremely stable, suggesting that the small school segregation coefficients cannot be attributed to measurement error in this variable.
A third potential concern is selective participation in the SAT. Our analyses all point to the conclusion that, if anything, sample selection leads our results to understate the effects of segregation on black relative achievement. As a robustness check, however, we estimate a series of models using 2000 Census data on schooling outcomes of 16-24 year olds.
Estimates from these models are similar to our SAT results.
The finding that black relative achievement is unaffected by differences in school segregation, once we control for neighborhood segregation, leads us to consider the role of
within-school segregation. Holding constant the level of neighborhood segregation, white students are more likely to enroll in honors classes in cities with more integrated schools, whereas blacks are not. This behavior is consistent with the presence of ability tracking programs that offset the integrative effects of between-school desegregation efforts (Clotfelter, Ladd, and Vigdor, 2003; Clotfelter, 2004), and may help to explain why differences in school segregation have little effect on black relative achievement.
We conclude with an analysis that attempts to distinguish between the direct effects of racial segregation and “indirect” effects operating through school quality and the relative exposure of black and white students to lower income peers. Measures of relative school quality are uncorrelated with the relative exposure of black students to minority neighbors or schools, so the potential for these variables to contribute to observed segregation effects is very small. On the other hand, segregation is highly correlated with exposure to low-income
peers at both the school and neighborhood levels. Consistent with our finding that minority exposure at the school level has little or no effect on black relative achievement (holding constant neighborhood exposure), exposure to high-poverty schoolmates also has no effect. But relative neighborhood income does seem to be an important determinant of test score gaps, and accounts for as much as half of our estimated residential segregation effects.
II. The Effects of Segregated Schools and Neighborhoods on Student Achievement
a. Theoretical Channels
The literature has identified four mechanisms through which racial or ethnic
segregation might affect the educational achievement of black students. First, what might be called “direct” exposure effects arise in peer group models where minorities have lower expectations or aspirations than non-minorities (all else held constant). For example, models of race-based cultural norms (e.g., Ogbu and Forham, 1986; Ogbu, 2003) assert that black children have lower norms of achievement than otherwise similar whites, and that exposure to peers with lower aspirations reduces achievement. Since segregation by definition raises the relative exposure of black students to black peers, pure exposure effects create a link from segregation to the black-white achievement gap.5
A second set of “indirect” exposure effects arise from the correlation between minority status and other characteristics that may negatively effect achievement. Black children, for example, are more likely to have a single parent than white children. If single-parent families have lower educational aspirations, and if student performance is affected by
5 A similar prediction arises from Austen-Smith and Fryer’s (2005) model of endogenous peer group
interactions, although in this model the negative effect of black peers reaches a peak when the fraction black is ½, and disappears in an all-black setting. This model also predicts that the negative effects of exposure to black peers are concentrated among black children with low potential achievement, whereas Ogbu’s (2003) study focuses on black children with high potential achievement.
peer aspirations (Coleman, 1966; Sewell and Hauser, 1975) then a rise in segregation will lower the relative achievement of black children.
While theoretically important, the distinction between direct and indirect exposure effects is empirically inaccessible. An important example is test score performance (Hoxby, 2000). Suppose that a given student’s achievement is affected by the average academic ability of his or her classmates. Since black students have lower test scores than whites, and much of this gap is unexplained by observed family background factors, one could argue that a higher fraction of black peers exerts a direct exposure effect via the academic ability of the peer group. Alternatively, one could argue that the black-white test score gap reflects unmeasured background factors, and is properly interpreted as an indirect exposure effect. In our main analysis we make no distinction between direct and indirect exposure effects, although in later specifications we estimate minority exposure effects holding constant exposure to low-income schoolmates and neighbors.
Another channel through which racial or ethnic exposure could indirectly affect relative achievement is through differences in school quality that are correlated with the racial composition of schools. In the pre-Brown v. Board era, separate school systems made it possible for white voters to divert resources from black to white schools (Boozer, Krueger, and Wolkon, 1992). Even today, concerns over differential resources are central to litigation over school finance rules (Schrag, 2003) and to accountability rules that hold schools
responsible for race-specific achievement levels.
Finally, there may be “macro” influences that create a direct link from segregation to black relative achievement. If, for example, the nature of the local broadcast media varies across cities—with, perhaps, more racially targeted radio stations in cities with more segregation—exposure to the media culture could produce effects of city-level segregation
even on children who live in racially mixed neighborhoods. Models of statistical
discrimination (e.g. Coate and Loury, 1993) could yield similar results. Students’ education choices might be influenced by local (white) employers’ attitudes toward blacks, which might in turn depend on the extent of employers’ exposure to black neighbors and schoolmates. These models imply impacts of city-level segregation that extend beyond any direct effects of neighborhood- and school-level exposure.
b. Previous Evidence on Peer Group and Segregation Effects
Much of the existing literature has equated the effect of segregation with that of school-level exposure to black or minority peers, and has documented that student achievement is lower in schools with a higher fraction of black or minority students. Coleman (1966), for example, found that black students earned lower test scores at schools with a higher black enrollment share. As subsequent critics have emphasized, the
interpretation of these findings is clouded by the lack of controls for the non-random sorting of students to different types of schools (see e.g., Jencks and Mayer, 1990).
Recent researchers have adopted three main approaches to address the sorting issue: (1) using within-school variation in minority exposure; (2) using experimental or
quasi-experimental variation in exposure; and (3) aggregating to a level at which sorting is arguably reduced or eliminated.
Hoxby (2000) and Hanushek, Kain, and Rivkin (2002) follow the first approach. Both studies relate the achievement (or achievement growth) of students in different cohorts
at the same school with the racial and ethnic composition of their particular cohort. This research design assumes that, while students may sort across schools on the basis of long-run factors like average racial composition, choices are unaffected by cohort-specific
variation in these factors.6 Both papers find very large exposure effects. The estimates
reported by Hanushek, Kain, and Rivkin (2002), for example, imply that excess exposure of black students to black grademates causes the black-white test score gap to grow by 0.07 standard deviations with each year in school, enough to account for most of the black-white test score gap by 12th grade.7
Experimental evidence on the effects of neighborhood peers comes from the recent Moving to Opportunity (MTO) project, which offered incentives for public housing
residents to move to lower poverty neighborhoods (Sanbonmatsu et al., 2006). MTO had a modest effect on the quality of subjects’ neighborhoods (lowering the poverty rate by about 13 percentage points), but no significant effect on children’s academic achievement. The experiment has very limited power to measure the effect of exposure to minority neighbors, however, since it only lowered the fraction of minority neighbors of the treatment group by about 7 percentage points.8
Guryan (2004) conducts a quasi-experimental analysis of the effect of school segregation on black dropout rates, using variation in the scope and timing of major court-ordered desegregation plans in the 1970s and 1980s. He finds a modest but statistically significant effect, with black dropout rates falling 3 percentage points relative to whites as a result of policies that on average reduced relative black exposure to black schoolmates by
6 As in other contexts – for example between-twin estimates of returns to schooling (Bound and Solon, 1999) –
it is unclear whether this strategy reduces the covariance between racial exposure and unobserved ability relative to the remaining variation in exposure. An additional concern in the Hanushek, Kain and Rivkin (2002) study is that there may be systematic trends in the ethnic composition of schools that covary with trends in average student characteristics at the school. Hoxby (2000) pays special attention to such trend factors.
7 This is based on Hanushek, Kane, and Rivkin’s (2002) computation that integration would reduce the black
share in the average black student’s classroom by 25 percentage points and raise the black share in the average white student’s classroom by 5 percentage points. Using their estimated exposure effects (which vary by race), this would narrow the gap in gain scores by 0.07 (in standard deviations of level scores) per year, for a
cumulative effect over 12 years of 0.83 standard deviations. A key implication of their model is that the black-white test score gap rises with grade. This is not evident in aggregate data (Perie et al., 2005).
8 See Sanbonmatsu et. al (2006), Table 2. See also Jacob’s (2004) study of the effect of housing project
about 20 percentage points.9
A final strand of recent research uses an aggregate research design similar to our own. Although students of differing abilities may sort to different schools or neighborhoods within a given city, these studies assume that the distribution of potential abilities across metropolitan areas is as good as random (conditional on observed control variables). Evans, Oates, and Schwab (1992) use the average characteristics of the metropolitan area as
instruments for peer group characteristics. Cutler and Glaeser (1997) extend this idea by distinguishing between the outcomes of blacks and whites in the same city, under the weaker assumption that the black-white difference in potential ability in a city is unrelated to the degree of residential segregation. Our basic framework is very similar. We extend Cutler and Glaeser’s (1997) analysis by including a much richer set of family background and metropolitan-level control variables that may be correlated with segregation, by
distinguishing between the effects of school and neighborhood exposure, and by focusing on test scores as a measure of achievement.
c. Empirical Specification
We begin by assuming that the test score of a given student depends on his or her own characteristics, the racial composition of his or her school and neighborhood, other characteristics of schoolmates and neighbors, and an unobserved error with school- and neighborhood-level components that may vary by race. Specifically, we assume:
(1) yijsnc = Xijsncαj + Zsc βj + Wnc νj + Bscγj + Rncδj + ujsc + vjnc + εijsc ,
where yijsnc represents the test score (or some alternative measure of achievement) of student
9 As we discuss below, it is possible that in the longer run some of the integrative effect of desegregation
programs is offset by a rise in within-school segregation. Guryan’s (2004) estimates, which identify segregation effects on the earliest affected cohorts, would not incorporate such offsetting effects.
i of race group j who attends school s and lives in neighborhood n in city c, Xijsnc is a vector
of characteristics of the student, Zsc is a vector representing the average characteristics of the students in school s and other features of the school, Wnc is a vector of the average
characteristics of the neighborhood, Bsc represents the fraction of minority students in school s, Rnc is the fraction of minority residents in the neighborhood, ujsc is a shared error
component for students of group j in school s and city c, vjnc is a similar error component for residents of group j in neighborhood n, and εijnsc is an individual-level error (with mean 0 for
each race group in each school and neighborhood).10 The coefficients γ
j and δj capture the
direct effects of exposure to minority schoolmates and neighbors, while indirect effects would arise from omission of components of Z and W that are correlated with B and R.
Any non-randomness in the sorting of students to schools or neighborhoods produces a correlation between the unobserved error components in equation (1) and the measures of school- and neighborhood-level exposure, potentially biasing OLS estimates of γj and δj from student-level data. The effects of non-random sorting within a city can be eliminated by averaging the achievement outcomes of each race group to the city level. Specifically, equation (1) implies that the mean outcome of group j in city c is:
(1’) yjc = Xjc αj + Zjc βj + Wjc νj + Bjcγj + Rjcδj + μjc,
where Xjc represents the mean characteristics of students of group j in city c, Zjc and Wjc
represent the mean characteristics of the school-level and neighborhood-level peer groups of race-j students, Bjc is the average fraction of minority students at schools attended by race
group j in city c, Rjc is the average fraction of minority neighbors of students in group j in city c, and μjc is the average of ujsc+ vjnc across all students of race j in city c.
10 We do not include error components that vary by city or by race and city, since these will be absorbed by the
school × race effects. In our empirical specification, “minorities” are blacks and Hispanics; we have tested for differential effects of exposure to the two groups and fail to reject equality in a wide range of alternative specifications. Tables that report separate effects are available upon request.
Although averaging eliminates the effects of within-city sorting, there still may be differences in the average unobserved “abilities” of students -- or in the average quality of the local schools -- that would lead to biases in the estimation of equation (1’) across cities. Any differences that are common across race groups in a city can be “differenced out” by comparing blacks and whites within the same city. Specifically, (1’) implies:
(2) y1c - y2c = X1c α1 – X2cα2 + Z1c β1 – Z2cβ2 + W1c ν1 – W2c ν2 + B1cγ1 – B2cγ2
+ R1cδ1 – R2c δ2 + μ1c – μ2c,
where j=1 represents blacks and j=2 represents whites. If the coefficients in equation (1) are the same for whites and blacks, equation (2) takes a particularly simple form:
(2’) Δyc = ΔXc α + ΔZcβ + ΔWc ν + ΔBcγ + ΔRcδ + Δμc ,
where Δyc, for example, denotes the difference in mean test scores between blacks and
whites in the same city.
The differences ΔBc and ΔRc in equation (2’) are closely related to standard
segregation indexes of “exposure” and “isolation.”11 When schools and neighborhoods are
fully segregated, B1c = R1c = 1 and B2c = R2c =0, so ΔBc = ΔRc = 1. When they are
completely integrated, B1c = B2c and R1c = R2c, so ΔBc = ΔRc = 0. ΔZc and ΔWc measure
other differences in the schools and neighborhoods of black and white children, such as the gap in average school quality between the schools attended by blacks and whites, or the gap in average incomes in the neighborhoods of black and white children.
Although differencing eliminates any city-wide factors that affect blacks and whites equally, there may be remaining differences in unobserved determinants of achievement between the two groups. We posit that this remaining gap can be decomposed as:
11 In the segregation literature (e.g. Massey and Denton, 1988; Iceland, Weinberg, and Stienmetz, 2002), Bjc and
Rjc are known as indices of exposure of race-j students to minorities, and ΔBc and ΔRc are similar to isolation
(3) μ1c - μ2c = Fcψ + ηc ,
where Fc is a vector of city characteristics—including measures of the city racial
composition—and ηc represents all remaining unobserved differences. This leads to a model
of the form:
(4) Δyc = ΔXc α + ΔZcβ + ΔWc ν + ΔBcγ + ΔRcδ + Fcψ + ηc .
OLS estimation of this equation will yield consistent estimates of γ and δ provided that ηc is
uncorrelated with ΔBc and ΔRc, conditional on the control variables included in (4). A key threat to the identification of the segregation effects in equation (4) is
differential sorting of black and white families to different metropolitan areas. For example, if achievement-oriented black families migrate to cities where schools or neighborhoods are less racially segregated, and if their characteristics are not fully captured in the measured student background variables, then ηc may be negatively correlated with ΔBc and/or ΔRc.
Our main specifications include a rich set of controls for the observed characteristics of black and white students in different cities, including parental education and income, as well as various city-level variables. In Section V, however, we present some robustness checks and additional analyses to evaluate the likely biases in these models.
Our main analyses simplify equation (4) in two ways. First, as we noted in Section II, it is unrealistic to assume that all the relevant characteristics of schoolmates and neighbors can be measured. We therefore focus on a “reduced form” specification that excludes the W and Z variables:
(5) Δyc = ΔXc α’ + ΔBcγ’ + ΔRcδ’ + Fcψ’ + ηc ,
where γ’ and δ’ are related to γ and δ by the usual omitted variables formulas. Thus, γ’ will incorporate the direct effects of exposure to minority schoolmates, indirect effects associated with the characteristics of the schools and neighborhoods that can be predicted from
knowledge of ΔBc,, conditional on ΔRc, and any “macro” effects of city-wide school
segregation. In section V, below, we attempt to estimate the indirect exposure effects that derive from school resources and the incomes of schoolmates and neighbors.
Second, we present estimates both of equation (5) and of even simpler specifications that include only one of the segregation measures at a time. School and neighborhood segregation are highly correlated across cities, making it difficult to distinguish their separate effects even when the combined effect is precisely estimated. When only residential
segregation is included, for example, the resulting coefficient provides an estimate of δ’+πγ’, where π is the coefficient on ΔR from an auxiliary regression of ΔB on ΔR, ΔX, and F. Empirically, π is close to one, so the coefficient is approximately the sum of δ’ and γ’.
d. Taking Advantage of Student-Level Covariates
The aggregated model (5) has only as many degrees of freedom as the number of metropolitan areas in the sample, limiting the flexibility of our controls for family
background factors. To fully exploit our rich microdata, we partial out the student-level covariates observed in the SAT files (mother’s education, father’s education, and family income), using a highly flexible specification that is fully interacted by race. We then aggregate “residual” SAT scores to the city level, and include sparser parameterizations of the ΔX vector in our city-level analysis. The procedure is described in greater detail in the Appendix. Although the first stage adjustment may not fully eliminate the effect of
observable student characteristics, we anticipate that the inclusion of ΔXc in the second stage
model absorbs most of their remaining variation.
A concern with the use of SAT test scores to measure achievement is selective test participation. As discussed below, we restrict our sample to cities in states where a majority of college-bound students write the SAT (rather than the alternative ACT test). Even within “SAT states”, however, test participation rates vary. Presumably, students at “low
performing” schools are represented in the test-taking population, with greater under-representation in cities with lower overall participation. Positive selection into participation will tend to attenuate any negative effects of segregation on black relative test scores (Gronau, 1974; Heckman, 1979).12 We attempt to reduce such biases by re-weighting the average
scores from different high schools in a city to reflect their relative enrollments, and by including a control function in our empirical model based on relative SAT participation rates across high schools in a city.
These adjustments are derived from a conventional bivariate normal model of test participation and test score outcomes (Heckman, 1979). As shown in the Appendix, such a model leads to a specification for the black-white difference in the adjusted, reweighted test scores in city c that differs from equation (5) by the addition of two terms:
(6) Δrc = ΔX’cα’ + ΔBcγ’ + ΔRcδ’ + Fcψ’ + ζΔλc + ζ Δθc + ηc + Δec . In this equation, ζ is a coefficient that reflects the correlation between the unobserved component of the individual test participation equation and the unobserved component of the test outcome equation, Δλc is the black-white difference in the enrollment-weighted
average of the school-specific inverse Mills ratio function (evaluated at the test participation rate of black or white students at each high school in the city), and Δθc is an unobserved
error component that reflects the black-white difference in the degree of within-school
12 The correlation of SAT-taking rates and average scores across schools is positive in our data, which would be
consistent with negative selection into test-taking. We strongly suspect that the individual level selection is positive, but that large differences in the unobserved determinants of participation rates and mean scores dominate the across-school correlation.
selectivity of test-writers.
If test takers were randomly selected at each high school, but different fractions of students wrote the test at different schools, the control function Δλc would fully correct for
selectivity biases in the observed test scores and Δθc would equal 0. In general, however, test writers are not randomly selected within schools and so the error component Δθc will not
vanish. If a rise in school or neighborhood segregation causes black relative test scores to fall but also causes a rise in the relative within-school selectivity of black test takers, the presence of this term will lead to attenuation in the estimated negative effect of segregation on relative test scores.
III. Data Sources and Sample Overview
Our primary source of student achievement data is a sample of SAT records for roughly one third of test takers in the 1998-2001 high school graduation classes.13 These
data include self-reported family background characteristics as well as high school identifiers, which we use to match enrollment from the appropriate editions of the Common Core of Data (CCD, for public school students) and the 1997-8 Private School Survey (PSS). To minimize the impact of measurement errors we estimate the number of students, the number of test takers, and the racial composition of each school using averages over the four years in our data.14 We assign students to Metropolitan Statistical Areas (MSAs) based
on year-2000 definitions, using school location information in the CCD and PSS files.15 We
13 The sampling rate was 100% for black and Hispanic test-takers and for those from California and Texas, and
25% for others. We use sampling weights in all computations of city-level averages. We exclude observations for students who reported ethnicity other than white or black (primarily Hispanics and Asians) and those who did not report their race/ethnicity.
14 This strategy cannot be employed with the PSS, as only one year of data is available.
15 Where a larger metropolitan area is designated a Consolidated Metropolitan Statistical Area (CMSA) with
several sub-areas (Primary Metropolitan Statistical Areas, or PMSAs), we treat the PMSA as the relevant city definition. In every specification, however, we estimate standard errors that are “clustered” by CMSA.
restrict our analysis of SAT outcomes to MSAs in states with overall test participation rates of 25% or higher, which we refer to as “SAT states.”
As described above, we use the SAT microdata to estimate race-specific, within-school models relating test scores to three key family background variables -- mother’s education, father’s education, and income.16 We then form an enrollment-weighted average
of the residual scores for black and white students from the high schools in each city. Our primary dependent variable is the black-white difference in this weighted average.
Recognizing that SAT scores are influenced not just by the racial composition of a student’s 12th-grade school but also by the composition of her schools in earlier grades, we
attempt to measure the average exposure of white and black students to minority schoolmates throughout their educational careers. We compute exposure rates for high schools in the MSA in 1998-2001 and for elementary schools in 1988-1991, and form an average of these that puts two-thirds weight on the latter and one-third on the former. Our school segregation measure is the black-white difference in this lifetime exposure measure.17
We use data on the racial composition and population of Census tracts in 2000 (from the full population counts, Census 2000 Summary File 1) to construct measures of neighborhood-level exposure to black and Hispanic neighbors, and thereby of city-level residential segregation.18 We also use Summary Files computed from 2000 Census
long-form data to estimate the average family background characteristics of black and white
16 These regressions are fit by race, and include unrestricted high school dummies and 114 background
dummies, formed from the 14 income categories reported in the SAT and the full interaction of the 10 categories for each parent’s education. The income and education categories include “missing” as one possibility.
17 When we analyze outcomes that are only available for public schools or for which we cannot readily
distinguish different grades (e.g. teacher-student ratios), we use point-in-time school segregation measures computed over the relevant schools and grade levels.
18 Census tracts are initially defined to encompass demographically homogenous neighborhoods of about 4,000
residents, but once drawn generally have stable boundaries. Exposure measures based on Census Block Groups (typically about 1000 residents) are nearly perfectly correlated across cities with the tract-based measures and lead to virtually identical estimates.
students in each city, supplementing this with information from the public use samples (PUMS) for characteristics (e.g. parental education and residual parental wages) that are not tabulated elsewhere. We also use the PUMS data to construct a measure of the black-white gap in degree attainment that that is free from any test participation biases. Further details on our data sources and merging methods are presented in a Data Appendix, available on request.
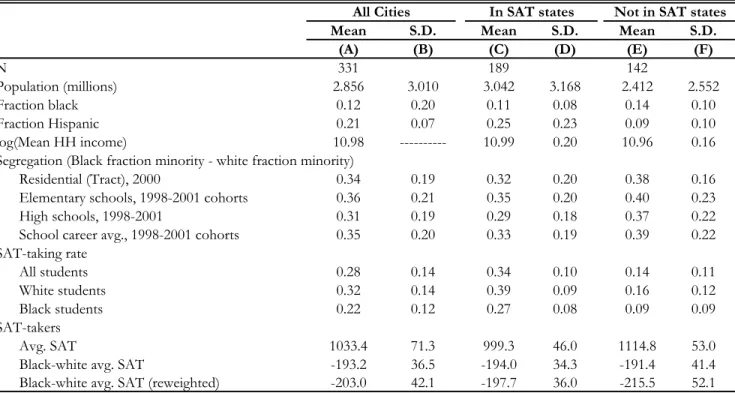
Table 1 gives an overview of the patterns of segregation and test scores for a
selection of cities with different patterns of residential and school segregation. The first two columns show the fraction black and Hispanic in the metropolitan area.19 Columns C-E
show the mean exposure of black and white students in each city to minority (black and Hispanic) schoolmates, while the final columns show parallel measures of tract-level exposure to minority neighbors.
The first two panels of the table present data for cities with the lowest and highest levels of school segregation, among the subset of all MSA’s in SAT states with at least 5% black population shares. The five lowest segregation cities are all in the South: in these cities, the typical black-white gap in exposure to minority schoolmates (ΔBc) is about 6%. In three of the cities the gap in exposure to minority neighbors (ΔRc) is comparable, but in two
cities (Wilmington, North Carolina and Gainesville, Florida) neighborhoods are substantially more segregated. Among the 5 most-segregated cities, 4 are in the mid-Atlantic region: all have highly segregated neighborhoods as well as schools.20
We can only identify separate effects of school and neighborhood segregation to the extent that the two vary independently. The two bottom panels of Table 1 present data for
19 We treat Hispanics as a distinct racial category, excluding them from both the white and black groups. In
2000 Census data, where possible we include multi-race non-Hispanics as blacks if they report black as one of their races; we never count multi-race individuals as white.
20 Some of the most highly segregated cities in the U.S., like Detroit and Chicago, are in states where a majority
the cities with the biggest divergence between the two measures, first for cities with relatively integrated schools and then for cities with relatively segregated schools.21 The degree of
neighborhood segregation is similar in the two groups of cities but the extent of school segregation is much smaller in the first group (mean exposure gap=13%) than in the second (mean exposure gap=49%). Although residential and school segregation are highly
correlated, there is clearly substantial independent variation in the two factors.
Table 2 presents some comparisons between the students in all 331 MSA’s in the country (columns A-B), those in the 189 cities from SAT states that are included in our analysis sample (columns C-D), and those in the 142 cities that are excluded from our test score samples (columns E-F). On average 43 percent of white high school students and 31 percent of black high school students from cities in the SAT states write the SAT. Blacks are slightly under-represented in the SAT state cities whereas Hispanics are
over-represented.22 Cities from SAT states also have slightly less segregated neighborhoods and
schools than cities in other states.
The bottom two rows in Table 2 show average SAT scores for the different city groups and the mean test gap between whites and blacks. Average SAT scores are lower in high-participation states (Dynarski, 1987; Rothstein, forthcoming), but the black-white difference is very similar for cities in SAT and non-SAT states, suggesting that use of within-city differences reduces problems associated with selective test participation.
As a final descriptive exercise, Figures 1-3 show the correlations across cities between the black-white adjusted test score gap and the relative segregation of
neighborhoods (Figure 1), the relative segregation of schools (Figure 2), and the part of the
21 We define the degree of divergence as the residual from a regression of school segregation (ΔBc) on
neighborhood segregation (ΔRc).
22 California, Texas, and Florida are all SAT states. In Table 2 (and in the remainder of our analysis), cities are
weighted by (1/Nbc + 1/Nwc)-1 where Nbc and Nwc are the numbers of blacks and whites in the city population.
relative segregation of schools that is orthogonal to the relative segregation of
neighborhoods (Figure 3). There is a strong negative relationship in the first two graphs between each racial segregation measure and the relative test scores of black students. 23 The
relationship is weaker when we focus on the component of school segregation that is orthogonal to neighborhood segregation, and seems to be driven more heavily by a few outliers. As we document below, this relationship disappears entirely as we add control variables, though the relationship between residential segregation and black relative test scores remains strong.
IV. Regression Models for Black-White Gaps in Participation and Scores
a. Basic Models
Table 3 presents an initial set of estimates of the model given by equation (6). The upper panel summarizes models for the black-white gap in adjusted SAT scores, while the lower panel shows a parallel set of models that have the gap in SAT participation as the dependent variable. All the models include main effects for the overall fraction black and Hispanic in the city’s schools, dummies for 5 census divisions, and (in the upper panel only) the black-white gap in a Mill’s ratio formed from the race-specific SAT participation rates in the city.24 We present three sets of specifications: models with only school segregation in
columns A-C; models with only neighborhood segregation in columns D-F; and models with both segregation variables in columns G-I.
The most parsimonious models, in columns A and D, show strong negative effects
23 The SAT-state MSA with the most segregated schools is Gary, Indiana. Newark, New Jersey is second.
Graphs using the black-white gaps in unadjusted scores look very similar to Figures 1-3.
24 Although there are nine Census divisions, only six are represented among SAT states. In Table 3 and the
remainder of the paper, we exclude cities (4 of 189 in SAT states) for which we cannot construct black-white differences in family background characteristics, introduced in Column C, using the 2000 Census microdata sample.
of racial segregation (measured across schools or neighborhoods) on average SAT scores and on SAT participation. The -125 coefficient in the model for SAT scores in column A, for example, implies that moving from complete segregation to complete integration would raise black relative SAT scores by 125 points, or about 60 percent of the overall black-white gap.25 The -0.13 coefficient in the corresponding model for SAT participation suggests that
a shift from complete segregation to full integration would raise the city-wide relative black participation rate by 13 percentage points.
The models in columns B and E add controls for a vector of MSA characteristics (the log of population, the log of land area, the fractions of residents with 13-15 and 16+ years of education, log mean household income, and the Gini coefficient of household income) and for black-white gaps in observed characteristics (parental education and family income) among SAT-takers in the MSA.26 These additions reduce the size of the estimated
segregation effect on test scores, but raise the size of the effect on participation. Finally, the most general specifications in columns C and F add controls for the black-white differences in several additional family characteristics (parental education, family income, child poverty, single-parenthood, and maternal employment), measured from 2000 Census data. These models also include controls for the mean difference in residual wages between black and white parents, computed separately for men and women. The motivation for including these wage gap measures is discussed in Section IV. In these specifications the effects of segregation on SAT scores are reduced somewhat, but remain statistically significant. The effects on SAT participation are also reduced and are no longer significant.
25 The standard deviation of combined SAT scores is about 200, so the black-white gap is approximately one
standard deviation, similar (in effect size) to the gap measured in the NAEP at ages 9, 13, or 17 (Perie, Morand, and Lutkus, 2005).
26 For the analysis of SAT participation we do not control for the relative characteristics of SAT takers, since
The models in columns G-I of Table 3 include both segregation measures simultaneously. In the sparsest specification (G), school segregation appears to have the larger effect. When we add controls for metropolitan and SAT-taker characteristics,
however, the school segregation coefficient falls to near zero and the residential segregation coefficient becomes large and negative. The sum of the two coefficients is quite close to the residential segregation effect in the corresponding models in Columns D-F. We can reject that the neighborhood segregation effect is zero, but not (in column I) that the two forms of segregation have equal effects. Similar patterns are seen in the participation models:
Residential segregation appears to reduce relative black participation while school
segregation tends to increase it, and here we can reject equal effects. Overall, it seems that residential segregation matters, but controlling for this, differences in relative exposure to minority schoolmates have little effect on black relative achievement. Taking the coefficient on residential segregation in column F of Table 3 as a benchmark, the implied effect of moving from a highly segregated city (Gary Indiana, ΔRc=0.70) to a nearly unsegregated city (Fort Walton Beach Florida, ΔRc=0.06) is a 45 point closing in the black-white SAT gap (or
roughly a 0.22 “effect size”).27
We have estimated many alternative specifications to probe the robustness of this conclusion. Some of these alternative models are presented in Appendix Table 1. In one check, we include a dummy variable for cities from the three states with high fractions of Hispanic immigrants – California, Florida, and Texas. This has no effect on the pattern of results seen in Table 3. In a second check, we compared the effects of alternative school segregation measures. When only elementary school segregation for our cohort of test
27 The -70 coefficient implies a 70/200 =0.35 standard deviation effect of a one-unit decrease in minority share
in the neighborhood. This implies that the -7 percentage point treatment effect on minority exposure in the MTO experiment should have yielded a 0.025 standard deviation effect on test scores. The estimated treatment effect on math scores (Sanbonmatsu et et., 2006, Table 4, row 1, column 5) was 0.018 (s.e. 0.03).
takers is included, it has a coefficient of -19 (standard error 20) – very similar to the
coefficient estimate for the “lifetime” segregation average in column I of Table 3. When we try to include separate effects for elementary and school segregation their coefficients are of opposite signs (elementary segregation negative, high school segregation positive,
individually and jointly significant) but the sum is small and positive, while the effect of residential segregation remains large and negative.
Finally, we estimated models that allow the effects of minority exposure to differ for black and white students. Specifically, we allowed black students’ exposure to minority neighbors to have separate effects on black and white test scores, and similarly allowed white students’ exposure rates to affect both groups. Consistent with the “differenced” functional form used in Table 3, these models (reported in columns E-G of Appendix Table 1) indicate that black exposure to minority neighbors reduces black students’ test scores but has little effect on whites, while the reverse is true for white exposure to minorities.28 We cannot
reject the assumption that exposure to minority neighbors has a similar negative effect on both blacks and whites, and that neighborhood segregation therefore widens the black-white test score gap.
d. Selection into SAT-taking
A potential concern with the results so far is that we may not have fully controlled for selective SAT participation. To probe the robustness of our results, Columns H and I of Appendix Table 1 present estimates of our basic specifications that omit the Mill’s ratio control function and ignore the re-weighting adjustment for differential high school level participation within a given city. These simpler unadjusted models show a significant but
28 These models dispense with the unrestricted MSA fixed effect that is implicit in our differenced models. The
slightly smaller effect of residential segregation on relative test scores, but no effect of school segregation once the residential measure is included.29 The fact that the unadjusted models
show smaller effects is consistent with the predicted pattern of selectivity biases, under the assumption that higher scoring students are more likely to write the test in all cities. Arguably, any remaining selection problems in our adjusted models have a similar effect, implying that the results in Table 3 understate the true effects of segregation.
A second and perhaps more persuasive way to evaluate the impact of selective test participation is to examine models for black-white relative attainment based on outcomes for a random sample of youths. We used the 2000 Census 5-percent micro samples to estimate the fraction of 16-24 year olds in each city who either are currently enrolled in school or have completed high school.30 We then constructed the black-white gap in this outcome
and related it to our city control variables and the segregation measures.
The resulting estimates are presented in Table 4, using a sample of 234 MSA’s with at least 50 students of each race in the 5 percent Census samples. The specifications in columns A-E include only neighborhood segregation, while the models in columns F-J include both segregation measures. The specifications are similar to those in Table 3, with a few exceptions: the Mills ratio term is excluded; the SAT-taker background characteristics (introduced in columns B, E, and H of Table 3) are omitted; and the Census-based measures of black-white gaps in observable characteristics (introduced in columns C, F, and I of Table 3) are introduced in three stages, with just the parental education measures included in
29 We have also explored other types of selection corrections, including artificially trimming the data to retain
the same fraction of the high school population in each city. Our basic results of large negative effects of residential segregation and essentially zero effects of non-residential segregation have held up in every specification.
30 To insulate against bias from endogenous mobility of young people who have left their parents’ homes, we
assign individuals to the MSA where they lived in 1995, when they were aged 11-19. A limitation of the Census data is that there is no family background information for children who are no longer living with their parents. Consequently, we make no individual-level adjustments for family background.
Columns C and H of Table 4, the remaining measures except for wage differences added in Columns D and I, and the parental wage measures added in E and J.
The simplest models in columns A-C suggest that there is a significant negative effect of neighborhood segregation on black youths’ relative education outcomes. These findings are similar in spirit, though smaller in magnitude, to results reported by Cutler and Glaeser (1997), whose models include fewer controls.31 The corresponding models in
columns F-H suggest that once neighborhood segregation is taken into account, there is little or no additional effect of school segregation. Although imprecise, these estimates show the same pattern as our findings for test scores, suggesting that selective SAT participation is not the driving our main results.
Nevertheless, examination of the richest specifications in Table 4 (columns D-E and I-J suggests that inferences about the effects of segregation on educational attainment are sensitive to the set of background control variables. In particular, once the full set of relative background variables we use in Table 3 are added, the estimated impacts of school
segregation on its own, or of school and neighborhood segregation taken together, fall in magnitude and become insignificant. By contrast, the models in Table 3 show robust negative effects of relative exposure to minority neighbors on black-white relative test scores. One potential explanation for the difference is that neighborhood segregation has smaller effects on basic achievement outcomes (like completing high school) than on higher-level achievement outcomes (like college entry test scores). Unfortunately, however, the Census outcome models have limited power against reasonable effect sizes, so it is difficult
31 Cutler and Glaeser (1997) use a 1% sample of the 1990 Census, and relate black relative high school
graduation rates (and other outcomes) to a residential segregation measure. Their models only control for 4 city-wide variables: log population, the fraction of blacks in the city, log median income, and manufacturing share of employment. Their estimates imply that moving from complete segregation to complete integration would raise relative high school graduation rates of black 20-24 year olds by 30 percentage points. This is enormous: Even in highly segregated cities in their sample the black graduation rate is 74%.
to reach definitive conclusions.
V. Confounding Influences
Our reading of the results in Tables 3 and 4 is that there is a relatively strong relationship between segregation and the black-white achievement gap, and that this relationship cannot be attributed to selective test participation. More tentatively, the link appears to run through neighborhoods rather than schools. In this section we address two key questions: (1) Is the effect of neighborhood segregation on relative achievement overstated because of omitted variables biases? (2) Is the effect of school segregation on relative achievement understated?
a. Is the Effect of Neighborhood Segregation Overstated?
The most obvious source of concern with the results in Table 3 is that there are unobserved differences in the latent abilities of black and white students in different cities that are correlated with the degree of segregation in the city. Although the test score gap is computed from “residual” test scores that control very flexibly for the observed parental education of SAT test takers, and our models control for black-white differences in parental characteristics of the SAT takers in each city as well as differences in family characteristics observed in the Census, it is still possible that unobserved ability gaps remain.
Recent work (e.g., Heckman and Carneiro, 2003; Cunha et. al, 2005) has shown that the academic achievement of children is strongly correlated with the cognitive ability of their parents, and that cognitive ability is a key determinant of earnings. This research suggests that a useful proxy for the unobserved ability of a child (conditional on parental education) is the unexplained component of his or her parent’s earnings. Building on this idea, we fit a
standard wage determination model separately by race and gender, and constructed estimates of the mean residual wage gaps between black and white mothers and fathers in each city.32
The models reported in the final columns of Tables 3 and 4 include these residual wage gaps as additional controls. Their inclusion has essentially no impact on the estimated segregation effects, suggesting that differences in the unobserved cognitive abilities of black and white parents in different cities are not biasing our main results.
Despite this, the potential for endogeneity bias merits further consideration. There are two reasons why unobserved differences in the family backgrounds of black and white children could be correlated with the degree of segregation in a city. One is that the degree of residential segregation varies endogenously with the characteristics of the local
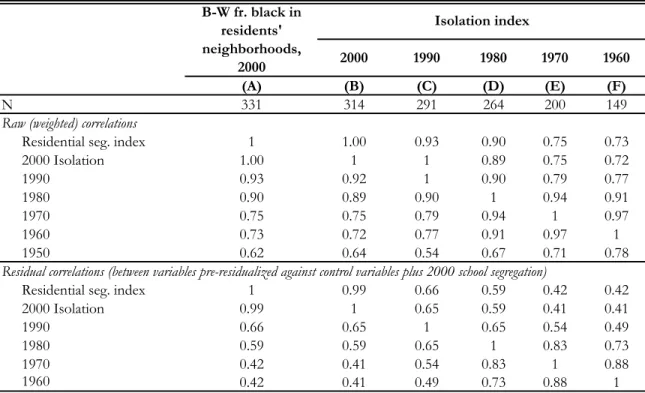
population. The other is that people selectively move to a city (or move out) in response to the patterns of segregation, yielding an endogenously selected population. We suspect that the first mechanism is less important than the second, as residential segregation patterns are highly stable over time. Table 5A, for example, presents cross-city correlations between various measures of residential segregation in 2000, 1990, 1980, 1970, and 1960. For 2000 we use two indexes of segregation: our own relative exposure index (ΔRc) and the so-called isolation index constructed by Glaeser and Vigdor (2001). For earlier years we show the correlations with isolation indexes constructed from Census tabulations by Cutler, Glaeser, and Vigdor (1999). Over any 20 year interval the correlation of residential segregation measures across cities is 0.8 or higher.33
32 Specifically, we used the 2000 Census 5% sample to identify adults with resident children age 18 or under.
For each person we constructed an hourly wage (based on earnings and hours last year), and then regressed wages on MSA fixed effects, years of education, indicators for high school dropout and college graduation, and a cubic in potential experience, separately by race and gender. The MSA fixed effect is the mean residual wage for the race/gender group in that city.
33 It is possible, of course, that segregation depends on the unobserved ability gap in the city at some point far
in the past. We expect that any correlation between current segregation and historical ability gaps is absorbed by our controls for observed characteristics of current students’ parents.
A more serious concern is the selective mobility of higher and lower ability black and white families across cities with differing levels of segregation. To quantify the potential impact of selective mobility, we examined changes in the distribution of high- and low-skill black and white families across cities over the 30 year period for which we could assemble appropriate data. We divided black and white adults in each census year, 1970 through 2000, into “high”, “medium” and “low” education groups, choosing the cutoffs to keep the shares of each group approximately constant over time. We then calculated the mean segregation index experienced by each race/education group in each year, using the 2000 value of residential segregation for their city of residence as the measure of segregation. (The choice of a fixed base year for the segregation measure means that changes over time are driven solely by changes in the distribution of the group across cities).
The left-hand panels in Figure 4 show the mean values of the segregation index for each education group in 1980, 1990, and 2000, with blacks in the top row, whites in the middle row, and the black-white difference in the bottom row. These figures show that both blacks and whites shifted steadily toward less segregated cities between 1970 and 2000. The shift was more prominent for high-education blacks, consistent with a pattern of
endogenous mobility that could lead to bias in our sparsest achievement models.
The second and third columns in Figure 4 show similar graphs for residual residential segregation, after controlling for census division and racial composition effects (second column) and the full set of control variables used in our main specifications (third column). Simply controlling for geographic region eliminates about half of the differential mobility of low- and high-skill blacks, and it is almost entirely eliminated by the addition of the
remaining control variables. To the extent that mobility differences by observed education are informative about the relationship with unobserved ability, these graphs suggest that
endogenous mobility might introduce bias in extremely sparse models but should not be a problem for our main estimates.
In sum, based on the observed mobility patterns of different education groups of whites versus blacks, the stability of residential segregation within cities over time, and the results from our investigation of residual wage gaps, we believe it is unlikely that the residential segregation effects in Table 3 are significantly biased by omitted ability factors.
b. Is the Effect of School Segregation Understated?
We turn now to the second question raised by the results in Table 3: Are the effects of school segregation understated? An obvious concern is measurement error. If school segregation is poorly measured, or highly variable over time, then the measures we have constructed may be unreliable, leading to attenuation biases. Attenuation would be particularly severe in models that include residential segregation, as the two are so highly correlated. To assess the reliability of school segregation, we constructed a number of independent measures for U.S. cities over a ten year period, and correlated them with our primary index. One limitation is that we have data on private schools only for 1997-98. The segregation measures for earlier years thus include only public schools.
The results are summarized in Table 5B. The first column and row pertain to our primary index, which includes public and private school students and is constructed to approximate the school career of our test cohorts. The second variable included is an analogous index computed only over public school students, which is nearly perfectly correlated across cities with our primary index. The remaining variables separate out public elementary and secondary-level segregation, for both 1988-1991 and 1998-2001. The raw correlations among variables are extremely high, never below 0.94.
The lower panel of Table 5B reports correlations for residuals from regressions of school segregation measures on our full vector of control variables (including residential segregation). The correlations remain quite high even for these residuals, at least 0.64 and mostly above 0.75. This compares favorably with the reliability of other commonly used constructs, and leads us to conclude that measurement error attenuation is not a serious concern with our school segregation measures.
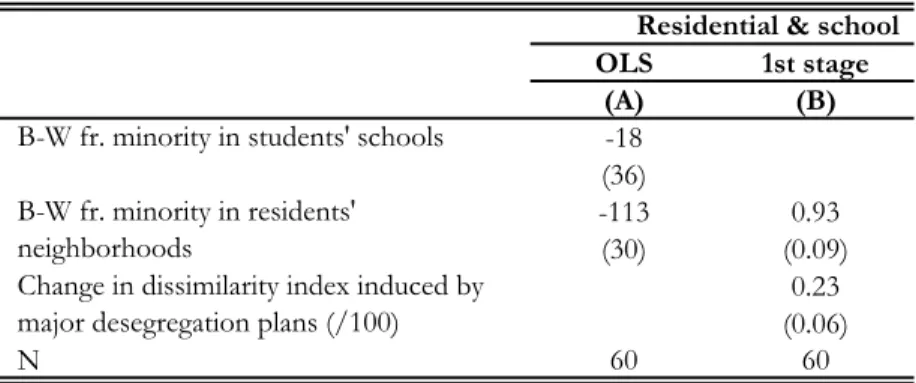
Nevertheless, as a final check, we present an instrumental variables analysis that isolates the component of school segregation that is attributable to court-ordered school desegregation programs implemented in the 1970s and early 1980s in many U.S. cities. The instrument is based on Welch and Light’s (1987) estimate of the change in the “dissimilarity index”—an alternative index of racial segregation—for the schools in the main school district in an MSA, from the year prior to the city’s major desegregation plan to the last year of implementation of the order.34 Welch and Light (1987) only collected data for larger
school districts, which typically serve the central city of the MSA. We multiply the change in dissimilarity in this district by its share of metropolitan enrollment. Thus, the instrument reflects both the “bite” of the main desegregation plan and the size of the desegregated district relative to the overall MSA.
Table 6 presents the IV analysis. Given the small sample size for which the instrument is available, we adopt a parsimonious model similar to the one in column H of Table 3 (though with slightly less flexible controls for SAT-takers’ background
characteristics). OLS estimates in Column A are quite similar to those from our full sample, though less precise. Column B shows the first stage estimate: Even after two decades or
34 This variable is set to zero for MSAs containing districts in the Welch and Light sample without a major
desegregation plan. Our sample for the IV analyses thus consists of only 60 MSAs that are both in SAT states and in the Welch and Light sample.
more the court orders continue to have sizable effects on observed measures of school segregation. Finally, column C shows the IV estimate. This is relatively imprecise, but gives no indication that the OLS estimate is biased in such a way as to mask an underlying
negative effect of school segregation.
V. Within School Segregation?
One potential explanation for our finding that school segregation has little or no effect on relative achievement is that in cities with highly segregated neighborhoods, school integration efforts are offset by programs and behaviors that lead to within school segregation (Clotfelter, Ladd, and Vigdor, 2003; Clotfelter, 2004; Eyler, Cook, and Ward, 1983).35 As a
proxy for within-school exposure, we use data on course enrollment patterns from the SAT data set. SAT-takers are asked whether they have taken honors courses and whether they intend to claim advanced placement (AP) credit or course exemptions in college on the basis of high school work. Column A of Table 7 presents models for the fraction of students in a city who intend to claim college-level credit in any subject, while Columns B through D present models for the fraction of students who indicated that they had taken honors courses in math, English, or any subject, respectively.
In Panels A and B we present estimates of the relationships between the school and neighborhood segregation measures and the black and white means of the course-taking variables. The estimates in Panel A show no significant relationship between either school
35 Anecdotal evidence suggests that districts often create special programs to attract white students to
high-minority schools or, alternatively, to avoid truly desegregating their school systems in the face of judicial oversight. As an example of the latter, the federal district court judge’s opinion in People Who Care v. Rockford Board of Education, 851 F. Supp. 905 (1993) states: “The court finds that the ability grouping and tracking practices of the Rockford School District (hereinafter ‘RSD’) did not represent a trustworthy enactment of any academically acceptable theory or practice. The RSD tracking practices skewed enrollment in favor of whites and to the disadvantage of minority students. The court finds that it was the policy of the RSD to use tracking to intentionally segregate white students from minority students….” (p. 940)
or neighborhood segregation and black course-taking. The estimates in Panel B, by comparison, show relatively strong negative impacts of school segregation on honors and AP participation by whites, many of which are at the margin of significance. To interpret these impacts, note that a rise in our segregation index implies that whites are relatively less exposed to minorities. Thus, a negative coefficient means that white students are more likely to take honors and AP classes in cities with more integrated schools and neighborhoods. Finally, Panel C reports estimates for the black-white difference in honors participation at the city level. Increased school segregation is associated with large positive effects on the black-white gap in honors course taking and in AP participation. Increases in neighborhood segregation have negative effects, although the coefficients are mostly smaller and uniformly insignificant.
Though participation rates in honors and AP courses are limited measures of within-school exposure, the results in Table 7 support the hypothesis that across-within-school integration is associated with within-school segregation Holding constant neighborhood segregation, white students are more likely to participate in “high track” courses when schools are more integrated, presumably limiting the classroom-level exposure of blacks to whites.36 To the
extent that school peer effects operate through classroom-level exposure, then, our school segregation measure may have relatively little signal for the relevant peer group.
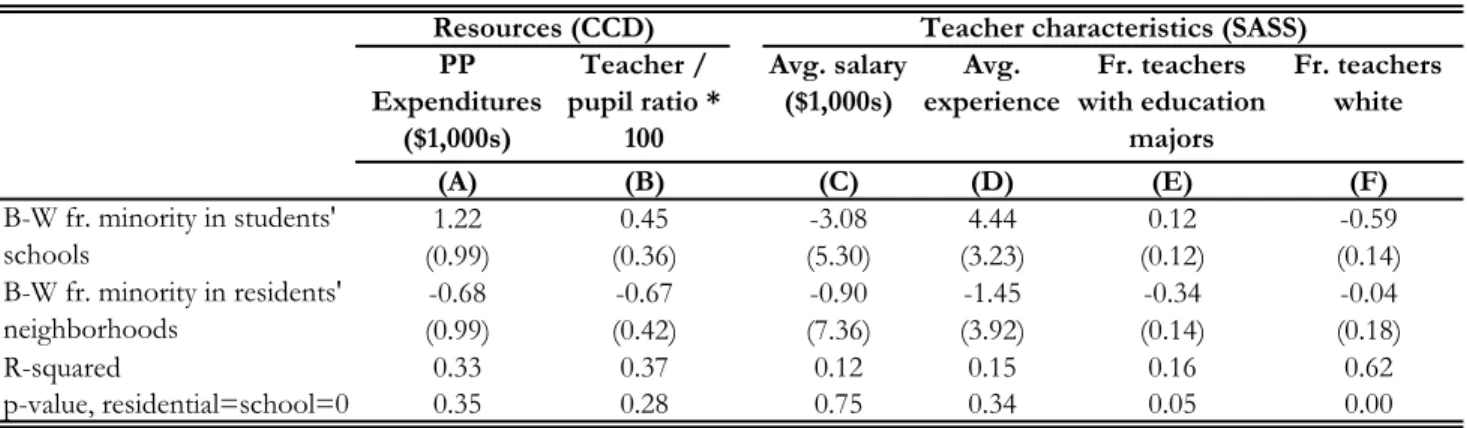
VI. Indirect Effects of School Quality and Peer Characteristics
All of our specifications so far have excluded any characteristics of the schools and neighborhoods of black and white students other than their minority composition. As noted
36 We have also estimated models for the tracking measures that separate out the components of school
segregation attributable to court-ordered desegregation. Standard errors are large, but the results indicate that, if anything, court-ordered desegregation has larger effects on tracking than does the residual component.