RUHR
ECONOMIC PAPERS
Gender Diff erences in the
Intergenerational Earnings Mobility
of Second-Generation Migrants
#283
Regina Flake
Imprint
Ruhr Economic Papers Published by
Ruhr-Universität Bochum (RUB), Department of Economics Universitätsstr. 150, 44801 Bochum, Germany
Technische Universität Dortmund, Department of Economic and Social Sciences Vogelpothsweg 87, 44227 Dortmund, Germany
Universität Duisburg-Essen, Department of Economics Universitätsstr. 12, 45117 Essen, Germany
Rheinisch-Westfälisches Institut für Wirtschaftsforschung (RWI) Hohenzollernstr. 1-3, 45128 Essen, Germany
Editors
Prof. Dr. Thomas K. Bauer
RUB, Department of Economics, Empirical Economics Phone: +49 (0) 234/3 22 83 41, e-mail: [email protected] Prof. Dr. Wolfgang Leininger
Technische Universität Dortmund, Department of Economic and Social Sciences Economics – Microeconomics
Phone: +49 (0) 231/7 55-3297, email: [email protected] Prof. Dr. Volker Clausen
University of Duisburg-Essen, Department of Economics International Economics
Phone: +49 (0) 201/1 83 -3655, e-mail: [email protected] Prof. Dr. Christoph M. Schmidt
RWI, Phone: +49 (0) 201/81 49 -227, e-mail: [email protected] Editorial Offi ce
Joachim Schmidt
RWI, Phone: +49 (0) 201/81 49 -292, e-mail: [email protected] Ruhr Economic Papers #283
Responsible Editor: Thomas K. Bauer
All rights reserved. Bochum, Dortmund, Duisburg, Essen, Germany, 2011 ISSN 1864-4872 (online) – ISBN 978-3-86788-329-0
The working papers published in the Series constitute work in progress circulated to stimulate discussion and critical comments. Views expressed represent exclusively the authors’ own opinions and do not necessarily refl ect those of the editors.
Ruhr Economic Papers #283
Regina Flake
Gender Diff erences in the
Intergenerational Earnings Mobility
Bibliografi sche Informationen
der Deutschen Nationalbibliothek
Die Deutsche Bibliothek verzeichnet diese Publikation in der deutschen National-bibliografi e; detaillierte National-bibliografi sche Daten sind im Internet über:
http://dnb.d-nb.de abrufb ar.
ISSN 1864-4872 (online) ISBN 978-3-86788-329-0
Regina Flake
1Gender Diff erences in the
Intergenerational Earnings Mobility of
Second-Generation Migrants
Abstract
This study analyzes gender diff erences in the intergenerational earnings mobility of second-generation migrants in Germany. The analysis takes into account potential infl uences like assortative mating in the form of ethnic marriages and the parental integration measured by parents’ years since migration. First, intergenerational earnings elasticities are estimated at the mean and along the earnings distribution. The results do not reveal large diff erences in the intergenerational mobility – neither between natives and migrants nor between men and women. Second, intergenerational changes in the relative earnings position are analyzed. The results show that migrants are less likely than natives to worsen their relative earnings position while they have the same probability as natives to improve their earnings position. In summary, migrants are mostly as (im)mobile as the native population.
JEL Classifi cation: F22, J12, J30, J62
Keywords: International migration; second-generation migrants; intergenerational mobility; marriage
September 2011
1 Ruhr Graduate School in Economics. – I would like to thank participants of the fi rst RGS Jamboree 2010, the RWI Brown Bag Seminar, the 4th RGS Doctoral Conference, the SOEP Young Scholar Symposium, the Norface/CReAM Migration Conference, the Annual Conference of the ESPE and Annual Meeting of the Verein für Socialpolitik for helpful comments and suggestions. Furthermore I thank the Ruhr Graduate School of Economics and the German Israeli Foundation for Scientifi c Research and Development for fi nancial support. – All correspondence to Regina Flake, Ruhr Graduate School in Economics, Hohenzollernstr. 1-3, 45128 Essen, Germany. E-Mail: regina.fl [email protected].
1
Introduction
The intergenerational transmission of economic status has been in the focus of re-search for a long time. Economic mobility or persistence provides important insights into the equality of opportunities within a society. In particular, the discussion about the rising income inequality in many countries fuels the discussion about in how far the current income distribution is fostered by inheritance of the social status from parents to children.
In Germany, second-generation migrants, i.e. the children of migrants who are born and raised in Germany, make up a large and growing share of the population. In 2009, 19.6% (16 million) of the German population had a migration background of which almost one third was German-born (Statistisches Bundesamt, 2010). But while traditional immigration countries like the US, Canada or Australia register a successful integration of second-generation migrants, they lack behind in terms of education and labor market outcomes in Germany (Fertig and Schmidt, 2002; Riphahn, 2003; Algan et al., 2010). The analysis of the degree of intergenerational earnings mobility can provide important insights into whether second-generation migrants are able to overcome the disadvantages faced by first-generation migrants or whether a high degree of persistence is one reason for the divergence in the economic outcomes of the offspring of natives and migrants.
The factors which may lead to differences in intergenerational earnings trans-mission between natives and migrants within a country are manifold and imply accordingly different policy implications. Parents differ in observed and unobserved characteristics and a priori it is unclear whether migrants are more or less mobile than natives. On the one hand, first-generation migrants may put a larger emphasis on their children’s education than natives as the migration decision may have already been driven by expectations and hopes about their children’s future possibilities in the host country. In this case, migrants are likely to be more mobile than natives. On the other hand, a lack of familiarity of migrants with the educational system and/or a lack of connections and access to important networks may reduce migrants’
earnings mobility if compared to natives. Furthermore, the influence of the family might be stronger among migrants than among natives as natives have more access to and therefore are more influenced by the society outside the family (Hammarstedt and Palme, 2006).
When analyzing the intergenerational earnings mobility of second-generation mi-grant men and women jointly, it has to be taken into account that transmission mechanisms do not only differ between natives and migrants but as well between men and women. Reasons for such differences lie for example in assortative mating and subsequent labor supply decisions of women (Raaum et al., 2007, p.12).
Finally, there is evidence that the gender gap in intergenerational mobility itself differs between natives and migrants (Chen et al., 2007). The cultural background can influence family formation behavior, child care arrangements and labor market participation. This may be reflected among other aspects in different shares of en-dogamous marriages of second-generation migrant men and women, i.e. marriages to persons with the same ethnic background. Furthermore, differences in the gender gap could be due to different degrees of aversion to earnings inequality of native and migrant parents, which influence the initial investment in education (Bauer and Gang, 2001).
The aim of this study is to analyze the intergenerational earnings mobility of second-generation migrant men and women in Germany and compare their degree of mobility to the native population. For this purpose, two approaches are used. First, intergenerational earnings elasticities are estimated. This is done at the mean as well as along the earnings distribution by using OLS and quantile regression methods. Second, the relative earnings mobility is analyzed. Thereby, mobility is measured as intergenerational changes in the relative earnings positions.
2
Literature
There are different mechanisms which relate parents’ and the children’s earnings. Intergenerational earnings persistence can be explained by the so calledmechanical
transmission, i.e. the transmission of genetics, behavior, cultural traits, and environ-mental factors like e.g. family reputation or connections. A large literature focuses on the influence of the parents’investment in human capitalon the earnings mobility (Becker and Tomes, 1979; Chadwick and Solon, 2002). Parents with higher earnings are better able to finance and support their children’s education. As a consequence of these two mechanisms, higher earning parents are more likely to have children with higher earnings themselves as a certain “endowment”, which contributed to high earnings of parents in the first place, is transferred to the children.
In addition, intergenerational earnings transmission may be affected by assorta-tive mating, i.e., the tendency of two people with similar characteristics like educa-tion, health or occupation to marry. In terms of family earnings, a strong degree of assortative mating can foster a society’s earnings distribution and lower mobility.1 An additional factor which may increase the influence of assortative mating among migrants is the ethnic background. Besides searching for similarities in socioeconomic factors, migrants may prefer a partner with the same ethnic background. This can have a significant impact on the economic integration of migrants. Meng (2005), for example, shows that intermarried migrants earn higher incomes than their endog-amously married counterparts. Furtado and Theodoropoulos (2010) find evidence that in particular better educated migrants are more likely to intermarry.
However, there is mixed evidence about whether endogamous marriages are more present and important among male or female migrants. In the U.S., Chiswick and Houseworth (2008) find female migrants to be less likely to marry a native partner than their male counterparts. This could be explained by cultural norms which tie daughters relatively more to their family home. Parents may impose stricter dating rules on daughters or the migrant women themselves might have a preference for endogamy in the child raising process. In contrast, Chen et al. (2007) find women in general to be more mobile in terms of marriage and earnings than men and this gender gap is even more pronounced for migrants.
For a long time the research on intergenerational earnings mobility has focused
1As educational institutions are important meeting places for potential spouses, the early
on the relationship between fathers and their sons. The growing literature on the intergenerational transmission of the income status for daughters predominantly finds weaker intergenerational relations between daughters and their parents than between sons and their parents. But while the intergenerational elasticities of individual labor earnings are still found to be substantial in US, no significant correlation between parents’ and daughters’ earnings is found for Germany (Couch and Dunn, 1997; Chadwick and Solon, 2002).
Making a cross-country comparison, Raaum et al. (2007) reveal a higher degree of mobility of women in Denmark, Finland and Norway than in the UK and the US. Furthermore, the authors find lower earnings persistence at the bottom of the parental earnings distribution in the Nordic countries which increases sharply to-wards the top of the income distribution. Ermisch et al. (2006) provide evidence for the strong relationship between assortative mating and the intergenerational trans-mission of earnings in Germany. The authors find that 40-50% of the covariance between parents’ and children’s family income can be attributed to the spouse.
Aydemir et al. (2009) compare the intergenerational earnings elasticities of na-tives and migrants in Canada. The authors find no significant differences in the intergenerational income elasticities among migrants and the Canadian population. Furthermore, they do not find a significant relationship between fathers’ and daugh-ters’ earnings, neither. Other studies for Germany and Sweden find that immi-grants are less mobile than their native counterparts (Yuksel, 2009; Hammarstedt and Palme, 2006).
The study at hand takes up two current developments in the literate – expanding the analysis of intergenerational earnings mobility to women and migrants at the same time – and analyzes one potential source of the relatively poor labor market outcomes of second-generation migrants in Germany.
3
Empirical Strategy
The key issue in the analysis of intergenerational earnings mobility is to find an appropriate earnings measure. The most desirable measure are lifetime earnings of parents and their children. However, as lifetime earnings are rarely observable - in particular lifetime earnings of parents and children at the same time - they are often proxied by annual earnings.
While in the textbook error-in-variables framework errors in the measurement of the dependent variable (children’s earnings) lead simply to more noise, errors in the right-hand-side variable (parents’ earnings) lead to an attenuation bias in OLS estimates. Therefore, many empirical studies use averages of parents’ earnings to reduce the attenuation bias (Zimmermann, 1992; Black and Devereux, 2010).
However, if the relation between current income and lifetime income varies sys-tematically over the life cycle, the assumptions of the textbook errors-in-variables model do no longer hold (Haider and Solon, 2006; Böhlmark and Lindquist, 2006; Brenner, 2010). In this case, measurement errors in the independent as well as in the dependent variable can lead to inconsistency of the estimates. Furthermore, it is no longer clear whether measurement errors induce an amplification or an atten-uation bias. For this reason, some studies advice likewise against taking single year observations of children’s earnings like it has been done in most previous research (Yuksel, 2009; Nybohm and Stuhler, 2011).
Due to life cycle variations in income, the age at which earnings of children and parents are observed is an important factor in estimating intergenerational earnings mobility. Earnings at some ages are better suitable as proxies for lifetime earnings than earnings at other ages. Persons with high lifetime earnings tend to enter the labor market later but exhibit faster earnings growth. Thus, considering earnings at an early stage of the career may lead to an underestimation of lifetime earnings whereas taking earnings at a very late stage may overestimate lifetime earnings.
Furthermore, Brenner (2010) shows that lifetime earnings profiles differ between natives and migrants. One explanation for this heterogeneity in earnings growth
rates is that migrants undergo an assimilation process during which they acquire country specific human capital and which leads to higher earnings growth rates if compared to natives. Brenner shows that the attenuation bias over the life cycle is significantly larger among migrants than among natives. This could lead to the spurious conclusion that mobility is relatively larger among migrants. Even though Brenner confirms that taking averages of earnings contributes to reducing the atten-uation bias, he warns that point estimates still need to be interpreted cautiously.
To reduce a potential bias in the estimation of the intergenerational earnings mobility, some adjustments are made. First, the sample of children is restricted to 25- to 45-year-olds. In this age, most persons – independent of their educational level – have entered the labor market. The parents’ age is restricted to 30 to 65 years. Second, the analysis is based on averages of earnings only. The earnings information of the children is based on the years 1990 to 2009, whereas earnings information for the fathers is based on all currently available years from 1984 to 2009. The reason for the time restriction is that second-generation migrants are on average very young and therefore the number of earnings observations of second-generation migrants before 1990 is very low.2 Finally, it has to be taken into account that the individual averages of earnings are based on annual information from different years. Thus, even though earnings are inflation-adjusted, this does not control for changes of the overall earnings levels over the years.3 Therefore, annual earnings are weighted before taking averages. The average earnings𝑦of person𝑖are calculated according to the following formula:
𝑦𝑔𝑖 = ∑2009 𝑡=𝑡𝑔 ( 𝑦𝑔 𝑖𝑡⋅( 𝑦 𝑔 𝑡 𝑦𝑔 2009) −1) ∑2009 𝑡=𝑡𝑔(𝑑𝑖𝑡) , (1)
where 𝑦𝑖𝑡𝑔 are the earnings of person 𝑖in generation 𝑔 (children,parents) in year𝑡,
2This is due to the migration history of Germany. As peaks of migration were during the phase
of recruitment of so-called “guest workers” in the 1950s to 1970s followed by waves of migration due to family reunification, the children of first-generation migrants are still relatively young (Bauer et al., 2005).
3All earnings measures are inflation-adjusted by multiplying with the consumer price index by
𝑦𝑔
𝑡 are the average earnings of all persons in generation𝑔 in year 𝑡, 𝑑𝑖𝑡 a dummy variable indicating whether the earnings of person 𝑖are observed in the respective year and𝑡𝑔equals the year 1990 for children and 1984 for parents. To further reduce a potential bias, the sample is restricted to persons for whose fathers there are at least five earnings observations (∑2009𝑡=1984(𝑑𝑖𝑡)≥5).
In the first part of this study, the intergenerational earnings elasticities are esti-mated. The elasticities describe in how far the earnings of the children are determined by the earnings of the parents. Therefore, high elasticities imply a low degree of in-tergenerational mobility. Age is included in the model to control for potential life cycle variations in earnings of the four population groups (native men, native women, migrant men and migrant women). The age is the average age of children and par-ents when the earnings are observed. As in most families in the parental generation the father is the main earner, the average age of the father is taken representatively for the parental age.
To find out whether the intergenerational earnings elasticities are significantly different between the population groups, a fully interacted model is estimated.
The baseline model is
ln𝑦𝑖ℎ = 𝛽0+𝛽1ln𝑦𝑝𝑖ℎ+𝛽2𝑎𝑔𝑒𝑖+𝛽3(𝑎𝑔𝑒𝑖)2+𝛽4𝑎𝑔𝑒𝑝𝑖ℎ+𝛽5(𝑎𝑔𝑒𝑝𝑖ℎ)2 (2) +𝛽6𝐷𝑓+𝛽7𝐷𝑓∗ln𝑦𝑝𝑖ℎ+𝛽8𝐷𝑓∗𝑎𝑔𝑒𝑖+𝛽9𝐷𝑓∗(𝑎𝑔𝑒𝑖)2 +𝛽10𝐷𝑚+𝛽11𝐷𝑚∗ln𝑦𝑝𝑖ℎ+𝛽12𝐷𝑚∗𝑎𝑔𝑒𝑖+𝛽13𝐷𝑚∗(𝑎𝑔𝑒𝑖)2 +𝛽14𝐷𝑚∗𝑎𝑔𝑒𝑝𝑖ℎ+𝛽15𝐷𝑚∗(𝑎𝑔𝑒𝑝𝑖ℎ)2 +𝛽16𝐷𝑓𝐷𝑚+𝛽17𝐷𝑓𝐷𝑚∗ln𝑦𝑝𝑖ℎ+ +𝛽18𝐷𝑓𝐷𝑚∗𝑎𝑔𝑒𝑖+𝛽19𝐷𝑓𝐷𝑚∗(𝑎𝑔𝑒𝑖)2 +𝑒𝑖ℎ,
where𝑦𝑖ℎ are the average weighted earnings of individual𝑖in familyℎ,𝑦𝑝𝑖ℎare the average earnings of the parents𝑝of person𝑖,𝑎𝑔𝑒𝑝𝑖ℎis the average age of the father, 𝐷𝑓 is a female dummy and𝐷𝑚a migrant dummy. The standard errors are clustered on the family level because the sample includes families with more than one child and it is not likely that the residuals are independent across siblings.
As the degree of integration of the migrant population may influence the earnings mobility, the analysis is expanded by including different indicators of integration like endogamous marriages and the parents’ years since migration.
The intergenerational earnings elasticities are estimated by OLS and by quantile regression estimation methods. The latter provides insights into variations of the degree of mobility along the earnings distribution of the children. As the German migration history is largely determined by the recruitment of low-skilled workers, a large share of first-generation migrants can be found at the lower end of the earnings distribution. Therefore, it is of particular interest whether the offspring of this important group of migrants is able to overcome their initial disadvantage.
However, as quantile regression results only provide information about changes at the earnings quantiles but not about changes within the quantiles, the second part of this study is concerned with intergenerational changes of the relative earnings positions. For this purpose, earnings quantiles are determined separately for parents and children as well as for sons and daughters. Furthermore, the children are grouped into 25- to 30-year-olds, 30- to 40-year-olds and 40- to 45-year-olds and the parents into 30- to 40-year-olds, 40- to 50-year-olds and 50- to 65-year-olds. Then the relative earnings positions within the earnings quantiles are compared between parents and children.
4
Data
The analysis is based on individual-level data from the German Socio-Economic Panel (SOEP).4 The SOEP is a longitudinal study of private households which started in 1984 and which samples more than 20,000 persons each year, includ-ing Germans, foreigners and recent immigrants. The data structure allows a direct linkage between children and their parents.
4The data used in this paper were extracted using the Add-On package PanelWhiz v3.0 (Nov
2010) for Stata. PanelWhiz was written by Dr. John P. Haisken-DeNew ([email protected]). The PanelWhiz generated DO file to retrieve the SOEP data used here and any Panelwhiz Plugins are available upon request. Any data or computational errors in this paper are my own. Haisken-DeNew and Hahn (2006) describe PanelWhiz in detail.
The sample includes German natives, first- and second-generation migrants. A second-generation migrant is defined either as a person who is born in Germany but who does not hold German citizenship or as a migrant who arrived before the age of 6.5 In addition, this group comprises persons who are born in Germany, hold German citizenship and whose parents are both immigrants. The sample is restricted to persons living in West Germany and Berlin as very few migrants live in East Germany.
The earnings measure used in the analysis is the annual household labor income.6 To obtain the equivalent household labor income, the overall household labor income is divided by modified OECD equivalence weights.7 Children who live in the same household as their parents and therefore report the same household labor income are excluded.
The household labor income has several advantages as earnings measure for the analysis. First, persons with zero individual labor income can be included in the analysis. Furthermore, unlike most other studies, the analysis is not exclusively focused on the relationship between children’s and their fathers’ earnings as the par-ents’ household income comprises as well mothers’ earnings. The main disadvantage of this measure is that it cannot be differentiated in how far the intergenerational mobility is influenced by direct earnings transmission from parents to children and in how far it is influenced by the choice of the partner and/or the household compo-sition.
Table 1 presents descriptive statistics separately for native sons and daughters and migrant sons and daughters. The full sample comprises 1,829 persons. The children are on average 29 to 30 years old and the fathers 51 to 53. The share of married persons is higher among the migrants. While 40% (32%) of native women
5This is a common proceeding as young immigrants have the same educational background than
their native counterparts.
6Even though individual earnings like the hourly wages would be desirable, this measure is not
applicable in the present context. As wages are only observable for employed persons, this would lead to a reduction of the sample to 82 (36) observations for (married) second-generation migrant women.
7The OECD equivalence weight assigns a value of 1 to the household head, a values of 0.5 to
(men) are married, the respective share of migrants is 59% (47%). Within the group of married migrants, the share of second-generation migrants who are married to a partner with the same ethnic background is comparable between sons and daughters (34% and 36%). The average equivalent household labor income varies between 19,313e for migrant women and 25,170efor native men. There are three striking features with respect to the income. First, men report higher incomes than women.8 Second, natives have in general higher incomes than migrants. And third, while all four population groups report higher incomes than their parents, this gap is more pronounced among migrants. Finally, the table reveals that the children’s average incomes are on average based on 6 to 8 income observations. The respective numbers for parents are 12 to 13.
Table 2 presents the shares of persons in different conditional income quantiles. It is noticeable that migrants – children as well as parents – are more present in the lower earnings deciles than natives. Above the median, the share of migrants never equals or exceeds the share of natives.
5
Results
5.1 Intergenerational Earnings Elasticities
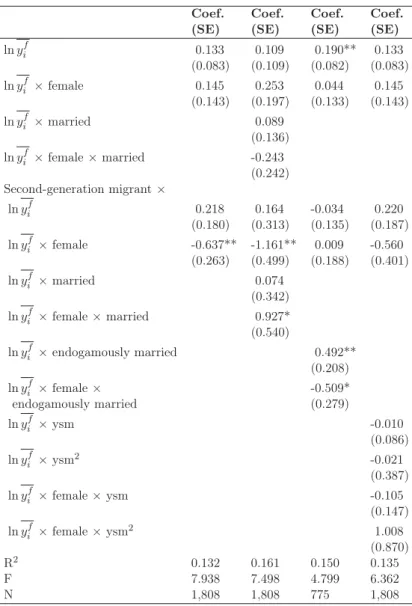
Table 3 presents the results for the estimated intergenerational income elasticities. The estimated coefficient of the parents’ income accounts for 0.133. This is the intergenerational income elasticity of native men. While both the coefficients of the interaction of a female dummy with the parental income (0.145) as well as the interaction of a migrant dummy with the parental income (0.218) are positive, the coefficient of the triple interaction between a female dummy, a migrant dummy and the parental income is negative (-0.637). However, apart from the coefficient of the triple interaction, none of the coefficients is significantly different from zero. Thus, there are no significant differences in the earnings mobility of native men and
8Looking at married persons, men and women should report the same household incomes on
average. Studies however found a gender bias in the way household income is reported (Chen et al., 2007).
women and migrant men. Migrant women have a significantly lower intergenerational earnings elasticity and are therefore the most mobile group.9
The magnitude and the relation of the coefficients are comparable to previous findings in the literature. One of the few studies analyzing intergenerational earnings mobility as well in terms of family income instead of individual income is the study by Ermisch et al. (2006). The authors find intergenerational earnings elasticities of 0.178 for men and of 0.209 for women. In a comparison of natives and migrants, Yuksel (2009) finds intergenerational earnings elasticities between 0.19 and 0.26 for native men and between 0.37 and 0.40 for migrant men. Also the negative coefficient for second-generation migrant women is in line with previous studies which have found negative earnings elasticities for daughters (Couch and Dunn, 1997; Yuksel, 2009).
The second column in Table 3 presents the results including a marriage dummy. While marriage has no significant impact on the earnings mobility of natives and generation migrant men, marriage decreases the earnings mobility of second-generation migrant women. This indicates that the high degree of mobility among migrant women is driven by single migrant women.
To test the initial assumption that in particular ethnic marriages may influence the earnings mobility, the model specification in the third column focuses on married persons only and includes a control variable for ethnic marriages. The coefficient of the parental income is positive and has turned significant at the 5%-level (0.190). On average, the earnings elasticities do not differ between the four population groups. Second-generation migrant men who are endogamously married have, however, a significantly higher earnings elasticity than natives and than migrant men who are in mixed marriages. The ethnic background of the spouse has no influence the earnings mobility of second-generation migrant women. Thus, against the initial assumption that migrant women might be more tied to their family (earnings) by ethnic marriages than migrant men, the contrary seems to be true.
Finally, the influence of the parental integration on the earnings mobility is
an-9This result is confirmed by pairwise comparison of the intergenerational earnings elasticities
alyzed. Therefore, the fathers’ years since migration before birth of the child are taken as a proxy for the integration and are interacted with the parental income. This shall capture the effect that migrant parents’ preferences and attitudes may change over time. If for example the degree of aversion against earnings inequality between sons and daughters changes, this can have a significant impact on the in-tergenerational earnings mobility. The results in column 4 reveal, however, that the intergenerational earnings elasticities do not change with the parents’ duration of stay in Germany.
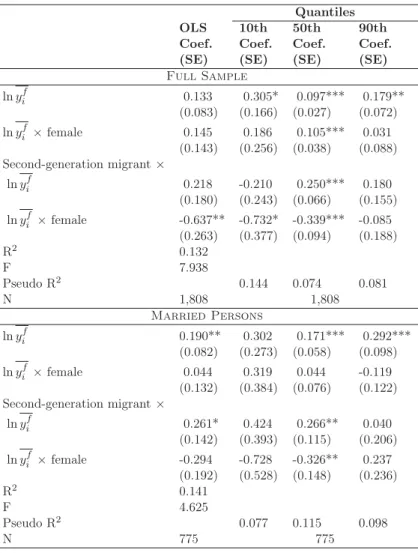
As it is of particular interest whether low-earnings migrants are able to overcome their initial disadvantage, the baseline model is reestimated using quantile regression methods. This is done for the full sample and separately for married persons only. Figure 1 displays the estimated intergenerational earnings elasticities for the four population groups along the earnings distribution of the children and Table 4 shows the respective estimated coefficients of an interacted model at the 10th, 50th and 90th quantile.
While there is an increasing trend in the intergenerational earnings elasticity among migrants in the overall sample, the reverse is true for the subsample of married persons. The latter is alarming as it signifies that migrants with relatively low earnings are less mobile than migrants with higher earnings. In particular for this group of migrants a certain degree of mobility is necessary to improve the own earnings situation. However, two things have to be taken into account. First, the sample size of married migrants is relatively small. Second, Table 4 shows that at the lowest 10th quantile of the earnings distribution the estimated earnings elasticities do not significantly differ between migrants and natives. Only at the median, second-generation migrant men have a significantly higher earnings elasticity than natives and migrant women. Thus, these results weaken concerns about a low degree of mobility at the lower end of the earnings distribution. In contrast, in particular second-generation migrant women reveal a relatively large degree of mobility.
But even though quantile regressions provide additional insights into the inter-generational earnings mobility, the inference about changes within the earnings
dis-tribution is still limited. A low degree of mobility is less reason for concern, if there is sufficient change within the earnings distribution, i.e. if migrants can improve the relative earnings position from one generation to the next. For this reason, the next section presents an analysis of intergenerational changes in the relative earnings positions.
5.2 Relative Earnings Mobility
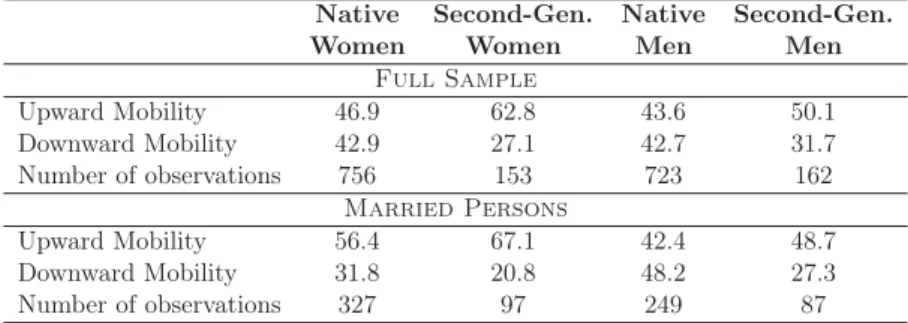
Table 5 presents the share of persons who have improved their relative earnings position compared to their parents (“Upward Mobility”) and the share of persons who have worsened their relative earnings position (“Downward Mobility”).
Women exhibit a larger degree of upward mobility than men whereas the differ-ence is larger among migrants than among natives. While second-generation migrant women show a lower degree of downward mobility than migrant men, the degree of downward mobility is comparable between native men and women. These patterns are even more pronounced among married persons.
To analyze whether the differences in mobility between the population groups are significant, a linear probability model of the probability of having a higher (lower) earnings position compared to the parents is estimated.10 Again, the particular influence of ethnic marriages on the earnings mobility is taken into account.
Table 6 and 7 present the respective results for upward and downward mobility. Looking at upward mobility first, there are no statistically significant differences between the four population groups in the full sample. The results in column 2 show furthermore that marriage has no significant impact on the upward mobility of men while married women have a significantly higher probability to improve their relative earnings position than men and single women.
It is tested whether the type of marriage has an impact on the relative mobility of married migrants (column 4). However, neither the upward mobility of migrant men nor the upward mobility of migrant women is influenced by ethnic marriages.
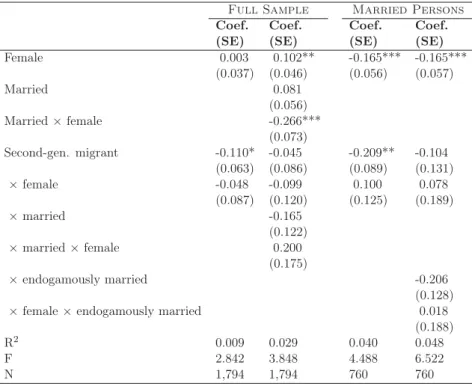
Turning to the probability of downward mobility (Table 7), it is found that
grants have on average a significantly lower probability to worsen their relative earn-ings position from one generation to the next than natives. After controlling for mar-riage, the differences between natives and migrants disappear. Furthermore, while single women have a higher probability of downward mobility than men, the reverse is true for married women. As in the case of upward mobility, ethnic marriages do not have a significant impact on the probability of downward mobility.
6
Conclusion
The objective of this study is to analyze gender differences in the intergenerational earnings mobility of second-generation migrants in Germany and compare these to German natives.
We do not find evidence for large differences in the intergenerational earnings elasticities – neither between men and women nor between natives and migrants. Gender differences are more pronounced among the migrant population with migrant women being on average more mobile than migrant men. While ethnic marriages influence the intergenerational earnings elasticities of migrant men, the parents’ years since migration do not have a significant impact on the children’s earnings. Quantile regression results mainly confirm these results.
In terms of relative upward mobility, there are again few differences between the population groups. Married women stand out with being on average more likely than men to improve their relative earnings position. Furthermore, migrants are less likely than natives to worsen their relative earnings position. Against the initial assumption, there is no evidence that ethnic marriages tie in particular second-generation migrant women more to their parents.
Our results indicate that second-generation migrants are on average as mobile or immobile as the native population. While they are less likely to worsen their economic position, they are not more likely than natives to improve their relative earnings posi-tion. However, given the worse economic background of second-generation migrants, this indicates that second-generation migrants are still not able fully overcome their
References
Algan, Y., Dustman, C., Glitz, A., Manning, A., 2010, The Economic Situation of First-and Second-Generation Immigrants in France, Germany, First-and the UK,Economic Journal, 120(542), F4-F30.
Aydemir, A., Chen, W.-H., Corak, M., 2009, Intergenerational Earnings Mobility among the Children of Canadian Immigrants,Review of Economics and Statistics, 91(2), 377-397. Azevedi, J.P., 2004, GRQREG: Stata module to graph the coefficients of a quantile
regres-sion,Statistical Software Components, Boston College Department of Economics. Bauer, T., Gang, I., 2001, Sibling Rivalry in Educational Attainment: The German Case,
Labour, 15(2), 237-255.
Bauer, T., Dietz, B., Zimmermann, K.F., Zwintz, E., 2005, German Migration: Develop-ment, Assimilation and Labour Market Effects, in K.F. Zimmermann (Ed.): European Migration: What do we know?, Oxford University Press, Oxford, 197-261.
Becker, G.S., Tomes, N., 1979, An Equilibrium Theory of the Distribution of Income and Intergenerational Mobility,Journal of Political Economy, 87(6), 1153-1189.
Black, S.E., Devereux, P.J., 2010, Recent Developments in Intergenerational Mobility,IZA Discussion Paper No. 4866.
Böhlmark, A., Lindquist, M.J., 2006, Life-Cycle Variations in the Association between Current and Lifetime Income: Replication and Extension for Sweden,Journal of Labor Economics, 24(4), 879-896.
Brenner, J., 2010, Life-cycle variations in the association between current and lifetime earnings: Evidence for German natives and guest workers, Labour Economics, 17(2), 392-406.
Chadwick, L., Solon, G., 2002, Intergenerational Income Mobility among Daughters, Amer-ican Economic Review, 92(1), 335-344.
Chen, N.A., Conconi, P., Perroni, C., 2007, Intergenerational Mobility of Migrants: Is There a Gender Gap?,Warwick Economic Research Papers No. 815.
Chiswick, B.R., Houseworth, C.A., 2008, Ethnic Intermarriage among Immigrants: Human Capital and Assortative Mating,IZA Discussion Paper No. 3740.
Couch, K.A., Dunn, T.A., 1997, Intergenerational Correlations in Labor Market Status: A Comparison of the United States and Germany,Journal of Human Resources, 32(1), 210-232.
Ermisch, J., Francesconi, M., Siedler, T., 2006, Intergenerational Economic Mobility and Assortative Mating,Economic Journal, 116(513), 659-679.
Fertig, M., Schmidt, C.M., 2002, First-and Second-Generation Migrants in Germany - What Do We Know and What Do People Think?, in Rotte, R., Stein, P. (Eds.): Migration Policy and the Economy: International Experiences, Vol.1, Neuried: ars et unitas, 179-218.
Furtado, D., Theodoropoulos, N., 2010, Interethnic marriage: a choice between ethnic and educational similarities,Journal of Population Economics, mimeo.
Haider, S., Solon, G., 2006, Life-Cycle Variation in the Association between Current and Lifetime Earnings,American Economic Review, 96(4), 1308-1320.
Haisken-DeNew, J.P., Hahn, M., 2006, PanelWhiz: A Flexible Modularized Stata Interface for Accessing Large Scale Panel Data Sets,mimeo, www.panelwhiz.eu.
Hammarstedt, M., Palme, M., 2006, Intergenerational Mobility, Human Capital Trans-mission and the Earnings of Second-Generation Immigrants in Sweden,IZA Discussion Paper No. 1943.
Meng, X., Gregory, R.R., 2005, Intermarriage and the Economic Assimilation of Immi-grants,Journal of Labor Economics, 23(1), 135-175.
Nybohm, M., Stuhler, J., 2011, Heterogeneous Income Profiles and Life-Cycle Bias in In-tergenerational Mobility Estimation,IZA Discussion Paper No. 5697.
OECD, 2005, What are equivalence scales?,Organization for Economic Co-operation and Development, Paris.
Raaum, O., Bratsberg, B., Røed, K., Österbacka, E., Eriksson, T., Jäntti, M., Naylor, R.A., 2007, Marital Sorting, Household Labor Supply, and Intergenerational Earning Mobility across countries,The B.E. Journal of Economic Analysis & Policy, 7(2).
Rheinisch-Westfälisches Institut für Wirtschaftsforschung, 2009, Monatliche Verbraucher-preisindices nach Bundesländern,RWI: Datenzeche.
Riphahn, R.T., 2003, Cohort Effects in the Educational Attainment of Second Generation Immigrants in Germany: An Analysis of Census Data,Journal of Population Economics, 16(4), 711-737.
Statistisches Bundesamt, 2010, Bevölkerung und Erwerbstätigkeit: Bevölkerung mit Mi-grationshintergund - Ergebnisse des Mikrozensus 2009, Wiesbaden.
Yuksel, M., 2009, Intergenerational Mobility of Immigrants in Germany: Moving with Natives or Stuck in their Neighborhood?,IZA Discussion Paper No. 4677.
Zimmermann, D.J., 1992, Regression Toward Mediocrity in Economic Stature,American Economic Review, 82(3), 409-429.
Figures and Tables
Figure 1: Quantile Regression Coefficients
(a) Full Sample
0.10 0.20 0.30 0.40 0.50 HH Income of father 0 .2 .4 .6 .8 1 Quantile Nat.Women −0.60 −0.40 −0.20 0.00 0.20 0.40 HH Income of father 0 .2 .4 .6 .8 1 Quantile 2ndWomen 0.10 0.15 0.20 0.25 HH Income of father 0 .2 .4 .6 .8 1 Quantile Nat.Men 0.00 0.20 0.40 0.60 HH Income of father 0 .2 .4 .6 .8 1 Quantile 2ndMen (b) Married Persons 0.10 0.20 0.30 0.40 0.50 0.60 HH Income of father 0 .2 .4 .6 .8 1 Quantile Nat.Women 0.00 0.20 0.40 0.60 0.80 HH Income of father 0 .2 .4 .6 .8 1 Quantile 2ndWomen 0.00 0.10 0.20 0.30 HH Income of father 0 .2 .4 .6 .8 1 Quantile Nat.Men 0.20 0.30 0.40 0.50 0.60 HH Income of father 0 .2 .4 .6 .8 1 Quantile 2ndMen
Table 1: Descriptive Statistics Second Natives Generation Mean SD Mean SD Daughters Age 29.2 3.6 28.7 3.2 Married 0.400 0.490 0.586 0.494 Endogamously married - - 0.357 0.481
Household labor income 22,456 12,667 19,313 11,569
No. of earnings obs. 7.1 5.5 6.3 5.0
Household labor income of parents 21,173 8,695 14,040 7,969
Age of father 51.1 6.7 51.6 6.7
No. of earnings obs. of parents 12.3 5.0 12.4 5.2
Number of observations 772 155
Sons
Age 30.4 4.0 29.7 3.3
Married 0.317 0.466 0.470 0.501
Endogamously married - - 0.344 0.477
Household labor income 25,170 13,219 20,657 12,568
No. of earnings obs. 7.6 5.5 6.6 4.5
Household labor income of parents 21,780 9,282 15,539 7,614
Age of father 52.6 6.6 51.4 6.6
No. of earnings obs. of parents 11.7 4.6 13.4 4.7
Number of observations 738 164
Table 2: Income Quantiles
Daughters Sons
Second Second Natives Generation Natives Generation Mean SD Mean SD Mean SD Mean SD
Lowest 10th 10.6 30.8 10.5 30.8 9.8 29.7 16.3 37.1 10th to 20th 8.9 28.4 13.9 34.7 9.1 28.8 18.0 38.5 20th to 30th 7.6 26.5 16.8 37.5 8.9 28.6 7.2 26.0 30th to 40th 8.3 27.6 17.5 38.1 9.9 29.9 12.0 32.6 40th to 50th 9.2 28.9 7.9 27.1 8.7 28.1 16.9 37.5 50th to 60th 10.5 30.7 6.2 24.2 10.8 31.1 6.7 25.2 60th to 70th 11.5 31.9 6.2 24.1 11.0 31.4 3.5 18.5 70th to 80th 11.7 32.1 5.8 23.5 10.7 30.9 6.5 24.8 80th to 90th 10.9 31.2 7.1 25.8 10.6 30.9 4.6 21.0 Highest 10th 10.8 31.1 8.1 27.3 10.4 30.6 8.2 27.6 Parents Lowest 10th 8.0 27.2 32.4 47.0 7.1 25.7 22.4 41.8 10th to 20th 8.6 28.1 15.8 36.6 9.6 29.5 22.5 41.9 20th to 30th 8.0 27.2 21.1 40.9 9.4 29.2 11.1 31.5 30th to 40th 12.3 32.9 8.0 27.2 9.5 29.3 8.0 27.2 40th to 50th 10.0 30.0 7.7 26.7 8.9 28.6 10.2 30.3 50th to 60th 8.4 27.8 4.1 19.9 12.7 33.3 9.4 29.3 60th to 70th 14.1 34.8 1.3 11.5 8.8 28.4 2.9 16.8 70th to 80th 9.6 29.5 2.5 15.6 11.7 32.1 3.9 19.5 80th to 90th 10.8 31.0 2.3 15.1 11.0 31.3 6.9 25.4 Highest 10th 10.1 30.2 4.8 21.5 11.3 31.7 2.7 16.2 N 756 153 723 162
Table 3: Intergenerational Income Elasticities (OLS)
Coef. Coef. Coef. Coef. (SE) (SE) (SE) (SE)
ln𝑦𝑓𝑖 0.133 0.109 0.190** 0.133 (0.083) (0.109) (0.082) (0.083) ln𝑦𝑓𝑖 ×female 0.145 0.253 0.044 0.145 (0.143) (0.197) (0.133) (0.143) ln𝑦𝑓𝑖 ×married 0.089 (0.136) ln𝑦𝑓𝑖 ×female×married -0.243 (0.242) Second-generation migrant× ln𝑦𝑓𝑖 0.218 0.164 -0.034 0.220 (0.180) (0.313) (0.135) (0.187) ln𝑦𝑓𝑖 ×female -0.637** -1.161** 0.009 -0.560 (0.263) (0.499) (0.188) (0.401) ln𝑦𝑓𝑖 ×married 0.074 (0.342) ln𝑦𝑓𝑖 ×female×married 0.927* (0.540) ln𝑦𝑓𝑖 ×endogamously married 0.492** (0.208) ln𝑦𝑓𝑖 ×female× -0.509* endogamously married (0.279) ln𝑦𝑓 𝑖 ×ysm -0.010 (0.086) ln𝑦𝑓𝑖 ×ysm2 -0.021 (0.387) ln𝑦𝑓𝑖 ×female×ysm -0.105 (0.147) ln𝑦𝑓𝑖 ×female×ysm2 1.008 (0.870) R2 0.132 0.161 0.150 0.135 F 7.938 7.498 4.799 6.362 N 1,808 1,808 775 1,808
NOTE.– Weights are used. Standard errors are adjusted for repeated observations on family level. Further control variables are age, age square as well as the age of the father and its square.
Table 4: Intergenerational Income Elasticities (Quantile Regression)
Quantiles OLS 10th 50th 90th Coef. Coef. Coef. Coef. (SE) (SE) (SE) (SE)
Full Sample ln𝑦𝑖𝑓 0.133 0.305* 0.097*** 0.179** (0.083) (0.166) (0.027) (0.072) ln𝑦𝑖𝑓×female 0.145 0.186 0.105*** 0.031 (0.143) (0.256) (0.038) (0.088) Second-generation migrant× ln𝑦𝑓𝑖 0.218 -0.210 0.250*** 0.180 (0.180) (0.243) (0.066) (0.155) ln𝑦𝑓𝑖 ×female -0.637** -0.732* -0.339*** -0.085 (0.263) (0.377) (0.094) (0.188) R2 0.132 F 7.938 Pseudo R2 0.144 0.074 0.081 N 1,808 1,808 Married Persons ln𝑦𝑖𝑓 0.190** 0.302 0.171*** 0.292*** (0.082) (0.273) (0.058) (0.098) ln𝑦𝑖𝑓×female 0.044 0.319 0.044 -0.119 (0.132) (0.384) (0.076) (0.122) Second-generation migrant× ln𝑦𝑓𝑖 0.261* 0.424 0.266** 0.040 (0.142) (0.393) (0.115) (0.206) ln𝑦𝑓𝑖 ×female -0.294 -0.728 -0.326** 0.237 (0.192) (0.528) (0.148) (0.236) R2 0.141 F 4.625 Pseudo R2 0.077 0.115 0.098 N 775 775
NOTE.– See notes Table 3 * p<0.10, ** p<0.05, *** p<0.01
Table 5: Relative Mobility
Native Second-Gen. Native Second-Gen. Women Women Men Men
Full Sample Upward Mobility 46.9 62.8 43.6 50.1 Downward Mobility 42.9 27.1 42.7 31.7 Number of observations 756 153 723 162 Married Persons Upward Mobility 56.4 67.1 42.4 48.7 Downward Mobility 31.8 20.8 48.2 27.3 Number of observations 327 97 249 87
NOTE.– Weighted numbers. All values in %.
Table 6: Upward Mobility
Full Sample Married Persons
Coef. Coef. Coef. Coef. (SE) (SE) (SE) (SE)
Female 0.033 -0.036 0.140** 0.140** (0.036) (0.044) (0.059) (0.060) Married -0.017 (0.055) Married×female 0.175** (0.073) Second-gen. migrant 0.065 0.072 0.063 0.127 (0.059) (0.086) (0.082) (0.131) ×female 0.094 0.089 0.044 -0.062 (0.088) (0.130) (0.125) (0.190) ×married -0.009 (0.118) ×married×female -0.045 (0.183) ×endogamously married -0.126 (0.173)
×female×endogamously married 0.218
(0.238)
R2 0.010 0.021 0.027 0.029
F 2.849 2.671 3.009 2.352
N 1,794 1,794 760 760
NOTE.– Weights are used. Standard errors are adjusted for repeated observations on family level.
Table 7: Downward Mobility
Full Sample Married Persons
Coef. Coef. Coef. Coef. (SE) (SE) (SE) (SE)
Female 0.003 0.102** -0.165*** -0.165*** (0.037) (0.046) (0.056) (0.057) Married 0.081 (0.056) Married×female -0.266*** (0.073) Second-gen. migrant -0.110* -0.045 -0.209** -0.104 (0.063) (0.086) (0.089) (0.131) ×female -0.048 -0.099 0.100 0.078 (0.087) (0.120) (0.125) (0.189) ×married -0.165 (0.122) ×married×female 0.200 (0.175) ×endogamously married -0.206 (0.128)
×female×endogamously married 0.018
(0.188)
R2 0.009 0.029 0.040 0.048
F 2.842 3.848 4.488 6.522
N 1,794 1,794 760 760
NOTE.– See Notes Table 6. * p<0.10, ** p<0.05, *** p<0.01