MATHEMATICS ACHIEVEMENT IN THE SECONDARY HIGH SCHOOL CONTEXT OF STEM AND NON-STEM SCHOOLS
A Dissertation by ALI BICER
Submitted to the Office of Graduate and Professional Studies of Texas A&M University
in partial fulfillment of the requirements for the degree of DOCTOR OF PHILOSOPHY
Chair of Committee, Mary M. Capraro Co-Chair of Committee, Robert M. Capraro Committee Members, Dianne Goldsby
Wen Luo
Head of Department, Lynn M. Burlbaw
August 2016
Major Subject: Curriculum and Instruction
ABSTRACT
The primary purpose of the research conducted during this dissertation study is to explore how students who attended ISHSs performed on the mathematics high-stakes state test compared to their corresponding peers who attended traditional public high schools in Texas. All three studies included in this dissertation used quantitative data (i.e., state standardized test scores) to investigate whether students’ mathematics performance differs by high school types: STEM and non-STEM. The research for the first article employed one year of state-based data and focused on the comparison of STEM and non-STEM high schools in terms of students’ mathematics achievement. The second article employed a longitudinal assessment of students’ mathematics
achievement to observe how students’ initial mathematics scores and their growth rate differ by their high school type as STEM and non-STEM. Research conducted for the third article also used longitudinal state-based data to examine how Hispanic students’ mathematics achievement in ISHSs compares to their Hispanic counterparts in
traditional public schools.
Results from the first study revealed that Hispanic students who participate in T-STEM academies statistically significantly (p < .05) performed better in mathematics at the end of grade 11 than did Hispanic students who participated in traditional public high schools when controlling for gender and SES. The second study revealed female
students’ mathematics growth rate in T-STEM academies was statistically significantly higher than female students’ mathematics growth rate in traditional public high schools
controlling for ethnicity and SES. The third study’s findings indicated that female Hispanic students in T-STEM academies statistically significantly (p < .05)
outperformed female Hispanic students in comparison schools on their mathematics growth rate.
Overall, results from this dissertation study yielded that T-STEM academies are most helpful for Hispanic students, and especially for female Hispanic students, in Texas. The findings of this dissertation are important because increasing the number of underrepresented students who major in STEM, which is needed to maintain the United States’ scientific leadership and economic power in the global world, can be possible by establishing more inclusive STEM schools in high Hispanic populace locations.
DEDICATION
My parents, Cidem Bicer and Cahit Bicer,
Who instilled in me the love of learning at an early age and provided the opportunity for me to pursue a college degree;
My lovely wife, Aysenur,
Who has supported my quest for knowledge throughout almost 7 years of marriage;
My precious daughters, Elif, Nursena, Deniz, and Fatima Who make my life more enjoyable;
My handsome son, Ahmet Kaan Who already makes my life more enjoyable;
My sister and my brother, Derya and Deger Who cheered me on in my studies.
ACKNOWLEDGEMENTS
Many thanks go to my wonderful committee, who guided me in my research. In addition, each one made unique contributions to my education and has mentored me in various aspects of my academic career.
In particular, I would like to express my deepest gratitude to my chair and co-chair, Dr. Mary M. Capraro and Dr. Robert M. Capraro, for the countless hours spent guiding me in research methods, for teaching me how to write an academic paper, and for encouraging me to have various types of academic products throughout my doctoral education.
I am also thankful to my committee members, Dr. Dianne Goldsby and Dr. Wen Luo, for their invaluable suggestions. Dr. Dianne Goldsby not only encouraged me to make my doctoral first priority, but also supported me in teaching undergraduate classes and gave me numerous opportunities to advance my teaching skills. Dr. Wen Luo continually taught me how to conduct advance quantitative models in education, and gave me feedback and ideas when I needed them.
Special thanks also go to the Aggie STEM center, which provided financial support to purchase the data set. I would like to thank my friend, Bilgin Navruz for his help in data analysis process. Also, I would like to thank Celise Rice, who cheerfully proofread all my work for English grammar and APA corrections.
NOMENCLATURE
AP Advance Placement
CTE Career and Technical Education ELP English Language Proficiency HLM Hierarchical Linear Modeling ISHSs Inclusive STEM High Schools
NAEP National Assessment of Educational Progress NRC National Research Council
NSB National Science Board
PBL Project Based Learning
PCAST President’s Council of Advisors on the Science and Technology PISA Programme for International Student Assessment
SAT Scholastic Aptitude Test SAS Statistical Analysis System
SES Socio-Economic Status
SJR SCImago Journal Rank
SNIP Source Normalized Impact per Paper SSCI Social Science Citation Index
STEM Science, Technology, Engineering, and Mathematics ECHS Early College High School
TEA Texas Education Agency
TIMSS Trends in International Mathematics and Science Study
TABLE OF CONTENTS Page ABSTRACT ... ii DEDICATION ... iv ACKNOWLEDGEMENTS ... v NOMENCLATURE ... vi
TABLE OF CONTENTS ... viii
LIST OF FIGURES ... x
LIST OF TABLES ... xi
CHAPTER I INTRODUCTION ... 1
Statement of the Problem ... 2
Purpose of the Study ... 3
Literature Review ... 4
Research Questions ... 8
Journal Selection ... 9
Article 1: STEM Schools vs. Non-STEM Schools: Comparing Students’ Mathematics State Based Test Performance ... 11
Article 2: STEM Schools vs. Non-STEM Schools: Comparing Students’ Mathematics Growth Rate on High-Stakes Test Performance ... 15
Article 3: STEM Schools vs. Non-STEM Schools: Examining Hispanic Students’ Mathematics Achievement ... 19
CHAPTER II STEM SCHOOLS VS. NON-STEM SCHOOLS: COMPARING STUDENTS MATHEMATICS STATE BASED TEST PERFORMANCE ... 23
Introduction ... 23
Methodology ... 33
Results ... 35
CHAPTER III STEM SCHOOLS VS. NON-STEM SCHOOLS: COMPARING STUDENTS’ MATHEMATICS GROWTH RATE ON HIGH-STAKES TEST
PERFORMANCE ... 43
Introduction ... 43
Methodology ... 52
Results ... 55
Conclusion ... 62
CHAPTER IV STEM SCHOOLS VS. NON-STEM SCHOOLS: EXAMINING HISPANIC STUDENTS’ MATHEMATICS ACHIEVEMENT ... 67
Introduction ... 67
Methodology ... 79
Results ... 85
Conclusion ... 94
CHAPTER V SUMMARY AND DISCUSSION ... 98
REFERENCES ... 101
APPENDIX A ... 112
LIST OF FIGURES
Page
Figure 1. Conceptual framework for the present study ... 29
Figure 2. Dual promises of ISHSs ... 71
Figure 3. The elements of successful K-12 STEM programs ... 73
Figure 4. Distribution of propensity score matching ... 81
LIST OF TABLES
Page
Table 1. Proposed articles and journals ... 10
Table 2. Model Summary ... 36
Table 3. Final estimation of fixed effects ... 37
Table 4. Final estimation of fixed effects for intercept ... 58
Table 5. Final estimation of fixed effects for time ... 61
Table 6. Unconditional or base model ... 86
Table 7. The Best Model ... 88
Table 8. Final Estimation of Fixed Effects for Intercept ... 90
CHAPTER I INTRODUCTION
STEM education refers to the teaching and learning practices in the disciplines of science, technology, engineering, and mathematics. STEM education has come front and center for educators and policymakers in the United States, and many reports have recognized this critical issue. These reports, such as the America Competes Act (2007), Rising above the Gathering Storm (2007), and the President’s Council of Advisors in Science and Technology (2010), suggested placing more importance on STEM education in order to ensure the nation’s future global economic power and scientific leadership. These reports focused on STEM education because international indicators such as PISA and TIMSS revealed that American youth fall behind their peers from other developed countries in their science and mathematics abilities (Russell, Hancock, & McCulloguh, 2007). Secretary of Education Arne Duncan (2012) responded to the TIMSS results in a statement saying, “Given the vital role that science, technology, engineering, and math play in stimulating innovation and economic growth, it is particularly troubling…that students in Singapore and Korea are far more likely to perform at advanced levels in science than U.S. students” (Internet). As expected, the National Science Board reported a shortage of STEM workers in the nation’s near future (National Science Board, 2010). Later, the National Research Council (2011) stated three goals that need to be achieved in order to maintain the nation’s current economic power and scientific leadership. First, the number of people who have advanced degrees in STEM majors, such as engineers,
doctors, and scientists, needs to be expanded. Second, the number of people who enter the STEM workforce but do not hold advanced STEM degrees needs to be expanded because the majority of STEM careers do not require advanced STEM degrees, but they require vocational or technical skills. Third and lastly, the number of people who are able to understand basic science and mathematics concepts needs to increase even if these people do not follow STEM career pathways. To achieve these three goals, many interventions were suggested including designing STEM summer camps, offering more advanced science and mathematics classes, and establishing specialized STEM schools. Among the interventions suggested to achieve the three goals for U.S. STEM education, establishing inclusive STEM high schools (ISHSs) was one of the most promising to increase K-12 students’ interest in STEM disciplines (NRC, 2011).
Statement of the Problem
The promising effects of attending ISHSs on students’ science and mathematics achievement are prevalent in the media, but little scholarly research has been conducted on these effects (Burton et al., 2014; Means et al., 2013). Subotnik, Tai, Rickoff, and Almorode (2010) also noted that empirical research examining whether students in ISHSs do better in mathematics and science than students in traditional public high schools has been sparse. This is to be expected, though, given that ISHSs are relatively new with few having even graduated their first class of students (Means et al., 2013). There has been some research published focusing on individual schools (Lynch & Means, 2012) and research with state based data (Gourgey, Asiabanpour, Crawford, Gross, & Herbert, 2009; Young et al., 2011). In this dissertation, I will not report on
individual schools because cases of individual schools do not “prove that the same effect will be achieved when the concept is implemented at scale” (Means et al., 2013, p. 3). I will compare ISHSs with traditional public high schools because “There appears to be no published rigorous, on-site comparative studies of ISHSs designed to make systematic comparisons across ISHSs; between ISHSs and their counterparts; or, that used a set of common measures guided by cohesive research design” (Burton et al., 2014). Means et al. (2013) also pointed out the need for research about ISHSs by suggesting a
longitudinal assessment for future research was required to be able to understand the impact of ISHSs on students’ mathematics achievement.
Purpose of the Study
The primary purpose of the research that will be conducted during this
dissertation study will be to explore how students who attended ISHSs performed on the mathematics high-stakes state test compared to their corresponding peers who attended traditional public high schools in Texas. All three articles will use quantitative data (i.e., state standardized test scores) to investigate whether students’ mathematics performance differs by high school types: STEM and non-STEM. The research for the first article will employ one year of state-based data and focus on the comparison of STEM and non-STEM high schools in terms of students’ mathematics achievement. The second article will employ a longitudinal assessment (2009-2011) of students’ mathematics
achievement to observe how students’ initial mathematics scores and their growth rate differ by their high school type as STEM and non-STEM. Research conducted for the third article will also use longitudinal state-based data to examine how Hispanic
students’ mathematics achievement in ISHSs compares to their Hispanic counterparts in traditional public schools. It is hoped that three proposed articles will fill the existing research gap about the impact of ISHSs on students’ mathematics achievement by employing a longitudinal investigation of large-scale data.
Literature Review STEM High Schools
STEM schools are designed to decrease the mathematics and science achievement gaps among various ethnic groups and to increase all K-12 students’ mathematics and science scores on both national and international standardized tests (Capraro, Capraro, & Lewis 2013; Capraro, Capraro, & Morgan, 2013). There are three types of STEM schools: selective STEM schools, inclusive (i.e., open-admission) STEM schools, and schools with STEM-focused career and technical education (CTE).
Selective and inclusive STEM schools are the two most common STEM schools across the United States (NRC, 2011). The curriculum for selective and inclusive STEM schools was designed to improve students’ science and mathematics learning by engaging students with hands-on tasks in a collaborative and competitive environment (Gonzalez & Kuenzi, 2012). There are some differences between these two types of STEM schools in terms of their organization. The clearest distinction between selective STEM schools and inclusive STEM schools is the admission criteria. Selective STEM schools admit only students who are talented in and motivated toward STEM related fields while inclusive STEM schools have no selective admission criteria. Because of the difference between admission criteria of the two STEM school types, inclusive STEM
schools are considered to serve a broader population (NRC, 2011). Young, House, Wang, and Singleton (2011) noted that “Inclusive STEM schools are predicated on the dual promises that math and science competencies can be developed; and that students from traditionally underrepresented populations need access to opportunities to develop these competencies to become full participants in areas of economic growth and
prosperity” (p. 2). Therefore, inclusive STEM schools utilize a unique school structure to achieve the three goals stated by NRC (2011) for K-12 STEM education.
Texas STEM Initiative
In these three proposed articles, STEM schools were selected from the state of Texas because it has one of the largest inclusive STEM school initiatives in the United States (NRC, 2011). This project, the T-STEM Initiative, was launched in 2006 and continues to grow steadily. The objective of this initiative is to: (a) increase the number of students who follow STEM career pathways; (b) help promote quality school
leadership by supporting school redesign efforts, teacher recruitment, and teacher preparation; and (c) assist in the STEM disciplines’ long term educational development (Educate Texas, 2014). The T-STEM initiative offers a fundamental approach to advancing studies in STEM disciplines by empowering STEM teachers and inspiring students (Educate Texas, 2014).
STEM schools in the state of Texas, known as Texas STEM (T-STEM) academies, are one aspect of the T-STEM initiative and are defined by a unique “blueprint” that differentiates them from non-STEM schools. One important
such as project-based learning (PBL), inquiry based learning, and problem based learning. Avery, Chambliss, Pruiett, and Stotts (2010) noted that the STEM blueprint is one of the remarkable characteristics of T-STEM academies that either guides schools in transitioning to becoming T-STEM academies or establishing new T-STEM academies entirely. The blueprint requires that all T-STEM academies have open enrollment and cannot be selective at the time of enrollment. In addition, the blueprint indicates that each T-STEM academy’s student body needs to be comprised of at least 50% of students who are economically disadvantaged and/or students who come from traditionally underrepresented subpopulations (i.e., female, African American, Hispanic, and disabled) (Avery et al., 2010; Young et al., 2011).
As of 2014, there have been 75 T-STEM academies serving 40,000 students in either grade bands 6-12 or 9-12. T-STEM academies were separated into seven regions, and each region incorporated a STEM center. These seven T-STEM centers are located at universities and regional education service centers and designed to render academic assistance to the T-STEM academies. The T-STEM centers build partnerships with industry and business in order to provide resources for T-STEM academies. More than 2,800 teachers in STEM disciplines receive assistance from these seven T-STEM centers. This assistance includes but is not limited to creating new STEM instructional materials and providing high-quality professional development (Educate Texas, 2014). Success of T-STEM Designation
A study conducted by Young et al. (2011) used state based data to reveal the effects of attending T-STEM academies compared to the effects of attending traditional
high schools in Texas. The findings revealed that students who attended T-STEM academies performed better in mathematics and science than did students who attended traditional public high schools; however, the Cohen’s d effect sizes of attending T-STEM academies reported by this study ranged from 0.12 to 0.17. Specifically, 9th graders in T-STEM academies performed better in mathematics compared to 9th graders in traditional public schools (Gourgey et al., 2009; Young et al., 2011). Similarly, 10th graders attending T-STEM academies performed better in mathematics and science than did their peers in comparison schools (Young et al., 2011). Young et al. (2011) also reported that 9th graders in T-STEM academies were 1.8 times more likely to meet the TAKS benchmarks in the sections of reading and mathematics than were their
counterparts in traditional public schools. Similar results were reported for 10th graders as students in T-STEM academies were 1.5 times more likely than their traditional public school peers to meet the TAKS benchmarks on the reading, mathematics, science, and social science sections. Gourgey et al. (2009) examined students’ academic patterns of change over time in T-STEM academies and found that attending T-STEM academies had different effects on students based on their ethnic background and SES. These results revealed that while attending T-STEM academies increased Hispanic students’ mathematics scores, a slight decrease was observed for African American and White students. Further, the results showed that students from low-SES backgrounds increased their mathematics scores compared to scores in previous years.
Research Questions
Research proposed for this dissertation study is mainly focused on investigating how students who attended T-STEM academies performed on the mathematics section of the Texas Assessment of Knowledge and Skills (TAKS) compared to their
corresponding peers who attended traditional public schools in Texas. Specific questions that will be answered by the research being conducted include:
Articles 1 and 2 Research Questions Published (see table 1)
1. How do students who are enrolled in T-STEM academies perform on TAKS mathematics compared to their corresponding peers who were enrolled in traditional public high schools in Texas?
2. Controlling for students’ demographics (gender, ethnicity, and SES), what is the effect of school types (STEM schools and non-STEM schools) on
students’ mathematics achievement?
3. How does initial student mathematics performance differ by school types (STEM schools and non-STEM schools)?
4. What are the mathematical benefits for students who attended T-STEM academies for three years as compared to their non-STEM counterparts? Article 3 Research Questions
5. Do Hispanic students who attend T-STEM academies perform better on mathematics high-stakes tests than Hispanic students who attended traditional high schools at the end of grade 9?
6. What are the mathematical benefits for Hispanic students who attend T-STEM academies for three years as compared to their Hispanic counterparts who attend traditional public high schools?
Journal Selection
Among the three proposed articles, two of them were already published in academic journals. The first article was published in the International Journal of Global Education in 2014. The second article was published in the International Journal on New Trends in Education and Their Implications in 2015. To submit the third article for publication, two potential journals were selected. These journals were selected based on two major criteria. Initially, the journals were selected based on whether the topic of the article was relevant to the scope and expected readers of the journals. Further, two journals (see Table 1) were selected based on their impact factors and the prestige of the editorial board. The Journal Citation Reports Social Sciences Citation Index (JCR-SSCI), Thompson Reuters, and Scopus database were used to retrieve SCImago Journal Rank (SJR) and Source Normalized Impact per Paper (SNIP) for the journals. The journal web page was referenced for information such as acceptance rate, review type, and other manuscript requirements.
Table 1
Proposed Articles and Journals
Proposed Article Proposed Journal #1 Proposed Journal #2 Article 3: STEM Schools
vs. Non-STEM Schools: Examining Hispanic Students’ Mathematics Achievement
Journal of Latinos and Education
• Acceptance rate: 35%
• Impact and ranking (SJR/SNIP): 0.39/0.698 • Editor in chief: Enrique
G. Murillo
• Publisher: Taylor & Francis
• Type of review: Peer Review
• Manuscript length: 20-30 pages, double space
Educational Studies in Mathematics
• Acceptance rate: 25% • Impact and ranking
(SJR/SNIP): 0.032/1.942 • Editor in chief/Associate editors: Norma Presmeg • Publisher: Springer • Type of review: Peer
Review
• Manuscript length: 16-20 pages
Article 2: STEM Schools vs. Non-STEM Schools: Comparing Students’ Mathematics Growth Rate on High-Stakes Test Performance
Published. The full citation for this article is:
Bicer, A., Navruz, B., Capraro, R. M., Capraro, M. M., Oner, T. A., & Boedeker, P. (2015). STEM schools vs. non-STEM schools: Comparing students' mathematics growth rate on high-stakes test performance.
International Journal of New Trends in Education and Their Implications, 6(1), 138-150.
Article 1: STEM Schools vs. Non-STEM Schools: Comparing Students’ Mathematics State Based Test Performance
Published. The full citation for this article is:
Bicer, A., Navruz, B., Capraro, R. M., & Capraro, M. M. (2014). STEM schools vs. non-STEM schools:
Comparing students’ mathematics state based test
performance. International Journal of Global Education, 3(3), 8-18.
Article 1: STEM Schools vs. Non-STEM Schools: Comparing Students’ Mathematics State Based Test Performance
Background
STEM education refers to teaching and learning in the disciplines of science, technology, engineering, and mathematics. From a broad perspective, STEM education in both formal and informal settings has been considered a set of activities in which students engaged (Gonzalez & Kuenzi, 2012). STEM education has captured the
attention of educators because STEM practices (e.g., project-based learning and inquiry-based learning) in K-12 classrooms enable students to relate their knowledge, skills, and beliefs across STEM disciplines (International Technology Education [ITEA], 1999), thus promising more meaningful science and mathematics learning for K-12 students. Besides researchers and educators, policymakers have also emphasized the importance of K-12 STEM education for the country’s future economic competitiveness in the global market. Several reports by the National Academy of Sciences, National Academy of Engineering, and Institute of Medicine (2011a) have already linked the importance of K-12 STEM education to maintaining the United States’ current scientific leadership and economic power.
In response to the importance of STEM education for the United States’
scientific leadership, the United States’ President Obama has launched the Educate and Innovate program for the purpose of increasing students’ interests toward STEM-related majors by cultivating STEM literacy in K-12 education. Buxton (2001) investigated the role of K-12 education on students’ interest in STEM related subjects. Results from this
study revealed that the K-12 education years are vitally important in developing students’ interest in one of the STEM- related subjects. Therefore, increasing K-12 students’ interest in STEM-related disciplines is essential for leading more students to pursue STEM career pathways in postsecondary education settings.
Cultivating STEM Interest in K-12
Most researchers have found students’ interest to be one of the most promising factors influencing students’ future career plans (Beiber, 2008; Calkins & Welki, 2006; Kuechler, Mcleod, & Simkin, 2009). Interest was defined by Beiber (2008) as “relatively stable preferences that are focused on objects, activities, or experiences” (p. 1). Kuechler et al. (2009) suggested that students choose certain majors only when they are exposed to related real world activities. It is students’ experiences during the K-12 education years that lead them to have more positive attitudes toward certain majors. Thus, engaging students in real-world STEM activities has increased students’ interests in STEM related disciplines (Sahin, 2013). For example, Sahin, Erdogan, Morgan, Capraro, and Capraro (2013) investigated the relationship between high school students’ SAT scores, course enrollment, and pursuit of major at the college level. Results from this study revealed that students with higher SAT mathematics scores were more likely to choose STEM related majors in their college years. Additionally, students involved in advanced placement (AP) courses pursued more STEM related majors than students who did not. In summary, students’ experiences during the K-12 education years were
a certain field (e.g., in one STEM fields) (Beiber, 2008). Therefore, investigating what types of schools (e.g., STEM schools vs. non-STEM schools) develop students’ mathematics and science interests and, in turn, increase their mathematics and science achievement is vitally important.
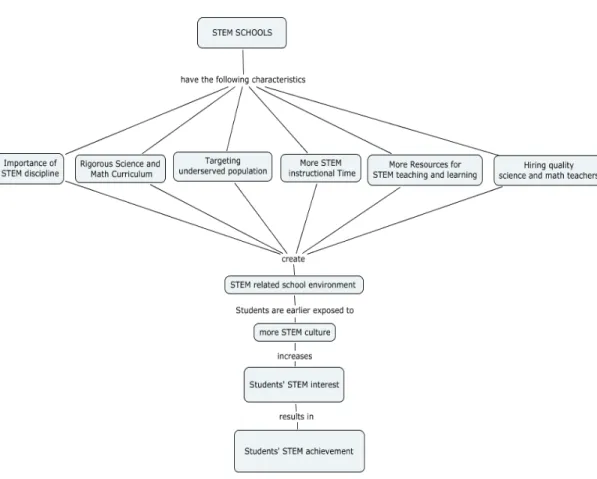
Achieving the goals for the nation’s K-12 STEM education is possible by incorporating STEM for all students. Beiber (2008) noted that students’ school experiences were positively correlated with their science and mathematics course selection and achievement, as well as their persistence in these fields. Therefore, in this proposed article, it is predicted that participation in STEM schools may increase
students’ mathematics achievement because these schools do the following: a) emphasize the importance of STEM disciplines, b) target underserved populations, c) implement rigorous science and mathematics curricula, d) have more STEM
instructional time, e) provide more resources for STEM teaching and learning activities, and f) hire quality science and mathematics teachers (NRC, 2011).
Method
Participants. The sample will consist of 1,887 students (940 from T-STEM schools and 947 from non-STEM schools) who received a TAKS mathematics score in 2011. Students will be excluded from the study if they did not have a TAKS
mathematics score in 2011. Students’ 11th grade mathematics TAKS scale scores will be used as a measurement of students’ mathematics achievement. Students’ gender,
determine the most promising effects of STEM schools.
Data sources. In this quantitative research project, student and school-level data about students who participated in inclusive T-STEM high schools, as well as matched students who participated in non- STEM high schools, will be obtained from the TEA website. This statewide analysis will be based upon 36 schools, of which 18 will be STEM academies and 18 will be matched non- STEM schools. In this study, only 18 T-STEM academies of 65 T-T-STEM academies will be selected because the selected schools need to have the criteria of being turned into inclusive STEM schools before or during the 2008-2009 academic year. Thus, the present study will include only students who participated in STEM academies for at least three years.
Data analysis. This study will use hierarchical linear modeling (HLM) techniques to construct a two-level model for analysis. This technique allows the simultaneous estimation of between-schools variables (STEM schools and non-STEM schools), and within-school level variables (students’ mathematics TAKS scale scores, ethnicity, gender, and SES). A series of model fitness will be estimated by using HLM software, and this procedure will result in the best model with specific student and school-level variables. Based on a theoretical and empirical consideration reported by NRC (2011), each student-level variable will be added one at a time to the model and will be evaluated for statistical significance. The same procedure will be followed for the school-level predictor, and its effects will be also evaluated for statistical significance.
Article 2: STEM Schools vs. Non-STEM Schools: Comparing Students’ Mathematics Growth Rate on High-Stakes Test Performance Background
Researchers conducted both qualitative and quantitative studies to explore the effects of attending T-STEM academies on students’ science, reading, social science, and mathematics achievement (Capraro et al. 2013; Gourgey et al., 2009; Stotts, 2011; Young et al., 2011). The qualitative (Gourgey et al., 2009) and quantitative studies (Capraro et al. 2013; Stotts, 2011; Young et al., 2011) regarding T-STEM academies indicated promising effects of T-STEM academies on students’ academic achievement.
To determine if the positive effects of attending T-STEM academies on students’ academic achievement continue throughout their secondary education, a longitudinal method was used (Capraro et al. 2013; Young et al., 2011). Applying a longitudinal method enables researchers to characterize patterns of change in students’ scores over time, which includes both the average trajectory and the variability of each student’s trajectories. To compare students’ academic achievement in terms of their school types (T-STEM academies and non-STEM schools [traditional public schools]), researchers applied various comparison techniques, such as exact matching or propensity score matching. Results from these studies indicated that students who were in grade 9 in T-STEM academies achieved slightly higher mathematics scores than did their peers in the comparison schools. Similarly, results showed that students who were in grade 10 in T-STEM academies received higher mathematics and science scores than did their peers in the comparison schools. These findings showed a difference favoring T-STEM
academies, but the Cohen’s d effect size reported ranged from 0.12 to 2.03. Results from Young et al.’s study (2011) yielded that students who were in grade 9 and attended T-STEM academies were 1.8 times more likely to meet the benchmarks of TAKS reading and mathematics than were their counterparts in comparison schools. Likewise, students who were in grade 10 and attended T-STEM academies were 1.5 times more likely to meet the benchmarks of TAKS reading, mathematics, social science, and science than were their counterparts in comparison schools (Young et al., 2011).
In another attempt to characterize students’ academic patterns of change over time in T-STEM academies (Gourgey et al., 2009), students who were in grade 10 and participated in T-STEM academies increased their mathematics and reading high-stakes test results compared to their corresponding scores in grade 9. Students who were in grade 10 and came from low-SES backgrounds increased their mathematics scores compared to their mathematics scores in grade 9. In terms of ethnic background, Hispanic students who were in grade 10 showed the largest increase within any of the ethnic groups in their mathematics scores compared to their mathematics scores at grade 9.
Researchers mostly focused on students’ test scores to compare the success of T-STEM academies compared to matched schools; however, NRC (2011) noted that students’ test scores do not convey the complete story of success. In response, researchers also examined the relationship between school types (T-STEM and non-STEM) and dropout rate as a measure of success. Results revealed that students who attended T-STEM academies were 0.8 times less likely to be absent from school than
were their peers in comparison schools (Young et al., 2011; cf. Capraro et al. 2014). Students who attended T-STEM academies were more comfortable with STEM related disciplines and more likely to pursue a college degree, and more female students took advanced placement (AP) courses (Stotts, 2011). Another important finding revealed that one of the high schools changed its rating from Academically Unacceptable to Academically Acceptable as a result of students’ academic achievement scores on high-stakes tests a year after the school turned into a T-STEM academy. After schools became T-STEM academies, more students enrolled in college level courses than they did when their schools were non-STEM schools (Stotts, 2011). The T-STEM academies were more successful across a wide range of variables including test scores, attitude, truancy, and college matriculation.
The present study will apply a longitudinal method to track students’
mathematics success between the years of 2009 and 2011. Researchers have already applied a longitudinal method to characterize students’ success between the years of 2007 and 2009 (Young et al., 2011). However, these studies were conducted in the earlier stage of the newly established T-STEM academies. Therefore, the present study will involve only schools that turned into T-STEM academies before the 2008-2009 school years. This constraint ensures that the schools have had adequate time to implement STEM-specific curriculum and teaching to show promising effects on students’ mathematics achievement.
Methods
Participants. The sample will consist of three years of Texas Assessment of Knowledge and Skills (TAKS) mathematics data for 3,026 students, of whom 1,506 attended 18 T-STEM academies and 1,520 attended 18 non-STEM schools in Texas. The first measurement for the sample will be taken in 2009 at the end of students’ 9th grade year, and the last measurement for the same students will be taken in 2011 at the end of their 11th grade year.
Data sources. In this quantitative research project, student and school-level data about students who attended inclusive stand-alone T-STEM academies, as well as matched students who attended non-STEM high schools, will be obtained from the TEA website. This statewide analysis will be based upon 36 schools, of which 18 will be T-STEM academies and 18 will be matched non- T-STEM (traditional public) schools. In this study, only 18 of the 65 T-STEM academies will be selected because of the selection criteria of becoming an inclusive T-STEM school during or before the 2008-2009 school year and because of the designation of the academy (stand-alone or school-within-school).
Data analysis. Hierarchical linear modeling (HLM) will be used to construct a three-level model for analysis. Level-1 will be the repeated measures, which are nested within students. Level-2 will be the students who are further nested within school types. Level-3 will be the school types (STEM and non-STEM). This three-level model will be used in the present study to characterize patterns of change in students’ measures over time, which will include both the average trajectory and the variability of students’
trajectories. This technique also allows the simultaneous estimation of between-schools variables (STEM schools and non-STEM schools), within-school level variables
(ethnicity, gender, and SES), and the variances of students’ repeated measures. A series of model fit indices will be estimated by using HLM software, and this procedure will result in the best model.
Article 3: STEM Schools vs. Non-STEM Schools: Examining Hispanic Students’ Mathematics Achievement
Background
Traditionally, the purpose of science, technology, engineering, and mathematics (STEM) schools has been to provide advanced STEM coursework to students who are talented and gifted in STEM disciplines (Burton, Lynch, Behrend, & Means, 2014; Means et al., 2013; Young et al., 2011). Recently, a new and innovative approach to STEM school design is emerging: inclusive STEM high schools (ISHSs). Unlike the original STEM schools, known as selective STEM schools, ISHSs accept all students regardless of their previous academic achievement and interest in science and
mathematics (Means et al., 2013; NRC, 2011). This new school design for STEM education is one of the suggestions proposed by the NRC (2011), which noted that ISHSs possess great potential for addressing the following STEM education needs in the United States: a) increasing the number of students interested in STEM careers that require advanced degrees, b) increasing the number of students interested in the STEM careers that require vocational skills, and c) increasing the overall science and
critical to the United States maintaining its current global economic power and scientific leadership (NRC, 2011).
The focus of the present study is on the ISHS initiative in Texas, with a narrowed focus on the factors influencing underrepresented students’ STEM preparation in ISHSs. As a result of the Texas STEM (T-STEM) Initiative, seven T-STEM academies were founded in Texas during the 2006-07 academic year. As of the 2013-14 school year, there were 70 T-STEM academies in Texas serving 40,000 students. There were seven grant-funded T-STEM centers established for the purpose of supporting T-STEM academies. Their mission is to help create innovative instructional models and provide professional development for teachers (Texas Education Agency, 2014). T-STEM academies were designed and implemented under the guidance of a detailed blueprint that requires the academies to: a) provide college preparatory curriculum, b) create real world relevant instruction, c) set a strong academic system, d) offer a wide range of STEM coursework, and e) support underrepresented students and prepare them for STEM college programs and careers (NRC, 2011; Young et al., 2011). Support for underrepresented students is a unique attribute of ISHSs and accounts for the primary difference between the two types of STEM schools.
The main purpose of the present study will be to investigate how Hispanic students’ mathematics achievement in ISHSs compares to that of their counterparts in traditional public schools. This study will be limited to Hispanic students for the following reasons: 1) Hispanic students in Texas had the largest population percentage of total enrollment (50.3%) in 2010-11 (TEA, 2011), and 2) recent research has
demonstrated that Hispanic students are the only ethnic group increasing in mathematics achievement by their enrollment in T-STEM academies (Gourgey et al., 2009).
Therefore, the purpose of this proposed article will be to compare Hispanic students’ mathematics performance in terms of their school types (T-STEM academies and non-STEM schools).
Methods
Participants. The sample for this proposed study will be students (389 from T-STEM academies and 1,036 from traditional public schools) who attended their respective schools for at least three years and received a TAKS mathematics score in 2009 and 2011. Students who did not receive a TAKS mathematics scores in either 2009 or 2011 will be excluded in the study. Students will be also excluded if they transferred into T-STEM academies from a non-STEM school or transferred into a non-STEM school from T-STEM academies. This exclusion ensures that participants in the present study who attended T-STEM academies received at least three years of STEM education and were not exposed to any other school interventions during their high school years. To ensure matched comparison schools did not adopt any school level interventions, schools that implemented any intervention (e.g., Early College High School (ECHS) intervention) will be excluded from the matched school list. Students’ TAKS
mathematics scores will be used as an outcome estimate of students’ mathematics performance.
Data sources. The data will include students’ and schools’ information pulled from the state accountability assessment, Texas Assessment of Knowledge and Skills
(TAKS), which provided empirical data (2009 to 2011). Reporting reliability
coefficients related to students’ mathematics performance will be used to estimate to what extent the data were consistent (Huck, 2008). The reliability coefficients of mathematics scores on the TAKS assessment was reported as ranging from .82 to .88 (TEA, 2008; Zucker, 2003). The first measurement for the sample will be collected at the end of the students’ 9th grade year in 2009, and the last measurement for the same students was taken at the end of the students’ 11th grade year in 2011.
Data analysis. To examine mathematics performance differences at the end of grade 9 between Hispanic students who attended T-STEM academies and Hispanic students who attended traditional high schools, and the growth rate of mathematics performance from grade 9 to grade 11, a three-level growth model in the Hierarchical Linear Modeling (HLM) technique will be applied to analyze student and school-level variables simultaneously (Hox, 2002). Level-1 will be the repeated measures of students’ mathematics scores, which are nested within students. Level-2 will be the students who are further nested within school types. Level-3 will be the school types of STEM and non-STEM schools. Using a three-level model will allow the researcher to analyze patterns of change in students’ measures over time, which include both average trajectory and the variability of students’ trajectories.
CHAPTER II
STEM SCHOOLS VS. NON-STEM SCHOOLS: COMPARING STUDENTS MATHEMATICS STATE BASED TEST PERFORMANCE*
Introduction
STEM education refers to teaching and learning in the disciplines of science, technology, engineering, and mathematics. From a broad perspective, STEM education in both formal and informal settings has been considered a set of activities in which students engaged (Gonzalez & Kuenzi, 2012). STEM education has become a pivotal topic for educators. The foremost reason why STEM education has captured the attention of educators is because STEM practices (e.g., Project-Based Learning and inquiry-based learning) in K-12 classrooms enable students to relate their knowledge, skills, and beliefs across STEM disciplines (International Technology Education [ITEA], 1999), thus promising more meaningful science and mathematics learning for K-12 students. Besides researchers and educators, governors have also emphasized the
importance of K-12 STEM education for the country’s future economic competitiveness in the global market. Several reports by the National Academy of Sciences, National Academy of Engineering, and Institute of Medicine (2011a) have already linked the importance of K-12 STEM education to maintaining the United States’ current scientific leadership and economic power.
* Reprinted with permission from “STEM school vs. non-STEM schools: Comparing Students Mathematics State Based Test Performance” by Ali Bicer, Bilgin Navruz, Robert M. Capraro, & Mary M. Capraro, 2014. Turkish Journal of Education, 3(3), 8-18, Copyright [2014] by International Journal of Global Education.
The success of STEM disciplines plays a vital role for the country’s future in the competitive global market (President’s Council of Advisor on Science and Technology (PSAT), 2010). In response to the importance of STEM education for the United States’ scientific leadership, the United States’ President Obama has launched the Educate and Innovate program for the purpose of increasing students’ interest toward STEM-related majors by cultivating STEM literacy in K-12 education. Buxton (2001) investigated the role of K-12 education on students’ interest in STEM related subjects. Results from this study revealed that the K-12 education years are vitally important in developing
students’ interest in one of the STEM-related subjects. Therefore, increasing K-12 students’ interest in STEM-related disciplines is essential for leading more students to pursue STEM career pathways in postsecondary education settings.
Cultivating STEM Interest in K-12
Most researchers have found interest to be one of the most promising factors influencing students’ future career plans (Beiber, 2008; Calkins & Welki, 2006;
Kuechler, Mcleod, & Simkin, 2009). Interest was defined by Beiber (2008) as “relatively stable preferences that are focused on objects, activities, or experiences” (p. 1). Kuechler et al. (2009) suggested that students choose certain majors only when they are exposed to related real-world activities. It is students’ experiences during K-12 education years that lead them to have more positive attitudes toward certain majors. Thus, engaging students in real-world STEM activities has increased students’ interests in STEM related disciplines (Sahin, 2013). For example, Sahin, Erdogan, Morgan, Capraro, and Capraro (2013) investigated the relationship between high school students’ SAT scores, course
enrollment, and pursuit of major at the college level. Results from this study revealed that students with higher SAT mathematics scores were more likely to choose STEM related majors in their college years. Additionally, students involved in advanced placement (AP) courses pursued more STEM related majors than students who did not. In summary, students’ experiences during K-12 education years were positively
correlated with their course selection, overall achievement, and persistence in a certain field (e.g., in one STEM fields) (Beiber, 2008). Therefore, investigating what types of schools (e.g., STEM schools vs. non-STEM schools) develop students’ mathematics and science interests and, in turn, increase their mathematics and science achievement is vitally important.
Needs for K-12 STEM Education
Three main reasons account for U. S. concerns about the state of K-12 STEM education. The first reason is students’ science and mathematics test performance as measured by the National Assessment of Educational Progress (NAEP) showed that students were not proficient in mathematics and science (Schmidt, 2011). Additionally, international indicators (e.g., TIMMS and PISA) have showed that students from the United States did not perform well in mathematics and science compared to other developed countries (e.g., Singapore, and China), thus putting their scientific leadership and economic power in danger. The second reason why the United States is concerned about K-12 STEM education is due to the size of the mathematics and science
achievement gaps between students who come from the traditional upper class and those students who come from diverse ethnic and low-SES backgrounds. For example,
Hispanic students performed far lower than the mean in mathematics and science on the national examinations (Hill, Bloom, Black, & Lipsey, 2008).
One of the goals for STEM education reported by National Research Council (2011) was to increase the number of underrepresented students who pursue STEM majors in their post-secondary education in order to fill an increased portion of
prominent STEM-related job needs in the United States. Educate and Innovate (2009) was developed to address the achievement gap issue and aims to increase underserved students’ interest in mathematics and science during the K-12 education years
(Executive Office of the President, 2009). Young (2005) showed that despite the
increasing number of underrepresented students entering post-secondary education, these students have been underrepresented in pursuing STEM majors. Later, the National Science Board (2010) reported that although non-White and non-Asian groups represent one quarter of the entire U.S. population, only 10 percent of all STEM related doctorates are awarded to these groups. Quickly changing demographic patterns in the United States require that non-White and non-Asian students pursue STEM related careers to fill an increasing portion of prominent STEM positions in the United States.
Although there is an effort to increase the number of students who pursue advanced STEM degrees, increasing the number of students who pursue the STEM related workforce (e. g., K-12 STEM teachers, computer and medical assistance, and nursing) is equally important for the nation’s economic competitiveness in the global market (U.S. Department of Labor, 2007). Lacey and Wright (2009) noted that these jobs do not require advanced STEM degrees. Having a vocational certification with a
STEM related major or a bachelor’s degree in a STEM associated field is sufficient. Not surprisingly, the second goal for K-12 STEM education reported by the NRC (2011) is to “Expand the STEM-capable workforce and broaden the participation of women and minorities in that workforce” (NRC, 2011, p. 5). This goal was important because the domestic needs for a workforce in STEM-associated fields increased rapidly from 2008 to 2009. The National Science Foundation (2010) reported that while the unemployment rate from 2008 to 2009 increased 3.8%, the needs of the workforce in STEM-associated jobs increased by 3.3%. In the next decade, it is projected that there will be 20 new occupations, and 80% of these occupations will be related to STEM fields. While 5% of these occupations will require an advanced STEM degree, 75% of them will require solely vocational certification or an undergraduate degree with a major in a STEM associated field (Lacey & Wright, 2009). In order to fill a rapidly increasing portion of the STEM workforce, more and more K-12 STEM students need to pursue STEM related majors in their post-secondary education and later follow STEM related career pathways. The NRC (2011) noted that achieving this goal is essential because “the nation’s economic future depends on preparing more K-12 students to enter these fields” (p. 5).
The Educate and Innovate program’s central aim is to increase STEM literacy in K-12 education regardless of students’ future career plans. NRC (2011) also reported the last and most important goal for STEM education is to increase STEM literacy, which is a key 21st century skill, for all students even if they do not pursue a STEM-related career pathway. The goal is to provide students with the necessary knowledge and
understanding of basic scientific and mathematical concepts that they face in real life (NRC, 1996). Achieving this goal is vital because current employers in various industries have complained of their employees’ lack of mathematics, technology, and problem-solving skills (National Governors Association, 2007). Increasing STEM literacy for all students, not just for those who follow STEM-related career pathways in their postsecondary education, will make future citizens capable of dealing with the complex problems of the 21st century’s scientific and technology-driven society (NRC, 2011).
Statement of Purpose
Achieving all three goals mentioned above for the nation’s K-12 STEM
education is possible by incorporating STEM for all students. Beiber (2008) noted that students’ school experiences were positively correlated with their science and
mathematics course selection, achievement, and persistence in these fields. Therefore, it is predicted that participation in STEM schools may increase students’ science and mathematics achievement because these schools do the following: a) emphasize the importance of STEM disciplines, b) target underserved populations, c) implement rigorous science and mathematics curriculum, d) have more STEM instructional time, e) provide more resources for STEM teaching and learning activities, and f) hire quality science and mathematics teachers (NRC, 2011). Figure 1 shows the conceptual framework for the present study.
STEM Schools
STEM schools are designed to decrease the mathematics and science achievement gaps among various ethnic groups and to increase all K-12 students’ mathematics and science scores on both national and international standardized tests. There are three types of STEM schools: selective STEM schools, inclusive STEM schools, and schools with STEM-focused career and technical education (CTE).
Selective and inclusive STEM schools are the two most common STEM schools across the Unites States (NRC, 2011). The curriculum for the selective and inclusive STEM schools was designed to improve students’ science and mathematics learning by engaging students with hands-on tasks in a collaborative and competitive environment (Gonzalez & Kuenzi, 2012). There are some differences between these two types of STEM schools in terms of their organization. The clearest distinction between selective STEM schools and inclusive STEM schools is the admission criteria. With regard to admission criteria, selective STEM schools admit only talented and motivated students to STEM related fields while inclusive STEM schools have no selective admission criteria. Because of the disparity among admission criteria between the two STEM-school types, inclusive STEM STEM-schools are considered to serve a broader population (NRC, 2011). Young, House, Wang, Singleton, and Klopfenstein (2011) noted that “Inclusive STEM schools are predicated on the dual promises that math and science competencies can be developed, and students from traditionally underrepresented populations need access to opportunity to develop these competencies to become full participants in areas of economic growth and prosperity” (p. 2). Therefore, inclusive
STEM schools have a unique structure to achieve the three goals stated by NRC (2011) for K-12 STEM education. In the present study, we only included inclusive STEM schools, which will be compared with non-STEM schools.
In the present study, we chose inclusive STEM schools in the state of Texas because Texas has one of the biggest STEM initiatives. The first six T-STEM academies started serving students in 2006, and the number of T-STEM academies has persistently expanded from 2006 to 2014. Currently, there are 65 T-STEM academies (26 campuses for only high school students and 39 campuses for both middle and high school students) serving about 35,000 students in Texas. Therefore, selecting inclusive STEM schools in Texas provides us a large data set and makes sure we have reasonable time to observe changes on students’ science and mathematics achievement after schools turned into STEM schools.
The other two reasons why inclusive STEM schools in Texas were selected is for the two characteristics of inclusive STEM schools in Texas. One important characteristic of T-STEM academies is the “blueprint” that guides schools in the planning and
implementation of innovative instructional methods. The blueprint specifies that all T-STEM schools are inclusive, and cannot be selective at the time of enrollment. In addition, the blueprint specifies that each T-STEM academy needs to have at least 50% of students who are economically disadvantaged and at least 50% of students who come from traditionally underrepresented subpopulations (Young et al., 2011). A second important characteristic of inclusive STEM schools in Texas is STEM centers. T-STEM academies were divided into parts based on their regions, and each region
incorporated a T-STEM center. The T-STEM centers’ aim is to help T-STEM academies by creating innovative STEM instructional materials and providing effective
professional development to teachers. There are seven T-STEM centers, and these support more than 2,800 STEM teachers to empower their teaching in STEM-related subjects (Texas Education Agency, 2013). Besides creating innovative science and mathematics classrooms and delivering professional development to teachers, these educational centers are charged with a) designing innovative STEM curricula; and b) creating partnerships among businesses, universities, and school districts. T-STEM academies, along with professional development centers and networks, work
collaboratively to improve the quality of instruction and students’ academic performance in STEM-related subjects at secondary schools. T-STEM academies are also well
equipped with labs that allow teachers to adopt innovative instructional methods in science and mathematics classrooms.
Research Questions
1) How do students who participated in T-STEM schools perform on TAKS mathematics compared to their corresponding peers who participated in traditional public schools in Texas?
2) Controlling for students’ demographics (gender, ethnicity, and SES), what is the effect of school types (STEM schools and non-STEM schools) on students’ mathematics achievement?
Methodology
In this quantitative research project, student and school-level data about students who participated in inclusive T-STEM high schools, as well as matched students who participated in non-T-STEM high schools, were obtained from the Texas Education Agency (TEA) website. This statewide analysis was based upon 36 schools, of which 18 were T-STEM and 18 were matched non-STEM schools. In this study, only 18 T-STEM academies of 65 T-STEM academies were selected because the selected schools needed to have the criterion of being turned into inclusive STEM schools before or during the 2008-2009 academic year. Thus, the present study included only students who
participated in STEM academies for at least three years.
In order to match students who participated in 18 T-STEM academies with their corresponding peers who participated in 18 non-STEM schools, school-level data was first matched by following the TEA campus comparison method. This comparison is based upon the following school-level variables: 1) ethnicity (% of Hispanic students, % of African American students, and % of White students), 2) economic disadvantage status (free lunch, reduced price lunch, other public assistance, and none), 3) English language proficiency (met with English language proficiency state standard, and not met with English Language proficiency standard), and 4) school mobility rate.
The sample consisted of 1,887 students (940 from T-STEM schools and 947 from non-STEM schools) who received a TAKS mathematics score in 2011. Students were excluded from the study if they did not have a TAKS mathematics score in 2011. Students’ 11th grade mathematics TAKS scale scores were used as an outcome of
students’ mathematics achievement. Students’ gender, ethnicity, and SES background were added as predictors to the model in order to determine the promising effects of STEM schools.
Procedures for Analysis
This study used hierarchical linear modeling (HLM) techniques to construct a two-level model for analysis. This technique allows the simultaneous estimation of between-schools variables (STEM schools and non-STEM schools), and within-school level variables (students’ mathematics TAKS scale scores, ethnicity, gender, and SES). Kreft, DeLeuw, and Van Der Leeden (1994) noted that HLM software provides the same results as other commonly used software (e.g. SAS, and ML4), and is perfectly
appropriate for disentangling multilevel effects. A series of model finesses were estimated by using HLM software, and this procedure resulted in the best model with specific student and school-level variables. Based on a theoretical and empirical consideration reported by NRC (2011), each student-level variable was added one at a time to the model and evaluated for statistical significance. The same procedure was followed for the school-level predictor, and its effects were also evaluated for statistical significance. The slopes of student-and school-level variables were “fixed” and not allowed to randomly vary if random effects of these variables were not statistically significant in improving the model fitness. The indices of model fitness were based on a Chi-square test, in which deviations’ scores and degrees of freedom (df) provided by HLM software were subtracted from each other to determine whether the slope of the variables had random or fixed effects.
Results Model Specification
Using the variables discussed in the NRC (2011) report, student and school-level data were added to the model in order to test whether STEM schools increase students’ mathematics achievement in comparison to students’ mathematics achievement in non-STEM schools. Students were treated as Level 1 and schools as Level 2, indicating that this study investigated school types (STEM schools and non-STEM schools) that may be associated with average mathematics achievement of students. This study also examined how students’ demographics associated with students’ mathematics achievement may vary from STEM schools to non-STEM schools. Once the slope of each variable was decided to be fixed or random, the best model (see in table 2) was drawn.
Table 2
Model Summary
Level Model
Level1 MATH.2ij = β0j + β1j*(Hij) + β2j*(Bij) + β3j*(Aij) + β4j*(FEMALEij) + β5j*(SESij) + rij
Level2 β0j = γ00 + γ01*(STEM9_MEj), β1j = γ10 + γ11*(STEM9_MEj), β2j = γ20 + γ21*(STEM9_MEj), β3j = γ30 + γ31*(STEM9_MEj), β4j = γ40 +
γ41*(STEM9_MEj), β5j = γ50 + γ51*(STEM9_MEj)
In the study, all independent variables were categorical variables. A dummy coding strategy was necessitated to use these independent variables in HLM software. In this procedure, males were taken as the reference group for gender; Whites were the reference group for ethnicity, high-SES background of students was the reference for SES, and, non-STEM schools were specified as the reference group for schools.
Therefore, the baseline reference group in the present study comprises students who are White, male, and from a high-SES background in non-STEM schools. This group was selected as the reference group because this group traditionally is considered to be upper class, and the previous studies already showed the existing mathematics achievement gap between students who come from underrepresented groups and students who come from the upper class (Bicer, Capraro, & Capraro, 2013). In table 3, the intercept (γ ) is
estimated as 2356.4 (SE = 9.6) p < 0.01, which is the predicted mean mathematics score for students who are in the reference group in the 11th grade. The predicted mean differences of mathematics scores between STEM and non-STEM schools for students who are white, male, and high-SES is (γ01 = 31.39, (SE = 23)), but the predicted
mathematics scores of these two groups were not statistically significantly different from each other at p >.05.
Table 3
Final Estimation of Fixed Effects
Fixed Effect Coefficient SD t-ratio N p-value For INTRCPT1, β0
INTRCPT2, γ00 2356.39 9.60 245.30 1887 <0.001
STEM, γ01 31.38 23.55 1.33 1887 0.183
For Hispanic slope, β1
INTRCPT2, γ10 -93.74 12.71 -7.37 1887 <0.001
STEM, γ11 56.01 28.07 1.99 1887 0.046
For Black slope, β2
INTRCPT2, γ20 -155.71 25.04 -6.21 1887 <0.001
STEM, γ21 29.20 39.91 0.73 1887 0.465
For Asian slope, β3
INTRCPT2, γ30 -130.37 153.53 -0.84 1887 0.396
STEM, γ31 184.12 164.35 1.12 1887 0.263
For FEMALE slope, β4
INTRCPT2, γ40 -10.32 8.23 -1.25 1887 0.210
STEM, γ41 -13.54 16.02 -0.84 1887 0.398
For SES slope, β5
INTRCPT2, γ50 -16.02 11.58 -1.38 1887 0.167
Participation in STEM schools by students who come from a minority ethnic background (Asian, Black, and Hispanic) showed positive effects on students’ overall mathematics scores, but the only statistically significant interaction effect of
‘ETHNICITY’ and ‘STEM’ is for Hispanic students with (γ11 = 56.02, (SE = 28.07), p < .05). This means that participating in STEM schools statistically significantly increased Hispanic students’ mathematics scores relative to the reference group’s predicted mean mathematics score. Hispanic students in STEM schools performed 181.16 units
predicted mean score higher than Hispanic students in non-STEM schools. The interaction effect of participating in STEM academies and gender was negative for female students, but this interaction effect was not statistically significant. This interaction was formed by multiplying the scores for the variables ‘STEM” and
“FEMALE” with the negative value (γ11 = -13.54), meaning that male students’ predicted mathematics score tends to increase more in comparison to female students’ mean
mathematics score as they participate in STEM schools. Comparing female students’ predicted mean mathematics score in terms of their school types yielded that female students who participated in STEM schools performed 31 units higher on the 11th grade TAKS standardized mathematics test than female students who participated in non-STEM schools. For students who come from a low-SES background, the interaction effect of participation in STEM schools and SES background on students’ predicted mean mathematics score was positive (γ51 = 4.61, (SE = 20.75)), but not significant (p > .05). This interaction means that students who come from lower SES backgrounds and participate in STEM schools tend to increase their mathematics score more in
comparison to students who come from higher SES backgrounds and participate in STEM schools. Comparing high and low-SES background students’ mathematics scores in terms of the students’ school types revealed that students who come from a low-SES background and participate in STEM schools performed 52 units higher on their math score than students who come from low-SES background and participate in non-STEM schools.
Conclusion
The purpose of the present study is to examine how students’ performance on TAKS mathematics differs in terms of their school type as STEM and non-STEM schools. Comparing students’ mathematics TAKS performance in grades 9 and 10 in terms of their school types has been already; however, no study has investigated how students’ TAKS mathematics performance differs in terms of students’ school type (i.e. STEM and non-STEM) when students were in grade 11. This is one of but not the main reason why the present study focuses on only 11th grade students. The main aim of focusing on 11th grade is to see the effect of participating in T-STEM schools on students’ mathematics achievement after they completed 9th, 10th, and 11th grades in T-STEM schools compared to their corresponding peers’ mathematics achievement in non-STEM schools.
Previous research’s findings revealed that 9th graders in T-STEM academies performed slightly better in mathematics than their matched peers in non-STEM schools. Likewise, 10th graders in T-STEM academies performed better in mathematics than their counterparts in comparison schools. Although there was a difference in students’
mathematics performance favoring T-STEM academies, the effect sizes ranged from 0.12 and 0.17 (Young et al., 2011). The present study did not find a statistically significant difference in students’ TAKS mathematics scores between T-STEM and matched non-STEM schools when controlling for ethnicity, gender, and SES. This can be explained by the selection of the reference group and T-STEM schools’ profiles. In the present study, the reference baseline group was selected as White, male, high-SES background students in non-STEM schools. As reported in the T-STEM blueprint, at least 50% of students in T-STEM academies need to come from the underserved population and/or 50% need to be economically disadvantaged (Young et al., 2011). Students who are academically successful and come from the upper class may not be eager to participate in T-STEM academies due to the diverse profile of T-STEM schools.
The most important and interesting finding of this study is the interaction effect of ‘STEM’ and ‘Hispanic, which is statistically significant (p < 0.05). This means that participating STEM schools statistically significantly increase Hispanic students’ mathematics score relative to the reference group’s predicted mean mathematics score. This finding is consistent with prior work by Crisp, Nora, and Taggart (2009), which showed that being Hispanic was not found to decrease the chance of a student’s success in STEM compared to White students. Controlling for gender and SES in the present study, results show being Hispanic in STEM schools increases the chance of success in mathematics; however, being Hispanic in non-STEM schools decreases the chance of success in mathematics controlling for gender and SES. This conclusion confirms the finding that Hispanic students increased their scores on high-stakes test when they