2014 Report:
Big Moose
Lake
Adirondack Watershed Institute
Paul Smith’s College
P.O. Box 265
Paul Smiths, NY 12970
Report No. PSCAWI 2015-16
Adirondack Lake Assessment Program
Adirondack Watershed Institute of Paul Smith’s College ii
Acknowledgements
The Adirondack Lake Assessment Program (ALAP) is collaboration between the Paul Smith’s College Adirondack Watershed Institute (AWI) (www.adkwatershed.org), Protect the Adirondacks (PROTECT) (www.protectadks.org), volunteer lakes monitors, and lake associations. The AWI is a program of Paul Smith’s College that conducts research and service work broadly focused on conservation and
protection of water resources. PROTECT is a non-profit organization dedicated to the protection and stewardship of the public and private lands of the Adirondack Park, and to building the health and diversity of its human communities and economies for the benefit of current and future generations. PROTECT recruits volunteers to participate in the program and provides administrative support, while AWI trains volunteers, conducts site visits, analyzes samples, and writes the reports. As such, this report and all results and interpretations contained herein were the sole responsibility of AWI. The narrative and results presented in this report were produced by Corey Laxson (Research Associate), Elizabeth Yerger (Research Assistant), and Daniel L Kelting (Executive Director), all with the AWI. Laboratory work on samples received from ALAP volunteers was conducted by Corey Laxson, Elizabeth Yerger, Sean Patton, Brandon Morey, and Dan Kelting. Sean Regalado produced watershed maps in GIS. Peter Bauer, Nancy Bernstein and Evelyn Greene from PROTECT provided administrative support. The lake sampling was conducted by the dedicated ALAP volunteers. John and Ellen Collins, Susan Murante and Marty Mozdzier provided locations for sample collection hubs. Paul Smith’s College provided office and laboratory space. PROTECT is very grateful for the support provide to ALAP from the F.M. Kirby Foundation.
Please cite this report as:
Laxson*, C.L., Kelting, D.L., and E.C. Yerger. 2015. Adirondack Lake Assessment Program: 2014 Report, Big Moose Lake. Adirondack Watershed Institute of Paul Smith’s College. Report No. PSCAWI 2015-16. 14p.
*Corresponding author Corey Laxson at [email protected]
Adirondack Watershed Institute of Paul Smith’s College iii
How to Use This Report
The ALAP reports are designed to provide lake information to the informed lay person, scientific community, lake managers, and other interested individuals. As such, it is written in a way to provide something for everyone. The report includes an overview of the water quality indicators, a detailed description of the methods, discussion of this year’s results and historical trends, and characterization of the trophic status of the lake. Members of the scientific community will likely find the entire document useful, while readers who are interested in a simple summary of the lake may find the Executive
Summary and the Quick Facts sections to be most helpful. The data and accompanying analysis provided in this report give insight into the water quality of the study lakes, more detailed limnological studies may be necessary to produce management recommendations or specific trend interpretations. Readers interested in additional information or accesses to the raw data are welcome to contact the
corresponding author.
The data in this document are reported in metric units. Although this system has not been fully adopted in the United States, it is the standard system of measurement used by scientists and lake mangers throughout the world. Information on converting the metric units of measurements used in this report to English units is provided below. The amount of chemical elements dissolved in the lake samples are always described using metric concentration units. The most common ways chemical data is expressed is in milligrams per liter (mg/L) and micrograms per liter (µg/L). One milligram per liter is equal to one part analyte to one million parts water. One microgram per liter is equal to one part analyte to one billion parts water.
Metric Unit Multiply by English Unit
Liters (L) 1.05 Quart (qt)
Meters (m) 3.38 Feet (ft)
Kilometer (km) 0.62 Miles (mi) Hectares (ha) 2.47 Acres (ac) Cubic Meters (m3) 1.31 Cubic Yards (yd3)
Adirondack Watershed Institute of Paul Smith’s College iv
Table of Contents
Quick Facts – Big Moose Lake ... vList of Tables... vi
List of Figures ... vii
Executive Summary ... viii
Introduction ... 1
Methods ... 3
Results and Discussion ... 4
Literature Cited ... 13
Appendix 1. Analytical methods performed on ALAP samples at the AWI Environmental Research Lab. ... 14
Adirondack Watershed Institute of Paul Smith’s College v
Quick Facts – Big Moose Lake
Trophic Status: Mesotrophic
Years in ALAP: 10
2014 Water Quality Indicators and Long-Term Trends*:
Indicator
Avg.
Trend
Indicator
Avg. Trend
Transparency (m)
3.4
no trendAlkalinity (mg/L)
1.9
no trendTotal P (µg/L)
7.0
no trendNitrate (µg/L) 118.3
naChlorophyll-
a
(µg/L)
2.8
no trendChloride (mg/L)
0.4
no trendLaboratory pH
6.8
increasingCalcium (mg/L)
1.3
naConductance (µS/cm)
11.7
decreasingSodium (mg/L)
0.5
naColor (Pt-Co)
17.5
no trend*Long term trends are only shown for indicators with more than five years of data.
County:
Herkimer
Lake Area (ha):
499
Adirondack Watershed Institute of Paul Smith’s College vi
List of Tables
Table 1. 2014 ALAP lakes organized by the number of years in the program. ... 1 Table 2. Lake and watershed characteristics for Big Moose Lake. ... 3 Table 3. Trophic classification of lakes based on Carlson's Trophic Status Index (TSI). ... 4 Table 4. Water quality indicators by sampling date and average for Big Moose Lake, 2014. BDL = Below detection level. ... 6
Preparing the Lachat to analyze ALAP water samples for total phosphorus via flow injection analysis in the AWI Environmental Research Lab
Adirondack Watershed Institute of Paul Smith’s College vii
List of Figures
Figure 1. Locations and names of lakes that participated in the Adirondack Lake Assessment Program (ALAP) in 2014. ... 2 Figure 2. Frequency histogram (bars) and cumulative percentage (plots) of 2014 water quality indicators for the 72 participating lakes. Figure is constructed with each lakes 2014 average. ... 5 Figure 3. The annual average values of epilimnetic trophic indicators of Big Moose Lake, 2004-2014. (A) Secchi disk transparency, (B) total phosphorus concentration, (C) chlorophyll-a concentration, and (D) Carlson's Trophic Status Index. Vertical bars represent one standard deviation of the mean. Significant trends (P≤0.05) are noted with a trend line. ... 7 Figure 4. The annual average values of water quality indicators of Big Moose Lake, 2004-2014. (A) Specific lab conductivity @ 25 C, (B) apparent color, (C) pH, (D) total alkalinity, and (E) chloride. Vertical bars represent one standard deviation of the mean. Significant trends (P≤0.05) are noted with a trend line... 11
Adirondack Watershed Institute of Paul Smith’s College viii
Executive Summary
Big Moose Lake is a 499 ha lake located in Herkimer County in the Town of Webb. The lake is located within a 9,685 ha watershed dominated by forests. Big Moose Lake has been monitored by ALAP volunteers and the Adirondack Watershed Institute since 2004. Three samples were analyzed in 2014 for transparency, chlorophyll-a, total phosphorus, nitrate, pH, color, alkalinity, conductivity, chloride, calcium and sodium. This report presents the 2014 data and describes long-term trends in water quality for analytes with sufficient data.
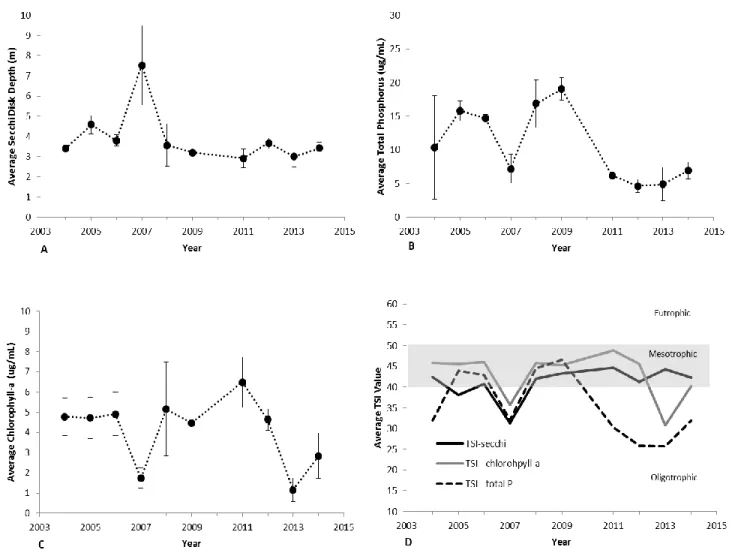
1. The Secchi disk transparency of the lake averaged 3.4 meters in 2014, which is greater than 69% of the ALAP participating lakes. The transparency of the lake has been relatively constant over the 10 years of monitoring with the exception of 2007 when average transparency was observed to be greater than 7 meters.
2. Total phosphorus and chlorophyll concentrations in the lake have been highly variable over time, with no significant trend detected in the data. The lowest total phosphorus concentrations have been observed over the last four years of monitoring.
3. The TSI Index for Big Moose Lake calculated with secchi transparency (42.3) and chlorophyll-a (40.3) indicated a mesotrophic status, while the TSI calculated from total phosphorus (32.0) suggested an oligotrophic classification for the lake. This type of disparity in TSI classification is typical of lakes experiencing phosphorus limitation. Historically the lake fluctuates around the oligotrophic-mesotrophic boundary.
4. Big Moose Lake was a circumneutral water body in 2014, the pH of the water samples showed little variation around the annual average of 6.8 pH units. Over the past 10 years of monitoring the pH of Big Moose Lake has ranged from 5.0 to 7.3 with a significant increasing trend at a rate of 0.16 pH units / year (P=0.032). Despite the observed increase in pH, the acid neutralizing ability of the lake is low (1.9 mg/L) and remains highly sensitive to acid deposition (alkalinity < 10 mg/L).
5. Adirondack lakes in watersheds without paved roads typically have sodium and chloride concentrations less than 0.55 and 0.24 mg/L respectively (Kelting et al 2012). Average
concentrations in Big Moose Lake during 2014 were 0.5 mg/L for sodium and 0.4 mg/L for chloride. These values are within the range expected for a lake that has limited salted roads in the watershed. 6. Calcium concentrations in Big Moose Lake (1.3 mg/L) are below the threshold required for the
establishment of a viable zebra mussel population (8-20 mg/L).
Though the data and accompanying analysis provided in this report give insight into the water quality of Big Moose Lake, more detailed limnological studies may be necessary to produce management
Adirondack Watershed Institute of Paul Smith’s College 1
Introduction
The Adirondack Lake Assessment Program (ALAP) is a cooperative citizen science lake monitoring program between Protect the Adirondacks (PROTECT), the Paul Smith’s College Adirondack Watershed Institute (AWI), and numerous dedicated volunteers from across the Adirondack Park and beyond. The objectives of ALAP are to (1) develop a reliable water quality database for Adirondack lakes, (2)
document historical trends in their limnological condition, and (3) engender lake stewardship by providing opportunities for citizens to participate in scientific monitoring. To accomplish these
objectives participating lakes are sampled throughout the summer by trained volunteers and analyzed by the AWI for indicators of trophic productivity (total phosphorus, chlorophyll, transparency) and water quality (nutrients, pH, alkalinity, color, chloride, and metals). ALAP continues to be a highly successful program. Established in 1998 with 9 participating lakes, the program has grown to 72 lakes in 2014 (Figure 1 and Table 1). For many lakes the ALAP dataset represents the only available source of current water quality information.
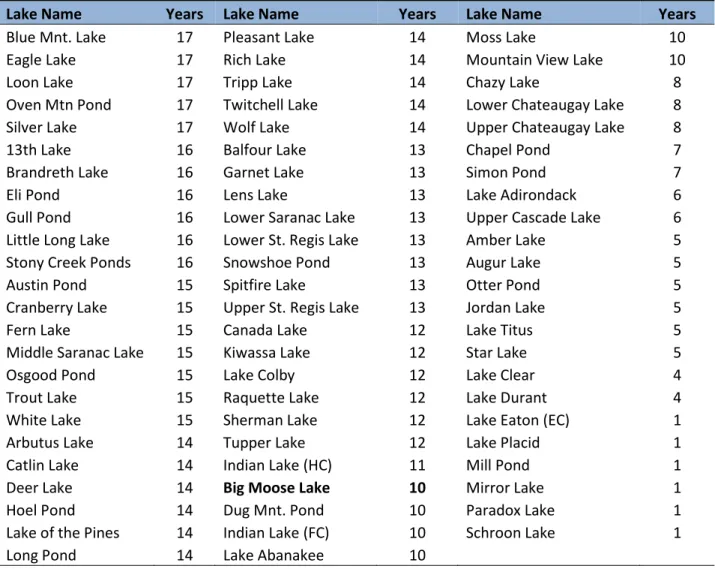
Table 1. 2014 ALAP lakes organized by the number of years in the program.
Lake Name Years Lake Name Years Lake Name Years
Blue Mnt. Lake 17 Pleasant Lake 14 Moss Lake 10
Eagle Lake 17 Rich Lake 14 Mountain View Lake 10
Loon Lake 17 Tripp Lake 14 Chazy Lake 8
Oven Mtn Pond 17 Twitchell Lake 14 Lower Chateaugay Lake 8 Silver Lake 17 Wolf Lake 14 Upper Chateaugay Lake 8
13th Lake 16 Balfour Lake 13 Chapel Pond 7
Brandreth Lake 16 Garnet Lake 13 Simon Pond 7
Eli Pond 16 Lens Lake 13 Lake Adirondack 6
Gull Pond 16 Lower Saranac Lake 13 Upper Cascade Lake 6 Little Long Lake 16 Lower St. Regis Lake 13 Amber Lake 5 Stony Creek Ponds 16 Snowshoe Pond 13 Augur Lake 5
Austin Pond 15 Spitfire Lake 13 Otter Pond 5
Cranberry Lake 15 Upper St. Regis Lake 13 Jordan Lake 5
Fern Lake 15 Canada Lake 12 Lake Titus 5
Middle Saranac Lake 15 Kiwassa Lake 12 Star Lake 5
Osgood Pond 15 Lake Colby 12 Lake Clear 4
Trout Lake 15 Raquette Lake 12 Lake Durant 4
White Lake 15 Sherman Lake 12 Lake Eaton (EC) 1
Arbutus Lake 14 Tupper Lake 12 Lake Placid 1
Catlin Lake 14 Indian Lake (HC) 11 Mill Pond 1
Deer Lake 14 Big Moose Lake 10 Mirror Lake 1
Hoel Pond 14 Dug Mnt. Pond 10 Paradox Lake 1
Lake of the Pines 14 Indian Lake (FC) 10 Schroon Lake 1
Adirondack Watershed Institute of Paul Smith’s College 2
Figure 1. Locations and names of lakes that participated in the Adirondack Lake Assessment Program (ALAP) in 2014.
Adirondack Watershed Institute of Paul Smith’s College 3
Table 2. Lake and watershed characteristics for Big Moose Lake.
Location County: Herkimer Latitude: 43.4902
Town: Old Forge Longitude: -74.5123
Lake Characteristics
Lake Area (ha): 499 Z-max (m): 21.3
Lake Perimeter (km): 32 Volume (m3): 36,400,000 Flushing Rate (T/Y): 2
Watershed Characteristics
Watershed Area (ha): 9,685 Residential (%): 0
Surface Water (%): 8 Agriculture (%): 0
Deciduous Forest (%): 60 Commercial (%): 0 Evergreen Forest (%): 4 Local Roads (km): 9.0 Mixed Forest (%): 9 State Roads (km): 0.0
Wetlands (%): 18
Methods
Big Moose Lake is located in the western Adirondacks (Figure 2) in Herkimer County in the Town of Webb (Table 2). The lake is 499 ha in surface area and has 32 km of shoreline. The maximum depth is 21.3 m, total volume is 36,400,000 m3, and the lake flushes about 2 times per year. The Big Moose Lake watershed is 9,685 ha, 8% of which is surface water. The watershed is dominated by forest cover, with 60% deciduous, 4% evergreen, and 9% mixed forests. The watershed contains 9.0 km of local roads (county, town, and local) and no state roads (state and US highways, Table 2.)
ALAP volunteers were trained by AWI staff in standard limnological sampling methods. Data was collected from the deepest location of the lake, 3 to 5 times during the summer months. During each sampling event volunteers observed the secchi transparency reading by lowering a standard 20 cm black and white secchi disk to a depth where it could no longer be seen. This process was repeated and the average secchi depth for that day was recorded. Surface water samples were collected using a 2 meter integrated tube sampler. The contents of the tube were poured into a 1 liter brown bottle and
thoroughly mixed. A 250 mL aliquot of the integrated sample was collected for chemical analysis and a second 250 mL aliquot was filtered through a 0.45 µm cellulose membrane filter for chlorophyll-a analysis. The filter was retrieved and wrapped in foil. The water sample and chlorophyll filter were frozen immediately after collection and delivered frozen to the AWI Environmental Research Lab, generally within a 10 day period.
Samples were analyzed for pH, conductivity, alkalinity, total phosphorus, nitrate, chlorophyll-a, chloride calcium and sodium at the AWI Environmental Research Lab following the analytical methods described in Appendix 1. Results for 2014 were tabulated and time series charts were constructed from the annual average value for each indicator. Trend analysis was conducted using Kendall’s non-parametric regression to test the hypothesis “there is no relationship between the indicator and time”. Simple linear trend lines were fit to data with significant trends (P<0.05) and displayed on the corresponding
Adirondack Watershed Institute of Paul Smith’s College 4
chart. Thus, absence of a line means there was no statistically significant trend in the indicator over time.
Average annual values for secchi disk transparency, total phosphorus, and chlorophyll-a were used to calculate Carlson’s Trophic Status Index, (TSI), a commonly used quantitative index for classifying lakes based on trophic status (Carlson 1977). TSI values are calculated as follows:
TSI (Secchi Disk) = 60 – 16.41xln[Secchi Disk (m)] TSI (Chlorophyll) = 30.6 + 9.81xln[Chlorophyll a(µg/L)]
TSI (Total Phosphorus) = 4.15 + 14.42xln[Total Phosphorus (µg/L)]
Typically TSI values are between 0 and 100. Lakes with TSI values less 40 are classified as oligotrophic, TSI values between 40 and 50 are classified as mesotrophic, and TSI values greater than 50 are classified as eutrophic. A detailed description of TSI values and likely lake attributes is found in Table 3.
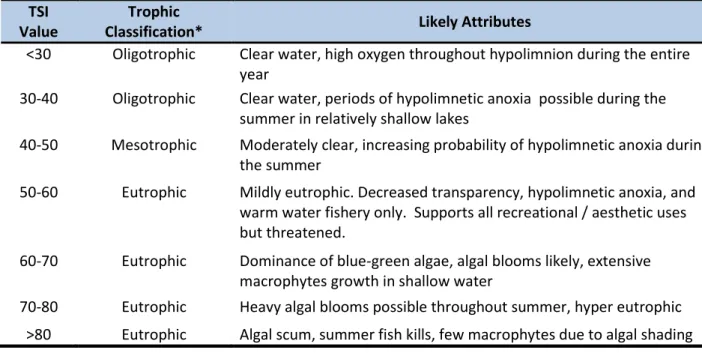
Table 3. Trophic classification of lakes based on Carlson's Trophic Status Index (TSI).
TSI Value
Trophic
Classification* Likely Attributes
<30 Oligotrophic Clear water, high oxygen throughout hypolimnion during the entire year
30-40 Oligotrophic Clear water, periods of hypolimnetic anoxia possible during the summer in relatively shallow lakes
40-50 Mesotrophic Moderately clear, increasing probability of hypolimnetic anoxia during the summer
50-60 Eutrophic Mildly eutrophic. Decreased transparency, hypolimnetic anoxia, and warm water fishery only. Supports all recreational / aesthetic uses but threatened.
60-70 Eutrophic Dominance of blue-green algae, algal blooms likely, extensive macrophytes growth in shallow water
70-80 Eutrophic Heavy algal blooms possible throughout summer, hyper eutrophic >80 Eutrophic Algal scum, summer fish kills, few macrophytes due to algal shading
Results and Discussion
The opening paragraph in each of the following sections provides basic background information for understanding the importance of each water quality indicator and interpreting data from the lake. The background paragraph is followed by a description of the results for the study lake as well as a
comparison to the other lakes in the ALAP. The 2014 water quality results for Big Moose Lake are tabulated in Table 5, frequency histograms of the water quality indicators for all participating ALAP lakes are displayed in Figure 2, and the historical trends for Big Moose Lake are plotted in Figures 3 and 4.
Adirondack Watershed Institute of Paul Smith’s College 5
Figure 2. Frequency histogram (bars) and cumulative percentage (plots) of 2014 water quality indicators for the 72 participating lakes. Figure is constructed with each lakes 2014 average.
Adirondack Watershed Institute of Paul Smith’s College 6
Transparency
Transparency is a measure of water clarity in lakes. It is measured by lowering a 20 cm black and white disk (Secchi disk) to the depth where it is no longer visible from the surface. The transparency of a lake is influenced by many factors, including algal abundance, turbidity, suspended sediments, and dissolved organic matter (Hutchinson 1957). Transparency can serve as an important indicator of overall trophic condition of a lake as well as influencing human perception of water quality. In general, lakes that have low productivity and low algal abundance have greater secchi transparencies. As algal productivity increases secchi depths become much shallower.
Transparency of Big Moose Lake ranged between 3.3 and 3.8 meters in 2014 (Table 4). The majority of lakes in the ALAP data set (69%) had a transparency less than that of Big Moose Lake (Figure 2). Over the 10 years of participation in ALAP, transparency has ranged from 2.9 to 7.5 meters with no
statistically significant trend detected(Figure 3). None of the participating ALAP lakes showed a positive trend in transparency over time, 11% showed a decreasing trend and 89% showed no trend in the data.
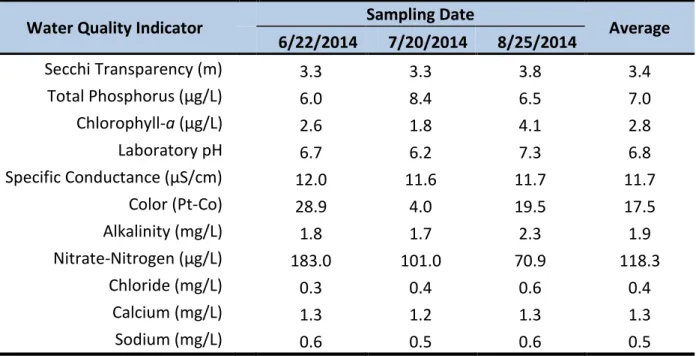
Table 4. Water quality indicators by sampling date and average for Big Moose Lake, 2014. BDL = Below detection level.
Water Quality Indicator
Sampling Date
Average
6/22/2014
7/20/2014
8/25/2014
Secchi Transparency (m)
3.3
3.3
3.8
3.4
Total Phosphorus (µg/L)
6.0
8.4
6.5
7.0
Chlorophyll-
a
(µg/L)
2.6
1.8
4.1
2.8
Laboratory pH
6.7
6.2
7.3
6.8
Specific Conductance (µS/cm)
12.0
11.6
11.7
11.7
Color (Pt-Co)
28.9
4.0
19.5
17.5
Alkalinity (mg/L)
1.8
1.7
2.3
1.9
Nitrate-Nitrogen (µg/L)
183.0
101.0
70.9
118.3
Chloride (mg/L)
0.3
0.4
0.6
0.4
Calcium (mg/L)
1.3
1.2
1.3
1.3
Sodium (mg/L)
0.6
0.5
0.6
0.5
PhosphorusPhosphorus is of major importance to structure and metabolism of all organisms. However, it exists in relatively small amounts in freshwater systems compared to other essential nutrients such as carbon, hydrogen, oxygen, and sulfur. The addition of extra phosphorus to an aquatic system allows production to increase greatly because all other essential elements are usually available in excess. Thus phosphorus is typically the limiting nutrient in aquatic systems (Schindler 1974, Wetzel 2001), and widely considered as the most important contributor to reduced water quality in lakes (Søndergaard et al. 2003). Natural weathering releases phosphorus from rocks and soils, and it also enters our watersheds in fertilizers,
Adirondack Watershed Institute of Paul Smith’s College 7
human waste, and atmospheric deposition. Phosphorus exists in a number of forms in aquatic systems, including readily available dissolved phosphorus, and organically and inorganically bound phosphorus. Total phosphorus is all of the forms of phosphorus combined and serves as an important indicator of overall trophic status of a lake. Generally speaking, lakes of low productivity (oligotrophic) have total phosphorus concentrations less than 10 µg/L, while highly productive lakes (eutrophic) have total phosphorus concentrations greater than 20 µg/L (NYS DEC assessment criteria).
Total phosphorus in the surface water of Big Moose Lake ranged from 6.0 to 8.4 µg/L and averaged 7.0 µg/L in 2014 (Table 4). The majority of ALAP lakes (77%) had an average concentration of total
phosphorus greater than that of Big Moose Lake (Figure 2). Historically, average total phosphorus concentrations have ranged from 4.2 to 19.0 µg/L with no apparent trend in the data (Figure 3). None of the participating ALAP lakes showed a positive trend in total phosphorus over time, 33 % showed a decreasing trend, and 67% showed no trend in the data.
Figure 3. The annual average values of epilimnetic trophic indicators of Big Moose Lake, 2004-2014. (A) Secchi disk transparency, (B) total phosphorus concentration, (C) chlorophyll-a concentration, and (D) Carlson's Trophic Status Index. Vertical bars represent one standard deviation of the mean. Significant trends (P≤0.05) are noted with a trend line.
Adirondack Watershed Institute of Paul Smith’s College 8
Chlorophyll-a
Chlorophyll-a is the primary photosynthetic pigment found in all species of algae, as well as cyanobacteria. A measurement of chlorophyll in a lake provides a surrogate measure of algal
productivity (Wetzel 2001). Chlorophyll-a is not a direct measure of algal biomass as the concentration of chlorophyll varies somewhat by species and environmental conditions. This said, increases in chlorophyll are generally associated with increased algal production, and the concentration of
chlorophyll is widely considered as the most direct measure of the trophic state of lakes. Algal biomass is affected by nutrient availability, water temperature, and light, so there can be considerable variation in chlorophyll concentrations throughout the year depending on which of these three factors is limiting growth at a particular time. Though, major changes in algal biomass (e.g. an algae bloom), and thus chlorophyll, are usually related to changes in the availability of phosphorus, nitrogen, silica or inorganic carbon (Wetzel 2001; Klemer 1990).
Chlorophyll concentration in Big Moose Lake ranged from 1.8 to 4.1 µg/L with an annual average of 2.8 µg/L (Table 4). The majority of ALAP lakes (60%) had annual average chlorophyll-a concentrations less than Big Moose Lake (Figure 2). Historically, the annual average concentration of chlorophyll-a has ranged from 1.1 to 6.5 µg/L with no apparent trend detected in the data (Figure 3). Two percent of the participating ALAP lakes showed a positive trend in chlorophyll over time, 11 % showed a decreasing trend, and 86% showed no trend in the data.
Trophic Status
Trophic status is a term derived from the Greek word trophi, meaning food or nourishment, and is used by limnologists to explain the overall productivity of a lake. Lake productivity is naturally influenced by the rate of nutrient supply from the watershed, climatic condition, and lake and watershed morphology. Human activities within a watershed have the potential to increase the rate of nutrient supply into the lake, and thereby accelerate algal productivity (cultural eutrophication).
Lakes are typically assigned into one of three trophic or productivity classes (oligotrophic, mesotrophic, eutrophic) based on total phosphorus, chlorophyll a, and Secchi transparency.
Oligotrophic - From the Greek words oligo, meaning few and trophi, meaning nourishment; oligotrophic lakes have low levels of available nutrients. As a result of low nutrients, oligotrophic lakes have high transparency, low algal abundance, low organic matter in the sediments, sparse aquatic plant growth, and abundant dissolved oxygen throughout the water column the entire year. Oligotrophic lakes are most likely to support a cold water fishery (Wetzel 2001).
Eutrophic - From the Greek words Eu, meaning good. Eutrophic lakes have abundant levels of nutrients. As a result of high nutrient availability eutrophic lakes are typified by high algal
productivity, low transparency, high organic matter in the sediments, and periods of anoxia in the bottom of the water column (hypolimnion). Eutrophic lakes tend to support dense aquatic plant growth in the littoral zone. Eutrophic lakes are unlikely to support a viable cold water fishery (Wetzel 2001).
Adirondack Watershed Institute of Paul Smith’s College 9
Mesotrophic - from the Greek words Meso, meaning the middle. Mesotrophic lakes are an intermediate trophic classification on the continuum between oligotrophy and eutrophy. The Carlson Trophic Status Index (TSI Index) is a common and valuable metric for evaluating the
productivity of a lake (Carlson 1977). The index is calculated by logarithmically converting the values of Secchi transparency, chlorophyll-a concentration, and total phosphorus to a scale of relative trophic state ranging from 0-100. TSI values less than 40 are considered oligotrophic, values between 40 and 50 are considered mesotrophic, and values grater that 50 are eutrophic (Table 3). Calculating the TSI scores from three trophic indicators allows further interpretation of productivity status of the lake.
The TSI Index for Big Moose Lake calculated with secchi transparency (42.3) and chlorophyll-a (40.3), indicated a mesotrophic status, while the TSI calculated from total phosphorus (32.0) suggested an oligotrophic classification for the lake. This type of disparity in TSI classification is typical of lakes experiencing phosphorus limitation. Historically the lake fluctuates around the oligotrophic-mesotrophic boundary (Figure 3).
pH
pH is a measurement of the concentration of hydrogen ions in water (acidity). Hydrogen ions are very active, and their interaction with other molecules affects the behavior of gasses, nutrients, and heavy metals and biological activity; thus pH is considered a master variable for its influence on chemical processes and aquatic life. pH exists on a logarithmic scale between 0 and 14. Because pH is logarithmic a decrease in 1 pH unit represents a 10 fold increase in hydrogen ion activity. Lakes are considered circumneutral when they have a pH between 6.5 and 7.5, while lakes with pH values less than 6.5 are considered acidic and those with pH values greater than 7.5 are considered basic. Lakes can become acidified when they are influenced by organic acids from soils, wetlands and bogs or when acidic precipitation falls on a poorly buffered watershed (Dodson 2005, Wetzel 2001). Acidity is also influenced by the time of day. For example, water samples taken during a bright sunny afternoon will often have elevated pH levels due to algal photosynthesis and the subsequent removal of carbon dioxide from the water (Dodson 2005). This natural process along with release of carbon dioxide by respiration means lake pH can fluctuate throughout the day.
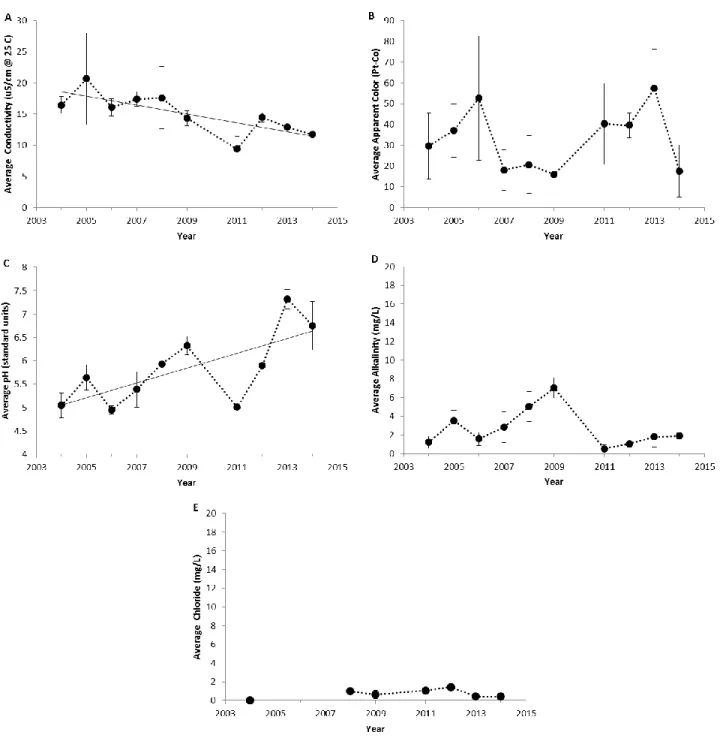
Big Moose Lake is a circumneutral water body. In 2014 the pH of the water samples showed little variation around the annual average of 6.8 pH units (Table 4). The majority of lakes in the ALAP data set (95%) had a pH lower than that of Big Moose Lake (Figure 2). Over the past 10 years of monitoring the pH of Big Moose Lake has ranged from 5.0 to 7.3 with a statistically significant increasing trend at a rate of 0.16 pH units/year (P=0.032, Figure 4). Three percent of the participating ALAP lakes showed a positive trend in pH over time, none of the lakes showed a decreasing trend, and 97% showed no trend in the data.
Alkalinity
Alkalinity (or acid neutralizing ability) measures the buffering capacity of a lake, which is the ability of the lake to resist a change in pH. High alkalinity lakes are well buffered against changes in pH, while low alkalinity lakes are poorly buffered against changes in pH. Thus, a high alkalinity lake would have a more
Adirondack Watershed Institute of Paul Smith’s College 10
stable pH compared to a low alkalinity lake, and a more stable pH is less stressful to aquatic life. The carbonate system provides acid buffering through two alkaline compounds: bicarbonate (HCO3-) and
carbonate (CO3=). These two compounds are typically found in association with calcium or magnesium.
Lakes with less than 10 mg/L calcium carbonate are sensitive to acidification, while lakes with greater than 20 mg/L calcium carbonate are not sensitive to acidification (Godfrey et al. 1996).
Big Moose Lake has low acid neutralizing ability. In 2014 the alkalinity ranged from 1.7 to 2.3 mg/L and averaged 1.9 mg/L as calcium carbonate (Table 4). The majority of the participating ALAP lakes (90%) had an alkalinity greater than Big Moose Lake (Figure 2). Historically, the alkalinity of the lake has varied greatly with a range between 0.5 to 7.1 mg/L with no statistical trend apparent in the data (Figure 4). None of the participating ALAP lakes showed a positive trend in alkalinity over time, 29% of the lakes showed a decreasing trend, and 70% showed no trend in the data.
Color
The observed color of a lake is an optical property that results from light being scattered upwards after selective absorption by water molecules as well as dissolved (metallic ions, organic acids) and suspended (silt, plant pigments) materials . For example, alkaline lakes with high concentrations of calcium
carbonate scatter light in the green and blue wavelength and thus appear turquoise in color. Lakes rich in dissolved organic matter and humic compounds absorb shorter wavelengths of light such as green and blue and scatter the longer wavelengths of red and yellow, thus these lakes appear to be brown in color (Wetzel 2001). Thus analysis of color can provide us with information about the quantity of dissolved organic material in the water. For objective quantification of apparent color we compare water samples to standards of platinum-cobalt solution. (Pt-Co units).
Apparent color values from Big Moose Lake ranged from 4.0 to 28.9 Co units, and averaged 17.5 Pt-Co units in 2014 (Table 4). The majority of ALAP lakes (55%) had greater color to the water than Big Moose Lake (Figure 2). Over the period of ALAP participation, the color value of the lake has ranged between 16.0 to 57.3 Pt-Co units with no statistical trend detected in the data (Figure 4). Eleven
percent of the participating ALAP lakes showed a positive trend in color over time, none of the lakes showed a decreasing trend, and 89% showed no trend in the data.
Conductivity
Pure water is a poor conductor of electricity. The ability of water to conduct electricity increases as the concentration of dissolved ions in the water increases. Thus, conductivity is considered a strong indicator of the amount of dissolved ions in water. Typically the conductivity of a clean undeveloped lake in the Adirondacks is in the range of 10-25 µS/cm. Elevated conductance may be indicative of road salt pollution, faulty septic systems or the influence of bogs and wetlands in the watershed.
Conductivity is a very useful surrogate when the relationships between ion concentrations and conductivity are known. For example, conductivity can be used to estimate sodium and chloride concentrations in streams (Daley et al. 2009).
Conductance values of Big Moose Lake exhibited little variation around the annual average value of 11.7 µS/cm (Table 4). The majority of ALAP lakes (98%) had higher conductance values than Big Moose Lake
Adirondack Watershed Institute of Paul Smith’s College 11
(Figure 2). Historically, the conductivity of the lake has ranged from 16 to 57 µS/cm with a statistically significant decreasing trend at a rate of 0.7 µS/cm/yr (P=0.012,Figure 4). Three percent of the
participating ALAP lakes showed a positive trend in conductivity over time, 22% of the lakes showed a decreasing trend, and 75% showed no trend in the data.
Figure 4. The annual average values of water quality indicators of Big Moose Lake, 2004-2014. (A) Specific lab conductivity @ 25 C, (B) apparent color, (C) pH, (D) total alkalinity, and (E) chloride. Vertical bars represent one standard deviation of the mean. Significant trends (P≤0.05) are noted with a trend line.
Adirondack Watershed Institute of Paul Smith’s College 12
Sodium and Chloride
Non-impacted Lakes in the Adirondack region have naturally low concentrations of sodium and chloride, with average background concentrations of 0.5 mg/L and 0.24 mg/L respectively. However, wide spread use of road deicers (primarily sodium chloride) has significantly increased the concentration of these chemicals in lakes that have salted roads in their watersheds (Kelting et al 2012). Sodium and chloride can have negative effects on aquatic life when at high concentrations (Corsi et al. 2010), and can impart an undesirable taste to drinking water. The US EPA has a drinking water guideline of 250 mg/L for chloride and 20 mg/L for sodium, but these are not enforceable standards.
Average concentrations in Big Moose Lake during 2014 were 0.5 mg/L for sodium and 0.4 mg/L for chloride (Table 4). The concentrations of these chemicals are within the range we would expect for a watershed with limited roads and light shoreline development. The majority of ALAP lakes had higher concentration of chloride (80%) and sodium (94%) than Big Moose Lake (Figure 2). Chloride
concentrations generally ranged between below detection to 1.4 mg/L in Big Moose Lake with no apparent trend detected in the historical data (Figure 4). Historical trend analysis of sodium was not performed.
Calcium
Calcium is an essential element for plant growth, but is generally considered a micronutrient in
freshwater systems (needed by organisms in tiny amounts, Wetzel 2001). Some organisms, such as shell producing mollusks, require larger amounts of calcium to establish a population. Calcium is derived from the weathering of calcium bearing bedrock, such as limestone and dolomite. The majority of the bedrock in the Adirondack region is comprised of granite, and thus offers little in the way of calcium to the watershed. Calcium concentration is a good indicator of the overall habitat suitability for the zebra mussel, a non-indigenous species from Eurasia that has been spreading through North America and transforming food webs and biochemical cycles in freshwater systems since 1988 (Strayer 2009). Researchers have reported minimum calcium concentrations ranging from 8-20 mg/L to support a viable zebra mussel population (Cohen 2004).
Calcium concentration in Big Moose Lake varied little from the annual average of 1.3 mg/L, well below the reported threshold ranges for the zebra mussel. The majority of ALAP lakes (97%) have calcium concentrations higher than that of Big Moose Lake. Historical trend analysis was not performed for calcium.
Adirondack Watershed Institute of Paul Smith’s College 13
Literature Cited
Bertram, P. E. 1990. Total phosphorus and dissolved oxygen trends in the central basin of Lake Erie, 1970–1991. 19:224-236.
Carlson, R.E. 1977. A trophic state index for lakes. Limnology and Oceanography, 22(2):361-369. Cohen, A. 2004. Calcium requiems for the spread of the zebra mussels. California Sea Grant, Coastal
Ocean Research, San Francisco Estuary Institute. 2p.
Corsi, S.R., Graczyk, D.J., Geis, S.W., Booth, N.L., and Richards, K.D. 2010. A fresh look at road salt: aquatic toxicity and water quality impacts on local, regional, and national scales. Environmental Science and Technology, 44(19):7376-7382.
Daley, M.L., J.D. Potter, and W.H. McDowell. 2009. Salinization of urbanizing New Hampshire streams and groundwater: effects of road salt and hydrologic variability. Journal of the North American Benthological Society, 28(4):929–940.
Dodson, S.I. 2005. Introduction to Limnology. McGraw Hill, New York. 400pp.
Driscoll, C.T., K.M. Driscoll, M.J. Mitchell, and D.J. Raynal. 2003. Effects of acidic deposition on forest and aquatic ecosystems in New York State.Environmental Pollution, 123:327–336.
Godfrey, P.J., M.D. Mattson, M.-F. Walk, P.A. Kerr, O.T. Zajicek, and A.Ruby III. 1996. The Massachusetts Acid Rain Monitoring Project: Ten Years of Monitoring Massachusetts Lakes and Streams with Volunteers. Publication No. 171. University of Massachusetts Water Resources Research Center.
Hutchinson, G. E. 1957. A Treatise on Limnology. Vol. 1. Geology, Physics, and Chemistry. John Wiley and Sons, New York. 1015pp.
Kelting, D.L., C.L. Laxson, E.C. Yerger. 2012. A regional analysis of the effect of paved roads on sodium and chloride in lakes. Water Research, 46(8):2749-2758.
Klemer, A.R. 1991. Effects of nutritional status on cyanobacterial buoyancy, blooms, and dominance, with special reference to inorganic carbon. Canadian Journal of Botany, 69: 1133-1138.
Schindler, D.W. 1974. Eutrophication and recovery in experimental lakes: implications for lake management. Science 184:897-899.
Søndergaard, M., J.P. Jensen, and E. Jeppesen. 2003. Role of sediment and internal loading of phosphorus in shallow lakes. Hydrobiologia, 506-509:135-145.
Spoor, W. A. 1990. Distribution of fingerling brook trout, Salvelinus fontinalis, in dissolved oxygen concentration gradients. Journal of Fish Biology 36: 363-373.
Strayer, D. L. 2008. Twenty years of zebra mussels: lessons from the mollusk that made headlines. Frontiers in Ecology and the Environment 7: 135-141.
Wetzel, R.G. 2001. Limnology, Lake and River Ecosystems, 3rd Edition. Academic Press, New York. 1006pp.
Adirondack Watershed Institute of Paul Smith’s College 14
Appendix 1. Analytical methods performed on ALAP samples at the AWI
Environmental Research Lab.
Analyte Method Description Reference
Lab pH Mettler Toledo standard pH electrode APHA Conductivity Conductivity at 25° C via Mettler Toledo conductivity cell APHA 2510 B Apparent Color Single wavelength method with PtCO standards APHA 2120 C Chlorophyll-a Trichromatic method uncorrected for phaeophyton APHA 10200 H Total Phosphorus Acid-persulfate digestion, automated ascorbic acid reduction APHA 4500-P H Nitrate + Nitrite Automated cadmium reduction APHA 4500-NO3 I
Alkalinity Automated methyl orange method EPA 301.2 Chloride Automated ion chromatography EPA 300.0 Calcium and