Invasion genetics of Ponto-Caspian gobies in the Great Lakes: a ‘cryptic’
species, absence of founder effects, and comparative risk analysis
Carol A. Stepien
1,2,* & Mark A. Tumeo
2,3 1Great Lakes Genetics Laboratory, The Lake Erie Center, The University of Toledo, 6200 Bayshore Road, Oregon, OH 43618, USA;2Cleveland State University Program of Excellence in Environmental Risk Analysis, Center for Environmental Science, Technology and Policy, Cleveland State University, 2121 Euclid Avenue, Cleveland, OH 44115, USA;3Office of Sponsored Programs and Research, Cleveland State University, 2121 Euclid Avenue, Cleveland, OH 44115, USA; *Author for correspondence (Great Lakes Genetics Laboratory, The Lake Erie Center, The University of Toledo, 6200 Bayshore Road, Oregon, OH 43618, USA (e-mail: [email protected]; fax: +1-419-530-8399)
Received 1 January 2004; accepted in revised form 27 August 2004
Key words:cytochromeb, exotic species, founder effect, Great Lakes,Neogobius, nonindigenous, Ponto Caspian,Proterorhinus, risk analysis, round goby, tubenose goby
Abstract
Genetic variability and structure of nonindigenous vs native populations are compared for the Eurasian round goby Neogobius melanostomus and the tubenose goby Proterorhinus marmoratus,
which both invaded Lake St. Clair of the North American Great Lakes about 1990. The round goby spread rapidly to all of the Great Lakes and the tubenose goby largely has been restricted to Lake St. Clair, with some recent range extension into western Lake Erie. Risk analyses may indicate whether genetic variability of colonizers is predictive of their relative invasive and establishment successes. The present investigation examined DNA sequence variation across the left domain of the mitochondrial DNA cytochrome b gene in round and tubenose gobies from Eurasian and Great Lakes locations. We also sequenced six additional Neogobius species (including the monkey
N. fluviatilis, racer N. gymnotrachelus, and bighead N. kessleri gobies that have been ‘on the move’ in Europe) and the knout goby Mesogobius batrachocephalus from the Black Sea in order to develop diagnostic genetic characters to identify them in case of future and/or undetected invasions and to delineate their phylogenetic relationships. Results show that a diverse number of haplotypes charac-terize round and tubenose goby populations from both North America and Eurasian sites, fitting a risk analysis prediction of high genetic variability in their successful introductions. Phylogenetic results indicate that the current genus Neogobius is paraphyletic and that the subgenus Apollonia
thus should be elevated to the level of genus, containing Apollonia (N.) melanostomus (the round goby) and A. (N.) fluviatilis (the monkey goby). In addition, there appear to be two separate species of Proterorhinus marmoratus, a marine P. marmoratus Pallas 1814 in the Black Sea (matching the original type locality), and a ‘cryptic’ freshwater species in the Danube and Dnieper Rivers and probably other Eurasian freshwater habitats, as well as invasive in the Great Lakes. We suggest resurrecting the name P. semilunaris Heckel 1837 for the freshwater species (a taxon that was origi-nally described from rivers draining into the Aegean Sea and the Danube River, but was later placed in synonymy with P. marmoratus).
Introduction
Identifying nonindigenous species often is prob-lematic – since many come from diverse taxonomic groups and areas of the world that have been little studied using modern phyloge-netic systematic methodology. DNA sequence tools now allow us to develop diagnostic charac-ters for identifying species, elucidating their founding populations, and determining whether variants belong to ‘cryptic’ taxa. DNA sequence comparisons between native and invasive popula-tions also are important for interpreting whether new colonizations arise from spread or from independent introductions, testing how many source populations were introduced, evaluating the extent of founder effects in new populations, as well as making valid ecological comparisons.
The genetic composition of an exotic popula-tion is believed to be fundamental to its success (Williamson 1996). High genetic variability appears positively correlated with an exotic pop-ulation’s ability to invade, become established, and adapt to new habitats (Williamson 1996; Garcia-Ramos and Rodriguez 2002; Stepien et al. 2002). However, invasive populations tradition-ally have been believed to be characterized by low genetic diversity, due to founder effects and bottlenecks (Williamson 1996; Holland 2000). Low genetic variability in new populations would be especially apparent in the mitochondrial gen-ome (as examined here) due to its smaller effec-tive population size, more rapid extinction of lineages, and lack of recombination (Avise 2000). Analyses that compare the levels of genetic diver-sity, as well as the number and proportion of shared genotypes, between founding source and invasive populations allow us to interpret the role of genetic variability governing invasive success (Stepien et al. 2002).
In addition, genetic data also may provide important evidence for evaluating and comparing the invasive ‘risk’ of a given species. Risk analy-sis as applied to invasive species is a complex process. In summary, the process involves first identifying the events that are likely to lead to the establishment, spread, persistence, and con-tinued growth of invasive populations – then estimating the likelihood, or probability, of these
events. As applied to an examination of the risk of a non-indigenous species invasion, this means determining what level of genetic variability, spe-cific genetic composition, number of individuals introduced, and number of founding source populations will result in relative invasive suc-cess. Once the hazard is identified and its proba-bility of occurrence quantified, the consequence of the event must be calculated (in this case, the impact on the native ecosystem and environ-ment). The combination of the probability of the event and the consequence of the event should it occur constitutes the vulnerability or ‘risk’. Once risk is identified and quantified, then risk man-agement options can be considered. These actions then could be implemented to prevent the inva-sion or subsequent spread of an invasive species once it is introduced.
The risk of nonindigenous species invasions appears particularly high from some particular donor ecosystem regions to specific recipient eco-system areas, which may result in ‘waves’ of invasions. For example, the Eurasian Ponto-Cas-pian donor region (Figure 1) has provided many exotic species to the North American Great Lakes over the past 20 years via accidental ballast water introductions. Examples of Great Lakes invasions by Ponto-Caspian taxa include the dreissenid zebra and quagga mussels, as well as the round and tubenose gobies examined here (Mills et al. 1993; Ricciardi and MacIsaac 2000; Grigorovich et al. 2002). Their successful establishment may be attributed to common vector pathways (in this case, shipping routes and ballast water exchange practices; MacIsaac et al. 2001), high number of introduced propagules from native areas with sim-ilar habitats for source and sink populations, facilitative interactions among co-evolved invaders – such as round gobies eating zebra mussels (Ghedotti et al. 1995; Simberloff and Van Holle 1999; Ricciardi and MacIsaac 2000), and relatively high genetic diversity – as tested here and sug-gested by previous work (Dillon and Stepien 2001; Stepien et al. 2002, 2003).
Following the zebra mussel’s appearance in 1988, two members of the Ponto-Caspian subfamily Neogobiinae – the round goby Neogo-bius melanostomus and the tubenose goby
Clair in 1990 (Crossman et al. 1992). Like the zebra mussel, the round goby rapidly spread to all five Great Lakes and is now one of the most abundant benthic species (Jude 1997, 2001). The round gobyN. melanostomus has been more suc-cessful at spreading to new habitats in North America and Eurasia and is much more common than is the tubenose gobyP. marmoratus in both regions (Holcik 1991; Charlebois et al. 1997). Models for predicting invaders (Kolar and Lodge 2001, 2002; Muller 2001) find that congeners with histories of invasions are more likely to invade together or in close sequence (as for neogobiins).
The round and tubenose gobies belong to the species-rich but poorly known subfamily Neogo-biinae (Simonovic 1999), which is native to the Ponto-Caspian region (including the Marmara, Black, Azov, Caspian, and Aral Seas; Figure 1). The Neogobiinae comprises about 18 species in three genera (Neogobius, Mesogobius, and
Proterorhinus) (see Table 1). Research collections by C. Stepien along the northern Black Sea, Crimean Coast, and Sea of Azov in 2002 com-monly found four to seven sympatric neogobiin species in given native locations. Neogobiins are highly adaptable to a variety of habitats, making them excellent invaders (Charlebois et al. 1997; Ahnelt et al. 1998). Several other neogobiin
spe-cies, including the monkey goby N. fluviatilis, the bighead goby N. kessleri, and the racer goby
N. gymnotrachelus have been ‘on the move’ in Eurasian waterways, due to the construction of canals, shipping, and habitat disturbances (Holcik 1991; Ahnelt et al. 1998; Kvach 2001; Kautman 2001). It thus appears likely that addi-tional neogobiin species will invade North Amer-ica from common shipping ports, or are already ‘cryptically’ present – but not yet identified. DNA sequence markers will enable their correct and rapid identification if and when they invade.
The objectives of the present study were to: (1) develop DNA markers for distinguishing among neogobiin species, (2) test for ‘cryptic’ invasive taxa, (3) determine whether the existing taxo-nomic classifications are systematically correct, (4) compare genotypic composition and levels of genetic variability in the invasive Great Lakes versus native populations, and (5) evaluate the use of these genetic data for risk assessment of invasive species.
Materials and methods
Specimens were collected either by hook-and-line or netting, measured and identified, and then
placed directly in 95% ethanol and stored at room temperature. Round gobies analyzed totaled 87 specimens (Table 2), including: 22 from Lake Erie, Ohio, USA; 29 from Lake St. Clair, Michigan, USA (sequenced and origi-nally analyzed by Dougherty et al. 1996); nine from the Danube River at Vienna, Austria; 23 from the Danube River at Prahovo, Yugosla-via; five from the northern Dnieper River at Kiev, Ukraine; 15 from the western Black Sea at Varna, Bulgaria (sequenced and originally ana-lyzed by Dougherty et al. 1996); two from the north-central Black Sea at Odessa, Ukraine; and five from the north-east Black Sea location at Sevastopol, Ukraine (Figure 1). The latter two sampling sites (Odessa and Sevastopol) were grouped in the analyses. Two of the specimens of round gobies from Lake Erie did not have the characteristic dorsal fin spot, and were possible monkey goby (N. fluviatilis) suspects.
A total of 44 tubenose goby specimens were analyzed (Table 2), including 11 from the Lake St. Clair region (two of which had been previously sequenced by Dougherty et al. 1996); three from the Danube River at Prahovo, Yugo-slavia; one from the Dniester River at Biliaivka, Ukraine; five from the Dnieper River at Kiev, Ukraine; six from the Tyligul River estuary north of Odessa, Ukraine in the north-central Black Sea area; 10 from the north-central Black Sea at Odessa, Ukraine; and six from the northeastern Black Sea site at Sevastopol, Ukraine (Figure 1). The Sevastopol site collection was made by Step-ien at the type locality of the original description of the tubenose goby Proterorhinus marmoratus
(Pallas 1814 and California Academy of Sciences website 2004), rendering it an important bench-mark systematic comparison.
DNA sequence data were collected for seven additional related taxa for the purpose of
Table 1. Taxonomic status of the neogobiinae examined in the present study (status based on Simonovic 1999; Froese and Pauly
2004; and the California Academy of Sciences 2004).
Genus Species Described by Common name Distribution and habitat Name change proposed by these results
Mesogobius batrachocephalus Pallas (1814) Knout goby Brackish water; Black and Azov
Seas and estuaries
–
Neogobius cephalarges Pallas (1814) Ginger goby Fresh and brackish water; Black
and Azov Seas
–
N. fluviatilisa Pallas (1814) Monkey goby Fresh and brackish; rivers entering
Black and Caspian Seas
Apollonia fluviatilis
N. gymnotrachelusa Kessler (1857) Racer goby Fresh and brackish; nw Black
and Azov Seas and Dniester R, invasive in Danube R.
–
N. kessleria Gunther (1861) Bighead goby Fresh and brackish; n. Black Sea
and rivers, invasive in Danube R. –
N. melanostomusa Pallas (1814) Round goby Freshwater, prefer brackish; Black,
Azov, Caspian and Marmora Seas and rivers; many introduced sites, e.g., Gulf of Gdansk, upper Danube R. and Great Lakes
Apollonia melanostomus
N. ratan Nordmann 1840 ratan goby Black Sea, near Odessa, Ukraine –
N. syrman Nordmann 1840 Syrman goby Brackish and marine; Black
and Azov Seas
–
Proterorhinus marmoratus Pallas 1814 Marine
tubenose goby
Brackish and marine and estuaries; Black, Azov and Caspian Seas
–
Proterorhinus marmoratusa Pallas (1814) Freshwater
tubenose goby
Freshwater rivers; Native to the Danube, Dniester, and Dnieper Rivers (and possibly others) of the Ponto-Caspian region; introduced to Great Lakes
P. semilunaris
Heckel 1837
elucidating the correct phylogenetic relationships for the targeted species, as well as to develop diagnostic sequences for identifying possible ‘cryptic’ invasive neogobiin species in the Great Lakes and other regions (Table 1). These additional taxa included two specimens each of the ginger goby Neogobius cephalarges, mon-key goby N. fluviatilis, racer goby N. gymnotra-chelus, bighead goby N. kessleri, ratan goby N. ratan, syrman goby N. syrman, and knout goby
Mesogobius batrachocephalus. All specimens were collected from the Danube, Dniester, and/or Dnieper rivers draining into the Black Sea, Ukraine and the Black Sea (the sites in Figure 1).
Genomic DNA was extracted from muscle tissue and purified using the DNeasy tissue kit and protocol (Qiagen, Inc., Valencia, CA). We amplified the mitochondrial DNA cytochrome b
gene from neogobiin gobies (1150 bp), and here report on sequence data from 453 bp of the left domain. We relate our data with those previously published by Dougherty et al. (1996) on the same DNA region for two tubenose goby specimens from Lake St. Clair and for 37 round gobies
from Lake St. Clair and the western Black Sea at Varna, Bulgaria (Figure 1). The cytochrome b
gene codes for a transmembrane protein func-tional in the electron transport chain of cellular respiration in mitochondria, and has been widely used in fish population genetic and species rela-tionship studies (reviewed by Stepien and Kocher 1997). Variation at these lower taxonomic levels, as analyzed in the present study, is largely found in the third codon ‘wobble’ position (reviewed in Palumbi 1997; Stepien and Kocher 1997).
The cytochromeb gene was amplified using the polymerase chain reaction (PCR), with conserved primers adapted from Dougherty et al. (1996), including Gludg-L14724 (Meyer et al. 1990), H15149 (Kocher et al. 1989), and CB6Thr-H
(Mar-tin et al. 1992). PCR parameters included 1 min denaturation at 94 °C, 30 s annealing at 50°C, and 2 min extension at 72°C, for 38 cycles, followed by a final extension step for 5 min. The PCR products were purified using Exosap kits (U.S. Biochemical Corp., Inc., Solon, OH). DNA sequencing reac-tions were performed separately in both direcreac-tions (for independent verification) using the PCR
prim-Table 2. Sampling locations and haplotype frequencies for comparative study of variation in the mtDNA cytochromebgene in the
round and tubenose gobies.
Species Body of water Location Latitude Longitude nfish Haplotype(s) and relative frequencies
N. (A.) melanostomus
Round goby
Lake St. Clair near Detroit, MI, USA
42°220N 82°390W 29* 22A, 5B, 2C, 0.76A, 0.17B,
0.07C Lake Erie South Bass
Island, OH, USA
41°500N 83°000W 22 11A, 9B, 1C, 1F, 0.50A, 0.40B,
0.05C,0.05F Danube River Vienna, Austria 48°130N 16°220E 23 9A 1.00A
Danube River Prahovo, Yugoslavia
44°170N 22°350E 19 22A, 1B, 0.96A, 0.04B
n. Dnieper River Kiev, Ukraine 50°270N 30°300E 5 5A, 1.00A
w. Black Sea Varna, Bulgaria 43°140N 27°580E 15* 13A,1D,1E 0.86A, 0.07D, 0.07E
n. c. Black Sea Odessa, Ukraine 46°280N 30°440E 2 2A, 1.00A
n. e. Black Sea Sevastopol, Crimea, Ukraine
44°340N 33°340E 5 4A, 16 0.80A, 0.206 Proterorhinus
Tubenose goby
Lake St. Clair near Detroit, MI, USA
42°220N 82°390W 11* 6A, 3B, 2C 0.55A, 0.27B, 0.18C
Danube River Prahovo, Yugoslavia
44°170N 22°350E 3 1A, 2C 0.33A, 0.67C
Dniester River Biliaivka, Ukraine 46°280N 30°130E 1 1A 1.0A
Dnieper River Kiev, Ukraine 50°270N 30°300E 5 3B, 1C, 1D 0.60B, 0.20C, 0.20D
n.c. Black Sea Tyligul estuary, Ukraine
46°500N 31°100E 6 1G, 4H, 1J 0.17G, 0.66H, 0.17J
n.c. Black Sea Odessa, Ukraine 46°280N 30°440E 10 7E, 3F 0.70E, 0.30F
n.e. Black Sea Sevastopol, Crimea, Ukraine
44°340N 33°340E 6 3E, 3I 0.50E, 0.50I
ers and cycle sequencing, following manufacturer’s directions (CEQ DTCS kits, Beckman-Coulter, Inc., Fullerton, CA). Sequences were determined using a Beckman-Coulter CEQ 8000 capillary autosequencer at the Cleveland State University DNA Analysis Facility. Sequences were aligned using Se-Al: Sequence Alignment Editor (Rambaut 1996) and manual adjustments were made employ-ing amino acid alignments and parsimonious pro-cedures.
Phylogenetic relationships among neogobiins were analyzed from 453 bp of the left domain of the cytochrome b gene using maximum parsi-mony and a branch-and-bound search in PAUP* 4.0 vers. B10 (Swofford et al. 1996; Swofford 2003), with the Mediterranean gobies
Gobius niger and Zosterisessor ophiocephalus
(belonging to the putative ‘sister’ group, Gobii-nae; Simonovic 1999) designated as outgroups (and also sequenced by us). Relative support of the data set for relationships were evaluated using 1000 bootstrap replications (Felsenstein 1985) and a branch-and-bound search (Swofford et al. 1996). Multiple most-parsimonious trees were evaluated using strict and 50% majority rule consensus analyses (Margush and McMor-ris 1981; see Swofford et al. 1996). Kimura (1980) two-parameter genetic distances were cal-culated between each pair of taxa, clustered using the neighbor-joining (Saitou and Nei 1987) algorithm, and evaluated with 1000 boot-strap replications in MEGA vers. 2.1 (Molecular Evolutionary Genetics Analysis; Kumar et al. 2001).
Comparative measures of genetic variability for sampling sites included gene diversity= haplotypic diversity (h), nucleotide diversity (p), and the mean number of pairwise differences among haplotypes (all following Nei 1987), cal-culated in Arlequin 2.2 (Schneider et al. 2003). Relationships among population sites for the round and tubenose gobies, respectively, were evaluated using Wright’s (1978) Fst analog estimates and corresponding probability values (from 1000 permutations). Global tests of differentiation between pairs of samples were determined following Raymond and Rousset (1995), based on an exact nonparametric proce-dure and probabilities estimated using the Mar-kov chain method. This method should yield
similar results to the Fstdivergence values. Com-parative population sizes (h) between pairs of sampling sites and probability values for significant differences were estimated following Gaggiotti and Excoffier (2000). Hierarchical partitioning of genetic variation (% Variance) among groups of populations, population sam-ples within groups, and variation within sampling sites were evaluated using Analysis of Molecular Variance (AMOVA) in Arlequin 2.2 (Schneider et al. 2003). Migration estimates (Nm) between sampling sites were calculated according to Slat-kin (1995).
We compared the results from this study with earlier results obtained by the Stepien laboratory from some of the populations of round and tube-nose gobies using mtDNA control region sequences (Dillon and Stepien 2001). We related our genetic data findings to risk analysis using the elements developed by the Aquatic Nuisance Species Task Force (ANSTF 1996; summarized in Nicholls and Tumeo 2001).
Results
Phylogenetic relationships of Neogobiins and distinguishing genetic markers
DNA sequences from 453 bp of the left domain of the mtDNA cytochrome b gene generated species-specific characters, which can be used to identify them at all life history stages. Seq-uences are deposited in the NIH GenBank (http:// www.ncbi.nlm.nih.gov/Taxonomy/taxonomyhome. html/) as Accession numbers AY884588 for the ginger goby N. cephalarges, AY884589 for the monkey goby Neogobius (to be changed to
Apollonia; see further Results and Discussion)
fluviatilis, AY884589 for the racer goby N. gymnotrachelus, AY884587 for the bighead goby N. kessleri, AY884585 for the ratan goby
N. ratan, AY884586 for the syrman goby (N. syrman), and AY884590 for the knout goby
Mesogobius batrachocephalus. In addition, hapl-otypes A-J for the tubenose goby were deposited in GenBank as Accession numbers AY884572–884581. Haplotypes A–D number AY884572–884575 (with A as AY885472 corre-sponding to A in Dougherty et al. 1996) and
constitute the freshwater clade. Haplotypes E–J number AY884576–884581 and include the marine and estuarine P. marmoratus. Haplotypes F and G for the round goby N. (to be changed to Apollonia here; see further Results and Dis-cussion) melanostomus are Accession numbers AY884582–3. Haplotypes A for P. marmoratus
(to be designated as P. semilunaris; see further Results and Discussion) and A–E for N. (now
Apollonia) melanostomus were previously depos-ited in GenBank by Dougherty et al. (1996). In addition, cytochrome b gene sequences for the gobiin outgroup species the black goby Gobius niger and the grass goby Zosterisessor ophioceph-alus were deposited by us as GenBank Accession numbers AY884591 and AY884592, respectively.
Phylogenetic relationships among 22 taxa; including seven haplotypes of the round goby
Neogobius (to be changed to Apollonia)
melanostomus, six haplotypes of tubenose goby
Proterorhinus, seven other neogobiin species (see Table 1), and two outgroups; from maximum
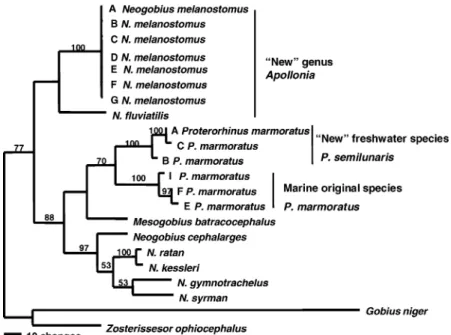
parsimony analysis using a branch-and-bound search revealed two most parsimonious trees (Figure 2). The trees had 493 steps and 148 vari-able characters were parsimony-informative. Three primary clades were revealed: (1) N. ðA.Þ
melanostomus as the sister group to N. ðA.Þ flu-viatilis, which in turn forms the sister group to all remaining Neogobiinae, including; (2) Prote-rorhinus (with Mesogobius batracocephalus
located intermediate between clades 2 and 3, and the relationships between those genera were unre-solved between the two most-parsimonious trees), and (3) the remaining Neogobius species; with N. cephalarges as the basal taxon, and N. ratanand
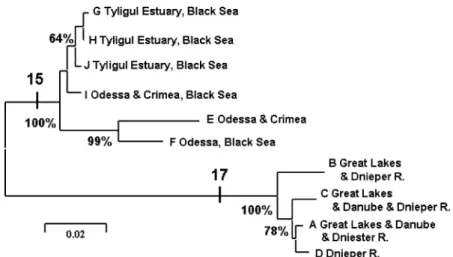
N. kessleri as the sister group to a clade compris-ing N. gymnotrachelus and N. syrman. Results indicated that the neogobiin genus Neogobius is paraphyletic, consisting of two separate clades that are not each other’s sister group (see Fig-ure 2). The neighbor-joining tree (Figure 3) details genetic distance relationships among the
Proterorhinushaplotypes.
Figure 2. Consensus of two most-parsimonious trees of neogobiin relationships from partial cytochromebsequences using PAUP*
branch-and-bound search and 1000 bootstrap replications (numbers at nodes). (Swofford 2003; 453 bp). 493 steps, CI¼0.68, RI¼0.75, CI excluding uninformative characters¼0.56, 148 parsimony informative characters. Taxa names to the right of the vertical bars are proposed name changes based on our results. Note:Neogobiusis paraphyletic, indicating that the subgenus Apollo-niashould be elevated to includeN.ðA.ÞmelanostomusandN. (A.) fluviatilis. Tree discerns two putative species forP. marmoratus –the top clade is the ‘new/to be resurrected’ freshwater species (defined by 15 synapomorphies) and the bottom clade is marine (including the type locality of Sevastopol, Crimea, Black Sea; defined by 17 synapomorphies). Additional haplotypes ofP.
A ‘cryptic’ species of tubenose goby
Our results showed that the tubenose goby
Proterorhinus marmoratusas presently recognized comprises two genetically divergent species (Fig-ures 2 and 3). Haplotypes A–D (found in Lake St. Clair of the Great Lakes and eastern Euro-pean rivers that drain into the Black Sea) signifi-cantly diverged from a clade comprising haplotypes E–J (found in the Black Sea and its brackish estuaries) (Figure 3). The marine taxon (E–J) was characterized by 15 nucleotide synapo-morphies, and the freshwater taxon (A–D) had 17 synapomorphies.
The two tubenose goby species each had two to three haplotypes per sampling location. All locations samples had similar gene diversity val-ues (Table 3A). The freshwater and marine clades diverged significantly in Fst (Table 4) and global differentiation tests (Tables 4 and 5), and 71% of the overall AMOVA variation in the group was found between the two clades (P< 0.0001). Together, these results indicate significant divergence at the species level for the two clades of tubenose gobies.
Population genetics of tubenose gobies
In the freshwater taxon, two haplotypes were shared between each pair of primary sampling locations, with A comprising 55% of the sample
in Lake St. Clair and 33% of the sample from the Danube River at Prahovo, Yugoslavia – as well as the single sample analyzed from the Dniester River (Table 2). In addition, type B represented 27% of the Lake St. Clair sample and 60% from the Dnieper River location. Haplotype C made up 67% of the individuals from the Danube River, 20% in the Dnieper River, and 18% of the Great Lakes sample. All haplotypes in the freshwater collections were closely related (Figures 2 and 3).
The two Black Sea sampling locations of the marine taxon (corresponding to the original
P. marmoratus) shared haplotype E (Table 2), which constituted 70% of the sample in the north-central Black Sea (at Odessa, Ukraine) and 50% of the individuals from the north-eastern Black Sea location (at Sevastopol, Ukraine). In addition, the Odessa site contained 30% of the F haplotype and the Sevastopol location had 50% of the I type. The estuarine sample from the Tyligul River estuary north of Odessa had three unique haplotypes that were most closely related to type I from the Sevastopol region of the Cri-mea in the Black Sea. The sample from the Tyli-gul estuary thus was more closely related to the marine types than to the freshwater haplotypes (Table 2).
Nucleotide diversity values were highest for sites from the Black Sea, which also had larger pairwise distances among their haplotypes than did the freshwater locations (Table 3A). The
Figure 3. Neighbor-joining tree of relationships amongProterorhinushaplotypes from partial cytochromebsequences, constructed
using Kimura (1980) two-parameter genetic distances in MEGA 2.1 (Kumar et al. 2001), with 1000 bootstrap replications (support for nodes indicated as %). Vertical bars denote the number of nucleotide synapomorphies distinguishing the two primary clades.
Table 3. Genetic diversity measures at primary sampling sites for the tubenose (A) and round gobies (B). Genetic Diversity measure Lake St. Clair, Michigan, USA Danube River, Prahovo, Yugoslavia Dnieper River Kiev, Ukraine Tyligul Estuary, Odessa, Ukraine NC Black Sea, Odessa, Ukraine NE Black Sea, Sevastopol, Ukraine A. Tubenose goby Nhaplotypes 3 2 3 3 2 2 Gene diversity (h) 0.654 ± 0.112 0.667 ± 0.314 0.700 ± 0.210 0.600 ± 0.215 0.467 ± 0.132 0.600 ± 0.129 Nucleotide diversity (p) 0.0123 ± 0.0072 0.0059 ± 0.0053 0.0167 ± 0.0109 0.0044 ± 0.0033 0.0394 ± 0.0217 0.0720 ± 0.0425 MeanNpairwise differences 5.563 ± 2.895 2.667 ± 1.919 7.500 ± 4.223 2.004 ± 1.303 17.733 ± 8.617 32.400 ± 16.546
B. Round goby Lake St. Clair
Michigan, USA Lake Erie Ohio, USA Danube River at Vienna, Austria and Prahovo, Yugoslavia Dnieper River Kiev, Ukraine w Black Sea Varna, Bulgaria n Black Sea Odessa and Sevastopol, Ukraine Nhaplotypes 3 4 2 1 3 2 Gene diversity (h) 0.404 ± 0.100 0.606 ± 0.062 0.063 ± 0.058 0.000 ± 0.000 0.467 ± 0.132 0.286 ± 0.196 Nucleotide diversity (p) 0.0096 ± 0.0010 0.0015 ± 0.0014 0.0001 ± 0.0003 0.0000 ± 0.0000 0.0006 ± 0.0008 0.0006 ± 0.0009 MeanNpairwise differences 0.429 ± 0.399 0.688 ± 0.0543 0.063 ± 0.0004 0.000 ± 0.000 0.267 ± 0.309 0.286 ± 0.341
Table 4.Genetic divergences between pairs of sampling sites for the tubenose goby. Fstvalues and probabilities are below the
diagonal andNmestimates of migration are above the diagonal (Slatkin 1995). Sampling location Lake St. Clair,
Great Lakes, Michigan, USA
Rivers draining into Black Sea (Danube, Dniester, and Dnieper) Yugoslavia and Ukraine
NC Black Sea Odessa and Tyligul Estuary, Ukraine
NE Black Sea Sevastopol, Ukraine
Lake St. Clair – infinite 0.150 0.118
Black Sea Rivers 0.078P< 0.811 N.S. – 0.165 0.140
NC Black Sea 0.769**P< 0.00001 0.752**P< 0.00001 – 1.76 NE Black Sea 0.809**P< 0.00001 0.782**P< 0.00001 0.221P< 0.048* – N. S., not significant.
**Fstsignificant after Bonferroni correction for multiple post-hoc tests.
*Significant atP< 0.05 level, without Bonferroni correction (e.g., needs larger sample size to determine).
Table 5. Comparative population sizes and differentiation between pairs of sampling sites for the tubenose goby. Below diagonal:
Ancestral population sizes (h) comparisons and probability values (Gaggiotti and Excoffier 2000). Above diagonal: Global test of differentiation (Raymond and Rousset 1995).
Sampling location Lake St. Clair, Great Lakes Michigan, USA
Black Sea Rivers (Danube, Dniester, and Dnieper) Yugoslavia and Ukraine
NC Black Sea Odessa and Tyligul Estuary, Ukraine
NE Black Sea Sevastopol, Ukraine Lake St. Clair – P< 0.474 N.S. P< 0.0001** P< 0.004** Danube and Dnieper Rivers 5.479P< 0.872 N.S. – P< 0.0010** P< 0.001** NC Black Sea 26.372P< 0.770 N.S. 27.564P< 0.937 N.S. – P< 0.050* NE Black Sea 35.551P< 0.986 N.S. 27.509P< 0.983 N.S. 32.461P< 0.167 N.S. – N.S., not significant.
*Significant atP< 0.05 level, without Bonferroni correction (e.g., may need a larger sample size to determine). ** Significant after Bonferroni correction for multiple post-hoc tests.
largest nucleotide diversity characterized the Sevastopol, Ukraine location. The global test of genetic differentiation between the Black Sea sites suggested negligible divergence, with migration estimated as less than two individuals per genera-tion (Tables 4 and 5). The samples from the Danube, Dniester, and Dnieper Rivers were com-bined for analysis of pairwise differentiation, due to low sample sizes at present (Table 4). Esti-mates of ancestral population sizes (h) did not significantly differ between pairs of sampling sites, suggesting that the populations were approximately equivalent (Table 5). AMOVA tests showed that 12.24% of the overall genetic variation was found among the pairs of popula-tions in the two regions (freshwater and marine), which was significant (P< 0.001).
Population genetics of round gobies
Seven haplotypes of round gobies were detected, of which A (originally described by Dougherty et al. 1996) was the most common overall and was prevalent in all sampling locations – freshwater and marine, as well as nonindigenous and native sites (Table 2). Haplotype A predominated in all European locations, including marine and fresh-water sites. Sites in the Great Lakes had less proportional representation of type A. All other haplotypes diverged from A by a single point mutation each (Figure 2), two at first codon posi-tions and four at third codon posiposi-tions. Lake St. Clair in the Great Lakes housed three haplotypes (A, B, and C), and Lake Erie contained four types (A, B, C, and F), with type B being much more common in Lake Erie than in Lake St. Clair (Table 2). Two round gobies without the charac-teristic dorsal spot from central Lake Erie were haplotypes A and F. Those samples also corre-sponded morphologically toN. melanostomus.
Haplotype B was very rare in the Danube River sample at Prahovo, Yugoslavia and neither types C nor F were detected in the European locations. The sampling location in the western Black Sea (Varna, Bulgaria) also had three types (A, D, and E; described by Dougherty et al. 1996), of which the latter two were unique to that area. Most other locations sampled in Europe had two haplotypes, with sites from the
Danube River at Vienna, Austria and the north-central Black Sea at Odessa, Ukraine appearing monomorphic for type A (which may be due to low sample size). The north-eastern Black Sea sample (Sevastopol, Crimea, Ukraine) housed a rare haplotype (G), in addition to type A.
Gene diversity (Table 3B) was greatest in the Lake Erie population, and was next highest in the sample from Lake St. Clair and in the wes-tern Black Sea at Varna, Bulgaria. Nucleotide diversity and the mean number of pairwise differ-ences also were highest in the two Great Lakes locations. In contrast, the European freshwater locations in the Danube and Dnieper Rivers had very low values of gene diversity, nucleotide diversity, and mean numbers of pairwise differences (Table 3B). The sample in Lake St. Clair appeared close to those from the northern Black Sea and the Dnieper River in genetic com-position, whereas the Lake Erie sample was least divergent from the Dnieper River (Tables 6 and 7).
Global tests (Raymond and Rousset 1995) showed significant pairwise differentiation between samples from the Great Lakes vs the Danube River and between Lake Erie and the western Black Sea (Table 7), with the Danube River popu-lation estimate being appreciably smaller. Migration (Nm) estimates between pairs of sam-pling sites were appreciable (Table 6), especially between Lake St. Clair and the Dnieper River, the Danube and the Dnieper Rivers, and the Black Sea locations. Migration was least between the Danube River and Lake Erie, and between the western Black Sea site and Lake Erie. These results may suggest that the Lake St. Clair and Lake Erie populations of round gobies have different found-ing sources, but larger sample sizes are needed.
Estimates of ancestral population sizes (h) showed that the Danube River sample differed significantly from the Dnieper River as well as the northern Black Sea, with the Danube River population being smaller (Table 7). Other significant differences occurred between the northern Black Sea vs the Dnieper River and the western Black Sea, with the northern Black Sea population estimated as larger in size (Table 7).
AMOVA analyses showed that 10% of the genetic variation in the round goby was parti-tioned among the three groups (Great Lakes,
European Rivers (Danube and Dnieper), and the Black Sea), which was not significant. Variation within the pairs of samples per group comprised 4.72% overall, which was not significant. The majority of the genetic variation in the round goby (85.26%) was found within the population samples.
Discussion
Systematic revision of Neogobiinae and diagnostic species characters
The phylogenetic trees indicated that the neogobiin genus Neogobius is paraphyletic, and
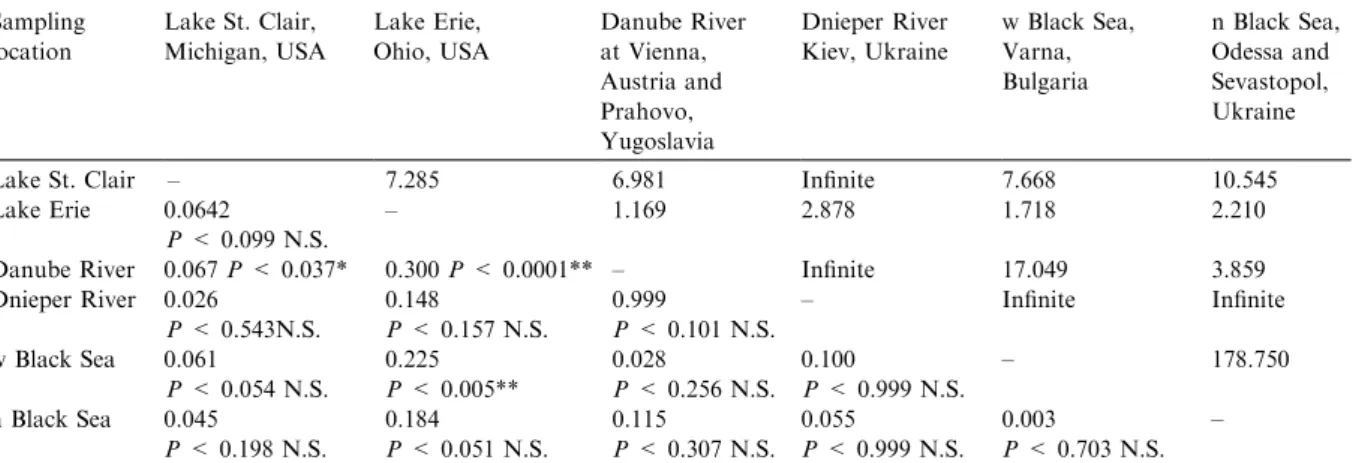
Table 6. Genetic divergences between pairs of sampling sites for the round goby. Fstvalues and probabilities (below diagonal) and
Nmestimates of migration above diagonal (Slatkin 1995) for the round goby. Sampling location Lake St. Clair, Michigan, USA Lake Erie, Ohio, USA Danube River at Vienna, Austria and Prahovo, Yugoslavia Dnieper River Kiev, Ukraine w Black Sea, Varna, Bulgaria n Black Sea, Odessa and Sevastopol, Ukraine
Lake St. Clair – 7.285 6.981 Infinite 7.668 10.545
Lake Erie 0.0642
P< 0.099 N.S.
– 1.169 2.878 1.718 2.210
Danube River 0.067P< 0.037* 0.300P< 0.0001** – Infinite 17.049 3.859 Dnieper River 0.026 P< 0.543N.S. 0.148 P< 0.157 N.S. 0.999 P< 0.101 N.S. – Infinite Infinite w Black Sea 0.061 P< 0.054 N.S. 0.225 P< 0.005** 0.028 P< 0.256 N.S. 0.100 P< 0.999 N.S. – 178.750 n Black Sea 0.045 P< 0.198 N.S. 0.184 P< 0.051 N.S. 0.115 P< 0.307 N.S. 0.055 P< 0.999 N.S. 0.003 P< 0.703 N.S. – N. S., not significant.
*Significant atP< 0.05 level, without Bonferroni correction (e.g., needs larger sample size to determine). **Fstsignificant after Bonferroni correction for multiple post-hoc tests.
Table 7. Comparative population sizes and differentiation between pairs of sampling sites for the round goby,Neogobius
(Apollo-nia) melanostomus. Below diagonal: Ancestral population sizes (h) comparisons and probability values (Gaggiotti and Excoffier
2000). Above diagonal: Global test of differentiation using exactP-values (Raymond and Rousset 1995). Sampling location Lake St. Clair, Michigan, USA Lake Erie, Ohio, USA Danube River at Vienna, Austria and Prahovo, Yugoslavia Dnieper River, Kiev, Ukraine w Black Sea, Varna, Bulgaria n Black Sea, Odessa and Sevastopol, Ukraine Lake St. Clair – P< 0.109 N.S. P< 0.038* P< 0.070 N.S. P< 0.059 N.S. P< 0.191 N.S. Lake Erie 0.880 P< 0.146 N.S. – P< 0.000** P< 0.300 N.S. P< 0.002** P< 0.059 N.S. Danube River 0.669 P< 0.171 N.S. 0.738 P< 0.149 N.S. – P< 1.000 N.S. P< 0.244 N.S. P< 0.324 N.S. Dnieper River 0.000 P< 1.000 N.S. 0.000 P< 1.000 N.S. 0.000 P< 0.0001** – P< 1.000 N.S. P< 1.000 N.S. w Black Sea 0.469 P< 0.437 N.S. 0.694 P< 0.258 N.S. 0.289 P< 1.000 N.S. 0.000 P< 1.000 N.S. – P< 0.709 N.S. n Black Sea 0.457 P< 0.402 N.S. 0.693 P< 0.209 N.S. 0.009 P< 0.0001** 0.000 P< 0.0001** 1.482 P< 0.0001** – N.S., not significant.
*Significant atP< 0.05 level, without Bonferroni correction (e.g., needs larger sample size to determine). **Significant after Bonferroni correction for multiple post-hoc tests.
thus the subgenus name N. Apollonia (Vasil’eva et al. 1993), which contains the speciesN. melano-stomus andN. fluviatilis), needs to be elevated to the level of genus (Harold Ahnelt, pers. commun.). According to our phylogenetic analyses, the newly elevated genusApollonia is the sister group to all of the remaining neogobiins that have been ana-lyzed (including Proterorhinus, Mesogobius, and the newly restrictedNeogobiusclade (see Figures 2 and 3). WithinApollonia, a sister relationship was discerned between A. (N.) melanostomus and
A.(N.)fluviatilis, which is congruent with relation-ships based on osteological characters by Vasil’eva et al. (1993) and Simonovic (1999). Three primary clades were resolved within the subfamily Neogo-biinae, as follows: (1)A.(N.)melanostomusandA.
(N.) fluviatilis¼new genus Apollonia (elevated from the subgenus level of Vasil’eva et al. 1993), (2) Proterorhinus – now to be designated as two species, and (3) the remaining species of
Neogobius. Distinguishing nucleotide characters for all species can be used to elucidate among neogobiins at all life history stages and to identify invasive ‘unknown’ taxa (see GenBank Accession numbers in Results).
Phylogenetic results revealed marked and signif-icant genetic divergence between the freshwater and marine clades of tubenose gobies, indicating that they comprise two separate species. The original type locality for the tubenose goby
P. marmoratus Pallas (1814) is from Sevastopol, Crimea, Ukraine – which also was sampled in our study. The ‘newly-found’ ‘cryptic’ species appears to have originally been described asP. semilunaris
Heckel (1837) according to records at California Academy of Sciences (2005) and consultation with Dr Harald Ahnelt (pers. commun.). At present, we thus recommend that Proterorhinus semilunaris
Heckel (1837), which is the oldest name for a freshwater tubenose goby, be resurrected for the freshwater tubenose goby. The species
Proterorhinus semilunaris was originally described from the Maritsa River in the Aegean region (Heckel 1837) and then from a stream near the Danube River estuary (Nordmann 1840). It was placed in synonymy withP. marmoratus by Berg (1949), along with other freshwater and marine names for variants ofProterorhinus. Specimens of tubenose goby from the North American Great Lakes region, as well as those from freshwater
European habitats – including the Danube, Dni-ester, and Dnieper Rivers – are thus likelyP. semi-lunaris, pending further examination and description. We also recommend that the common names ‘freshwater tubenose goby’ be used for
P. semilunaris and ‘marine tubenose goby’ for
P. marmoratus.
Our results demonstrated a marked genetic divergence distinguishing these species, with
P. semilunaris in freshwater habitats and
P. marmoratus in estuarine and saline waters. This description is being completed by Stepien and graduate student Matthew Neilson, based on morphological and genetic analysis of specimens and syntypes ofP. semilunaris, obtained from the Vienna Museum of Natural History.
Genetic diversity in invasive vs native population sites
Results from the present study showed that both the tubenose goby and round goby samples from the Great Lakes have high genetic diversity values. Both nonindigenous species introductions revealed genetic diversity values equivalent to native European populations. There thus was no evidence apparent for founder effects or bottle-necks in either species. These results suggest that the populations of round and tubenose gobies in the Great Lakes were founded by a very large number of diverse individuals. Similar results were shown by our studies of genetic diversity in invasive zebra and quagga mussel populations in the Great Lakes vs native areas in Eurasia (Stepien et al. 2002, 2003, 2005).
In addition, samples of round gobies from the adjacent Great Lakes St. Clair and Erie differed somewhat, which may suggest different founding sources but needs to be tested with larger sample sizes. However, an earlier study by Dillon and Stepien (2001) of those populations using the more-quickly evolving mtDNA control region sequences revealed significant differences between the Lake St. Clair and Lake Erie samples. These congruent results from two different gene regions suggest a possibility of separate founding events for each lake. Similarly, zebra and quagga mussel populations in the Great Lakes showed signifi-cant genetic divergences among sites, as well as differential relationships with putative Eurasian
founding source populations, suggesting that more than one colonization source was involved. Thus, in both the round goby and the zebra mus-sel – two of the largest and most successful invasions in the Great Lakes – multiple founding sources and nearly simultaneous introductions in different areas from different colonizing source populations may have characterized the inva-sions. This high genetic variability appears to have led to their ability to quickly adapt to a variety of conditions in their new habitats, as well as to spread into new areas.
After colonization, spatial segregation of the dispersal genotypes may foster local adaptation, increasing reproductive isolation of the new populations and reducing between-location migration (Mathias et al. 2001). Such spatial seg-regation may have resulted from multiple intro-ductions from different Eurasian source populations in different areas of the Great Lakes for zebra and quagga mussels (Stepien et al. 2002, 2003, 2005) and the round goby (Dillon and Stepien 2001; Stepien et al. 2005), as revealed by significant genetic divergences among popula-tion areas. In addipopula-tion to physical isolapopula-tion, local differential selection might limit their later dis-persal and introgressive hybridization among areas, enhancing the genetic and ecological differ-ences among the populations (Bernatchez 2001). These factors may lead to increased divergence among regions of an invasion that have some geographic barriers to gene flow.
Characteristics of successful invasions and predictions
Regions with histories of anthropogenic and/or natural disturbances are more susceptible to successful nonindigenous species invasions (Williamson 1996, Ross et al. 2001). Both the geologically young Great Lakes and the Ponto-Caspian regions have histories of climactic insta-bility, dramatic basin and waterway changes, and more recently – heavy metal, pesticide, fertilizer, and run-off pollution. The round goby has par-ticularly high pollution tolerance (Moskal’kova 1996; Landrum and Fisher 1998), which may aid its success in new and marginal habitats. In addition, results of ecological studies predict that
invasion-prone communities have lower overall species diversities and offer greater niche opportunities (Elton 1958; Case 1990; Moulton and Pimm 1993; Shea and Chesson 2002).
The round goby prefers brackish waters in its native habitats (Charlebois et al. 1997), although it is confined to freshwater in its present North American invasive range. Our results found that round gobies sampled from freshwater habitats had greater genetic diversity than in marine habi-tats. The most common haplotype ‘A’ was abun-dant in both freshwater and marine areas. The round goby thus appears likely to extend its range into North American salt marsh and estua-rine habitats, where it may significantly impact marine and estuarine benthic fish communities. The round goby will encounter an abundant food supply in native blue mussels along North American coasts, to which they are pre-adapted (since they feed on native Mytilus congeners in their Black and Caspian Sea marine/estuarine habitats; personal observation and field data col-lected by C. Stepien).
Both North American invasive species also have been extending their ranges and invading new areas in Eurasia, including traveling up the Danube River (Ahnelt et al. 1998), where some samples were analyzed in the present study (Figure 1). In contrast to the Great Lakes samples, both the Danube and Dnieper River samples of the round goby had lower genetic diversity values, which may indicate a founder effect. In addition, the round goby invaded the Gulf of Gdansk, Baltic Sea, Poland in 1990 (Skora and Stolarski 1993) – about the same time as its discovery in the Great Lakes. Our mtDNA sequence study from the control region (Dillon and Stepien 2001) discerned that the Gulf of Gdansk and North American invasions had separate founding sources, which are pres-ently unknown, since the sites shared no haplotypes and both had few in common with the NW Black Sea region. The genetic diversity of the Gulf of Gdansk samples were about half that of the Great Lakes samples (Dillon and Stepien 2001). The sources for each invasive population are being sought from statistical comparisons with our collections spanning the Ponto-Caspian region in further study by the Stepien laboratory.
Implications for risk analysis and invasive species management
The US National Oceanic and Atmospheric Administration (NOAA) is charged with the management of the Great Lakes aquatic inva-sive species through the Non-indigenous Aqua-tic Nuisance Prevention and Control Act (NANPCA) (summarized in Nicholls and Tumeo, 2001). The US Department of Com-merce (through NOAA) and the US Depart-ment of the Interior (through the Fish and Wildlife Serve) co-chair the Aquatic Nuisance Species Task Force. This task force has devel-oped a generic non-indigenous aquatic organism risk analysis review process for estimating risks from the introduction of non-indigenous aqua-tic organisms. The objective of this generic pro-cess is to provide a standardized propro-cess for evaluating the risk of introducing non-indige-nous organisms into a new environment and determining the correct risk management steps needed to mitigate that risk. The process pro-vides a framework by which scientific, techni-cal, and other relevant information can be organized into a format that is proposed to be understandable and useful to managers and decision makers.
A significant advantage of the genetic data col-lected in this study is their application in deter-mining the risk of invasion from related species. Table 8 lists the elements as detailed in the guid-ance document (ANSTF 1996) and provides an example of how the genetic data collected in this study could be used to produce a qualitative esti-mate of risk for each of the seven elements shown.
An important step in the risk analysis process involves examination of what kind of risk man-agement could be implemented to eliminate or reduce the impact of the hazard (in this case, the establishment of an invasive species). The best solution is to prevent the introduction alto-gether. International cooperative efforts for stemming ballast water introductions have moved strongly in this direction. The type of genetic data presented in this study can greatly assist in targeting efforts in this regard when one recognizes that related species have similar risk for entry and establishment. For example,
it appears highly likely that the round goby will spread to salt marsh and estuarine habitats in North America, where they will encounter abundant native prey in Mytilus mussels. Their genotypic diversity and divergence patterns in the Great Lakes suggest that genotypes already here will likely be successful in more saline hab-itats.
It is also likely that other neogobiin taxa will be introduced and established, as there is a high probability that there will be multiple introduc-tions as clearly indicated by the genetic data in this study. Our investigation, however, indicates that atypical round goby A. (N.) melanostomus
morphotypes in the Great Lakes are A.(N.) mel-anostomus and not the monkey goby ‘sister species’ A. (N.) fluviatilis. This suggests that the genetic differences between these two species may warrant further investigation and could provide additional genetic bases for the analysis of ‘‘inva-siveness.’’
Conclusions and summary
This investigation developed species and popula-tion identification genetic markers to allow invasive neogobiin taxa to be described accu-rately at all life history stages (including eggs and larvae). Correct species and founding popu-lation source identifications are necessary for monitoring the invasions, making valid ecologi-cal comparisons, and formulating methods of prevention and control. This genetic study, as well as others by the Stepien laboratory to date reveal that invasions in the Great Lakes by Ponto-Caspian species – including the zebra mussel, quagga mussel, round goby, and tube-nose goby – are characterized by high levels of genetic diversity, comparable to that of native populations, which appears important to their invasive successes (Dillon and Stepien 2001; Stepien et al. 2002, 2003, 2005, and here).
Risk analysis of the genetic characters of inva-sive populations indicates that high genetic variability, large number of founders, and intro-duction of several invasion founding source populations lead to high probability of establish-ment and persistence. In addition, the popula-tions of round gobies in the Great Lakes – as
Table 8. Application of genetic data to risk assessments. Element (per ANSTF guidance) Important considerations in
assessing element
Application of data collected in this study
Section 1: Probability of organism establishment
Estimate probability of the organism being on, with, or in the pathway
(ballast water in this case). Estimate probability of the organism surviving in transit.
Organism’s temporal and spatial association with the pathway.
Genetic data show that highly successful Ponto-Cas-pian invasions in the Great Lakes are characterized by (1) a large number of introduced genotypes, with genetic diversities of invasive populations comparable to that of native population sites, (2) equivalent effec-tive population sizes of naeffec-tive and introduced popula-tions, indicating that the introductions did not undergo ‘genetic bottlenecks’, and (3) considerable genetic dif-ferentiation and large number of haplotypes. This strongly suggests that more than one founding source population was involved and that each likely had sepa-rate origins. Hence, related species in the areas of ori-gin could be considered to have a high probability to be in ballast water and to survive transport.
Organism’s hitchhiking ability in commerce, ability to survive during transit, stage of life cycle during transit, number of individuals expected to be associated with the pathway; or whether it is deliberately introduced (e.g. biocontrol agent or fish stocking). Estimate probability of the
organism colonizing and maintaining a population.
Organism’s ability to come into contact with an adequate food resource, probability of encountering appreciable abiotic and biotic environmental resistance, and the ability to reproduce in the new environment.
Similar results have been found in zebra and quagga mussels (Stepien et al. 2002, 2003, 2005). In addition, the invasive population areas for zebra mussels, quagga mussels and round gobies, including those in different Great Lakes, show genetic divergence and match differ-ent source populations, suggesting that differdiffer-ent found-ing sources contributed differentially to the new populations. It thus is likely that several nearly simulta-neous invasions occurred from several different sources, in these cases.
Estimate probability of the organism spreading beyond the colonized area.
Ability for natural dispersal, ability to use human activity for dispersal, abil-ity to readily develop races or strains, and the estimated range of probable spread.
Section II: Consequence of Establishment
Estimate economic impact if established.
Economic importance of hosts, damage to crop or natural resources, effects to subsidiary industries, exports, and control costs.
The risk consequence indicated by genetic data – i.e., a large number of genotypes, high genetic diversity, and significant divergence among colonizing population sites appears to be extremely high in terms of our unfortu-nate inability to ‘control’ an invasion once it has become established, as is the case with dreissenid mussels as well as the round goby.
Estimate environmental impact if established
Ecosystem destabilization, reduction in biodiversity, reduction or elimination of keystone species, reduction or elimination of endangered/threatened species, and effects of control measures, impacts on the human environment (e.g. human parasites or pathogens would also be captured under this element.) Estimate impact from social
and/or political influences
well as zebra and quagga mussels (Stepien et al. 2002, 2003) – have appreciable population struc-ture, which may enhance their persistence and ability to adapt to new environments. It is likely that the round goby will spread to estuarine and salt marsh habitats in North America from the Great Lakes region. It is also predicted that other neogobiin congeners will invade from the Ponto-Caspian region, and be successful, if bal-last water regulations are not strictly enforced.
Acknowledgements
National Science Foundation grant DEB-0349964, the Lake Erie Protection Fund # 02-04, the USEPA, and the Cleveland State University Envi-ronmental Risk Analysis Project through the Centre for Environmental Science, Technology and Policy generously supported this work. We greatly appreciate the help of Igor Grigorovich, Jeffrey Gunderson, John Hageman, Juraj Holcik, Douglas Jensen, David Jude, Kevin Kayle, Carey Knight, Julia Kornijchuck, Yuriy Kvach, Vladimir Kovac, J. Ellen Marsden, Jeffrey Ram, Svetlana Rudnicka, Mariusz Sapota, Predrag Simonovic, and A. Smirnov in obtaining specimens. We addi-tionally thank Elizabeth Whippo-Cline, Sandra Justin, Jeffrey Busch, and Jeffrey Reutter for logis-tical assistance. Technician Clifford Taylor and graduate students Matthew Neilson, Alison Dil-lon-Klika, W. Calvin Borden, Toriano Bowens, and Kora Dabrowska helped with raw data acqui-sition at various stages of the project. Graduate student Alex Ford and colleague Igor Grigorovich helped with the map designs. Melissa Blum of the CSU DNA Analysis Facility ran the DNA sequen-cer. In addition, we thank Harald Ahnelt for nomenclature advice, as well as information about historical taxonomy and morphology.
References
Ahnelt, H and Holcik J (1996) Distribution of two species of the genus Neogobius (Pisces: Gobiidae) in area of the southern Caspian Sea. Acta Universitatis Carolinae 40(1–2): 99–114
Ahnelt H, Banarescu P, Spolwind R, Harka A and Waid-bacher, H. (1998) Occurrence and distribution of three gobiid species (Pisces, Gobiidae) in the middle and upper
Danube region – examples of different dispersal patterns? Biological (Bratislava) 53(5): 665–678
ANSTF (1996) The Generic Nonindigenous Aquatic Organisms Risk Analysis Review Process Risk Assessment and Management Committee of the Aquatic Nuisance Spe-cies Task Force, Washington, DC. October 21, 1996 Avise, JC (2000) Phylogeography: The History and
Formation of Species. Harvard University Press, Cam-bridge, MA
Bernatchez, L (2001) The evolutionary history of brown trout
(Salmo trutta L.) inferred from phylogeographic, nested
clade, and mismatch analyses of mitochondrial DNA variation. Evolution 55(2): 351–379
California Academy of Sciences (2005) Ichthyology, Catalog of Fishes. http://www.calacademy.org
Case TJ (1990) Invasion resistance arises in strongly interacting species-rich model competition communities. Proceedings of the National Academy of Sciences, USA. 87: 9610–9614 Charlebois PM, Marsden JE, Goettel RG, Wolfe RK, Jude
DJ and Rudnika S (1997) The round gobyNeogobius
mela-nostomus (Pallas): A Review of European and North
American Literature. Illinois-Indiana Sea Grant Program and Illinois Natural History Survey. INHS Special Publica-tion No. 20. 76 pp
Crossman EJ, Holm E, Cholmondeley R and Tuininga K (1992) First record for Canada of the rudd, Scardinius
erythrophthalmusand notes on the introduced round goby,
Neogobius melanostomus. The Canadian Field-Naturalist
106: 206–209
Dillon AK and Stepien CA (2001) Genetic and biogeographic relationships of the invasive round (Neogobius
melanostomus) and tubenose (Proterorhinus marmoratus)
gobies in the Great Lakes versus Eurasian populations. Journal of Great Lakes Research 27(3): 267–280
Dougherty JD, Moore WS and Ram JL (1996) Mitochondrial DNA analysis of round goby (Neogobius melanostomus) and tubenose goby (Proterorhinus marmoratus) in the Great Lakes basin. Canadian Journal of Fisheries and Aquatic Sciences 53: 474–480
Elton CS (1958) The Ecology of Invasions by Animals and Plants. Methuen, London
Felsenstein J (1985) Confidence limits on phylogenies: an approach using the bootstrap. Evolution 39: 783–791 Froese R and Pauly D (eds) (2004) FishBase. http://www.
fishbase.org
Gaggiotti OE and Excoffier LA (2000) A simple method of removing the effect of a bottleneck and unequal population sizes on pairwise genetic distances. Proceedings of the Royal Society of London Series B Biological Sciences 267(1438): 81–87
Garcia-Ramos G and Rodriguez D (2002) Evolutionary speed of species invasions. Evolution 46(4): 661–668
Ghedotti MJ, Smihula JC and Smith GR (1995) Zebra mussel predation by round gobies in the laboratory. Journal of Great Lakes Research 21(4): 665–669
Grigorovich IA, MacIsaac HJ, Shadrin NV and Mills EL (2002) Patterns and mechanisms of aquatic invertebrate introductions in the Ponto-Caspian region. Canadian Journal of Fisheries and Aquatic Sciences 59: 1189–1208
Grigorovich IA, Colautti RI, Mills EL, Holeck K, Ballert AG and MacIsaac HJ (2003) Ballast-mediated animal introduc-tions in the Laurentian Great Lakes: retrospective and pro-spective analyses. Canadian Journal of Fisheries and Aquatic Sciences 60(6)2003: 740–756
Gunther A (1861) Catalogue of the fishes in the British Museum. Catalogue of the acanthopterygian fishes in the collection of the British Museum. 3. Gobiidae, Discoboli, Pediculati, Blenniidae, Labyrinthici, Mugilidae, Notacan-thi. London. Catalog Fishes v. 3: i-xxv + 1–586 + i-x Heckel JJ (1837) Ichthyologische Beitra¨ge zu den Familien
der Cottoiden, Scorpaenoiden, Gobioiden und Cyprinoiden. Ann. Wien. Mus. Naturges. 2: 143–164 Holcı´k J (1991) Fish introductions in Europe with particular
reference to its central and eastern part. Canadian Journal of Fisheries and Aquatic Sciences 48 (Supplement 1): 13–23 Holland BS (2000) Genetics of marine bioinvasions.
Hydrobi-ologia 420: 63–71
Jude DJ (1997) Round gobies: cyberfish of the third millen-nium. Great Lakes Research Review 3: 27–34
Jude DJ (2001) Round and tubenose gobies: 10 years with the latest Great Lakes phantom menace. Dreissena 11(4): 1– 14
Kautman J (2001) The first occurrence ofNeogobius
gymno-trachelus in the Slovak Danube. Folia Zoologica 50(1):
79–80
Kessler KT (1857) Nachtra¨ge zur Ichthyologie des su¨dwestli-chen Russlands. Bulletin de la’Societe Imperiale des Natu-ralistes de Moscou 30(2): 453–481
Kocher TD, Thomas WK, Meyer A, Edwards SV, Pabbo S, Villablanca FX and Wilson AC. Dynamics of mitochon-drial DNA evolution in animals: amplification and sequencing with conserved primers. Proceedings of the National Academy of Sciences, USA 86: 6196–6200 Kolar CS and Lodge, DM (2001) Progression invasion
biology: predicting invaders. Trends in Ecology and Evolu-tion 16(4): 199–204
Kolar CS and Lodge DM (2002) Ecological predictions and risk assessment for alien fishes in North America. Science 298: 1233–1236
Kriesch A (1873) Ein neuer Gobius. Verhandllungen der kaiserlich-kongiglichen zoologish-Botanischen Gesellschaft in Wien 23: 369–376
Kumar S, Tamura K, Jakobsen IB and Nei M (2001) MEGA2.1: Molecular Evolutionary Genetics Analysis software, Arizona State University, Tempe, AZ
Kvach JV (2001) Ligula invasion of monkey goby (Neogobius
fluviatilis) in some estuaries of northwestern Black Sea
region. Vestnik Zoologii 34(1): 85–88
Landrum PF and Fisher SW (1998) Influence of lipids on bio-accumulation and trophic transfer of organic contaminants in aquatic organisms. In: Arts M and Wainman B (eds) Lipids in Freshwater Ecosystems, pp 203–234. Springer-Verlag, New York, NY
MacIsaac HJ, Grigorovich IA and Ricciardi A (2001) Reassessment of species invasions concepts: the Great Lakes basin as a model. Biological Invasions 3: 405–416 Margush T and McMorris FR (1981) Consensus n-trees.
Bul-letin of Mathematical Biology. 43: 239–244
Martin AP, Naylor GJP and Palumbi SR (1992) Population genetic structure of the armorhead Psudopentaceros
wheeleri, in the North Pacific ocean: application of the
polymerase chain reaction to fisheries problems. Canadian Journal of Fisheries and Aquatic Sciences 49: 2386–2391 Mathias A, Kisdi E and Olivieri I (2001) The evolution of
dis-persal in a heterogeneous landscape. Evolution 55: 246–259
Meyer A, Kocher TD, Bsibwaki P and Wilson AC (1990) Monophyletic origin of Lake Victoria cichlid fishes sug-gested by mitochondrial DNA sequences. Nature (London) 47: 550–553
Mills EL, Leach JH, Carlton JT and Secor CL (1993) Exotic species in the Great Lakes: a history of biotic crises and anthropogenic introductions. Journal of Great Lakes Research 19: 1–54
Moskal’kova, KI (1996) Ecological and morphophysiological prerequisites for the expansion of the area of distribution of the round goby Neogobius melanostomus in anthropogenically polluted bodies of water. Voprosy Ikhti-ologii 36: 615–621
Moulton MP and Pimm SL (1983) The introduced Hawaiian avifauna: biogeographic evidence for competition. American Naturalist 121: 669–690
Muller J (2001) Invasion history and genetic population structure of riverine macroinvertebrates. Zoology 104: 1–10 Nei M (1987) Molecular Evolutionary Genetics. Columbia
University Press, New York, NY
Nicholls AM and Tumeo MA (2001) Primer on Federal Inva-sive Species Risk Policy. Prepared for the Risk Analysis for Invasive Species Workshop, New Mexico State Univer-sity, Las Cruces, NM, October 21–23, 2001
Nordman AV (1840) Observations sur la fauna pontique. In: A. de De´midoff (ed) Voyage dans la Russie me´ridionale et la Crime´e. Vol. III, pp 353–635. Voyage Russie Me´rid., Paris
Pallas PS (1814) Zoographia Rosso-Asiatica, sistens omnium animalium in extenso Imperio Rossico et adjacentibus mari-bus observatorum recensionem, domicilia, mores et descriptiones, anatomen atque icones plurimorum. 3 vols [1811–1814]. Petropoli. Zool. Rosso-Asiatica v. 3(I–vii): 1–428
Palumbi SR (1997) Nucleic Acids II: The polymerase chain reaction. In: Hillis, DM, Moritz C and Mable BK (eds) Molecular Systematics, Second edn, Ch. 7, pp 205–247. Si-nauer Assoc., Sunderland, MA
Rambaut A (1996) Se-Al: Sequence Alignment Editor. http:// evolve.zoo.ox.ac.uk/
Raymond M and Roussett F (1995) An exact test for population differentiation. Evolution 49: 1280–1283 Ricciardi A and MacIsaac HJ (2000) Recent mass invasion of
the North American Great Lakes by Ponto-Caspian spe-cies. Trends in Ecology and Evolution 15: 62–65
Ross RM, Lellis WA, Bennett RM and Johnson CS (2001) Landscape determinants of nonindigenous fish invasions. Biological Invasions 3(4): 347–36
Saitou N and Nei M (1987) The neighbor-joining method: a new method for reconstruction of phylogenetic trees. Molecular Biology and Evolution 4: 406–425
Schneider S, Kueffer J, Roessli D. and Excoffier L. (2003) Ar-lequin vers. 2.2: a software for population genetic data analysis. Genetics and Biometry Laboratory. University of Geneva, Switzerland, http://lgb.unige.ch/arlequin/ about.php
Shea K and Chesson P (2002) Community ecology theory as a framework for biological invasions. Trends in Ecology and Evolution 17(4): 170–176
Simberloff D and Von Holle B (1999) Positive interactions of nonindigenous species: invasional meltdown? Biological Invasions 1: 21–32
Simonovic PD (1999) Phylogenetic relationships of Ponto-Caspian gobies and their relationship to the Atlantic– Mediterranean Gobiinae. Journal of Fish Biology 54(3): 533–555
Skora KE and Stolarski J (1993) New fish species in the Gulf of Gdansk, Neogobius spp. [cf. Neogobius melanostomus
(Pallas 1811)]. Bulletin of Sea Fisheries Institute 1: 83 Slatkin M (1995) A measure of population subdivision based
on microsatellite allele frequencies. Genetics 139: 457–462 Stepien CA and Kocher TD (1997) Molecules and
morphology in studies of fish evolution, In: Kocher, TD and Stepien, CA (eds) Molecular Systematics of Fishes, pp. 1–11. Academic Press, San Diego, CA
Stepien CA, Hubers, AN and Skidmore, JL (1999) Diagnostic genetic markers and evolutionary relationships among invasive dreissenoid and corbiculoid bivalves: phylogenetic signal from mitochondrial 16S rDNA.Molecular Phyloge-netics and Evolution 13(1): 31–49
Stepien CA, Taylor CD and Dabrowska KA (2002) Genetic variability and phylogeographic patterns of a nonindige-nous species invasion: a comparison of exotic versus native zebra and quagga mussel populations. Journal of Evolu-tionary Biology 15(2): 314–328
Stepien CA, Taylor CD, Grigorovich IA, Shirman SV, Wei, R, Korniushin, AV and Dabrowska, KA (2003) DNA and systematic analysis of invasive and native dreissenid mus-sels: is Dreissena bugensis really D. rostriformis? Aquatic Invaders 14(2): 8–18
Stepien CA, Brown JE, Neilson ME and Tumeo MA (2005) Genetic diversity of invasive species in the Great Lakes
versus their Eurasian Source Populations: Insights for risk
analysis. Risk Analysis (Blackwell Sci.) (in press)
Swofford DL, (2003) PAUP*: Phylogenetic Analysis using Parsimony (*and other methods), vers. 4.0b 10. Sinauer Associates, Inc., Sunderland, MA
Swofford DL, Olsen GJ, Waddell PJ and Hillis DM (1996) Phylogenetic inference. In: Hillis DM, Moritz C and Mable BK (eds) Molecular Systematics, 2nd edn, pp. 407–514. Sinauer Assoc., Sunderland, MA
US EPA (1998) Guidelines for Ecological Risk Assessment, Risk Assessment Forum, Washington, DC. US Environ-mental Protection Agency, EPA-630-R-98-002F
Vasil’eva ED, Vasil’yev, VP and Pinchuk VI (1993) [Cranio-logical analysis of the goby subgenusPonticolaIljin, 1927. III. Comparative morphological study of Neogobius
kessleri,N.ratanand additional data onN. syrmanin
con-nection with the diagnostic features and composition of the subgenusPonticola]. Voprosy Ikhtiologii 33(5): 609–617 [in Russian]
Weir BS (1996) Genetic Data Analysis II. Sinauer Assoc., Sunderland, MA
Williamson M (1996) Biological Invasions. Chapman and Hall, New York, NY
Wright S (1978) Evolution and the genetics of populations. Vol. 4 In: Variability. Within and Among Natural Populations. University of Chicago Press, Chicago, IL