CBI MARKET SURVEY
THE TOYS AND GAMES MARKET IN GERMANY
Publication date: August 2007
Report summary
This CBI market survey discusses the following highlights for the toys and games market in Germany:
• Consumption of traditional toys and games in 2005 was € 2.3 billion, an average annual decrease of 1.9% between 2001 and 2005. Compared to 2004, sales were down by 3.3%. • Germany is one of the largest EU markets with a share of 17%.
• Production in Germany is declining again after an increase in 2002; in particular, 2005 saw a sharp decrease to € 860 million.
• Imports of traditional toys fell to € 1.6 billion in 2005, compared to € 1.8 billion in 2004. However, this still includes a long-term average annual increase of 3.6% when compared to 2001.
• Developing countries supply the majority of all imports with 47%. However, most of these imports are sourced in China (almost 95%), which is the number one supplier to Germany. • Other DC countries showing growth were India (17.8%); Tunisia (12.8%); Philippines
(10.8%); Pakistan (9.4%).
• Product groups which offer opportunities are infant and pre-school, early learning and construction sets.
This survey provides exporters of toys and games with sector-specific market information related to gaining access to Germany. By focusing on a specific country, this survey provides additional information, complementary to the more general information and data provided in the CBI market survey ‘The toys and games market in the EU’, which covers the EU market in general. That survey also contains an overview and explanation of the selected products dealt with, some general remarks on the statistics used, as well as information on other available documents for this sector. It can be downloaded from http://www.cbi.eu/marketinfo.
1 Market description: consumption and production Consumption
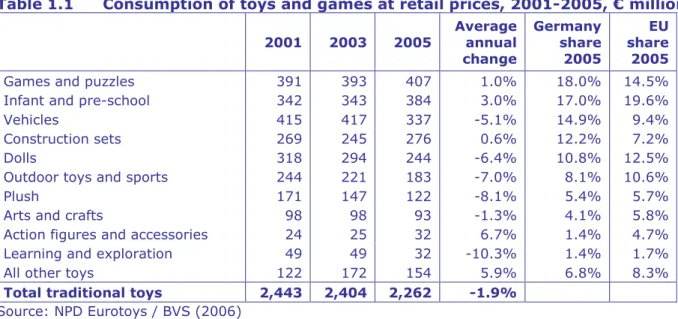
Total sales of traditional toys and games fell from € 2.4 billion in 2001 to under € 2.3 billion in 2005, an average annual decrease of almost 2%, and a decrease of 3.3% on 2004. Germany is one of the largest consumer markets for toys and games in the EU, with 17% of total EU consumption, ranking third after the UK and France. Table 1.1 shows details for the various industry product groups adapted from the NPD Eurotoys data at retail prices. Preliminary data for 2006 show sales falling further by 1.8%. For the ensuing years, sales of traditional toys are expected to improve, improved economic growth and slightly higher birth rates being offset by general trends in the toy industry such as ‘kids growing younger earlier’. Furthermore, German parents are less likely to indulge their kids than the British, Danish or Austrian do.
Germany lives up to its reputation of being a country of engineers: the sales of vehicles, € 337 million or 15%, and construction sets, € 276 million or 12%, are significantly higher than the European averages (9% and 7%). Games and puzzles similarly have a much higher share of the market. Sales of infant and pre-school toys have picked up speed in the past five years, growing yearly by 3% on average since 2001 in a declining market. They are now at par with the EU market share of this group. Sales of dolls have taken a plunge (-6%) and their share is now much lower than the EU average.
Table 1.1 Consumption of toys and games at retail prices, 2001-2005, € million 2001 2003 2005 Average annual change Germany share 2005 EU share 2005
Games and puzzles 391 393 407 1.0% 18.0% 14.5%
Infant and pre-school 342 343 384 3.0% 17.0% 19.6%
Vehicles 415 417 337 -5.1% 14.9% 9.4%
Construction sets 269 245 276 0.6% 12.2% 7.2%
Dolls 318 294 244 -6.4% 10.8% 12.5%
Outdoor toys and sports 244 221 183 -7.0% 8.1% 10.6%
Plush 171 147 122 -8.1% 5.4% 5.7%
Arts and crafts 98 98 93 -1.3% 4.1% 5.8%
Action figures and accessories 24 25 32 6.7% 1.4% 4.7%
Learning and exploration 49 49 32 -10.3% 1.4% 1.7%
All other toys 122 172 154 5.9% 6.8% 8.3%
Total traditional toys 2,443 2,404 2,262 -1.9% Source: NPD Eurotoys / BVS (2006)
Video games
Though not present in the above table, sales of video games have grown strongly during the past five years. This trend came to a stop during the past three years, with sales stabilizing at around € 850 million. Sales are expected to have risen again in 2006 after the introduction of the new games consoles by the leading manufacturers. This trend will continue in 2007. Market segments
The most important segmentation in the toy market is by age and gender. Kids play with different toys in different age groups, and there is a clear distinction between toys for girls and toys for boys.
In 2005, the total number of children in Germany was 11.8 million, an average annual decrease of 1.8% since 2001. As it has 11% of the EU youth, Germany is one of the large member states. The number of kids will decline strongly during the next five years, while the number of kids between 0-5 year is 86% of the number of kids between 10-14 years. This is lower than the EU average of 89%, indicating an even stronger downfall in the number of kids than generally in the EU. During 2005, girls accounted for 48.7% of the child population. Table 1.2 Age groups 0 - 14 years, 2001 - 2005, thousands of kids
Age group: 2001 2003 2005 Average annual change 2005 share Average EU share 0 - 4 years 3,918 3,764 3,614 -2.0% 30.7% 32.1% 5 - 9 years 4,045 3,995 3,972 -0.5% 33.7% 32.6% 10 - 14 years 4,734 4,529 4,202 -2.9% 35.6% 35.4% Total 0 - 14 years 12,698 12,289 11,787 -1.8% Source: Eurostat (2007)
Age and gender are the most defining elements for toys and games. On average, 27% of toys and games is given to 0-3 year olds; 61% to kids in the ages 4 to 11; and 12% to kids of 12 years and older.
Germany has a large population of immigrants, the majority consisting of people with a Turkish or Central European background.
Trends in consumption
• The average expenditure on toys and games per child in the age group of 0-14 years was € 192 in 2005. This is higher than the EU average of € 168.
• Kids typically have about € 4.00 weekly pocket money (Duracell survey). • 60% of all sales is realised during the Christmas season.
• Germany is a very large market with diverse consumption patterns. Especially Eastern Germany (the former DDR) has significantly lower income and spending power.
• Kids in Germany are more technically oriented than in most other European countries. Construction toys are popular as well as (model) vehicles and electric trains. The latter category has, however, been witnessing falling sales in recent years.
• Increased popularity of toys with electronic content, ranging from toy cell phones which make sounds and music, to dolls and figures which can speak, move and react.
• Price competition is driven by cheap imports and large importers and distributors. Production
The second largest producer of toys and games in the EU saw production fall annually by 1.8% on average between 2001 and 2005. Total production reached € 860 million in the last year, down € 148 million in the last two years. The German Toys Association DVSI values the production higher at € 1,119 million in 2005, with sales down 9% compared to 2004. The difference in total production is mostly the result of the incorporation of different product groups in their statistics. The overall trend is similar to that seen in table 1.3, with production decreasing considerably in the past two years as a result of continued outsourcing and a weak local market. This downfall is expected to continue, albeit at a slower pace.
Most of the decline in production can be attributed to the product group models and trains, which used to be the largest single product group, but which has sharply falling domestic production. Between 2001 and 2005, the annual rate of decline was almost 15%. Dolls and plush are falling considerably as well. Apart from lower demand, especially for model trains, this is caused by competition from China and production outsourcing.
Table 1.3 Production of toys and games (manufacturers’ prices) 2001-2005, € million 2001 2003 2005 Average annual change Share 2005
Models and trains 319 307 170 -14.6% 19.7%
Outdoor 121 101 78 -10.3% 9.1%
Construction sets 57 51 69 4.6% 8.0%
Plush 80 63 53 -9.8% 6.2%
Learning - 45 48 0.0% 5.6%
Animal and fantasy 41 38 44 1.7% 5.1%
Dolls 19 26 11 -12.8% 1.2%
Games and puzzles - - - 0.0% 0.0%
Motorised toys 5 - - -100.0% 0.0%
Mechanical toys - - - 0.0% 0.0%
Other toys 283 376 388 8.2% 45.1%
Total traditional toys 924 1,008 860 -1.8% Source: Eurostat Prodcom (2007)
Trends in production
• Outsourcing is still important for most German toy companies, though most production has already been transferred to China and countries in Eastern Europe. Outsourcing remains a competitive business in which contract are evaluated regularly.
• Production of wooden toys constituted 8.2% of total production in 2005, which is quite high compared to other EU countries. Production increased 1.2% annually during the past four years. Production of plastic toys was limited to € 75 million in 2005.
• The production of dolls and plush toys continues to drop.
• The licensing of characters and themes continues to grow in importance. Interesting players
• Ravensburger - http://www.ravensburger.com - puzzles and board games. revenue in 2005 of € 234 million.
• Playmobil / Brandstatter - http://www.playmobil.com - revenue in 2005 of € 361 million. • Zapf Creations - http://www.zapf-creation.com - dolls - revenue in 2005 of € 141 million. Deutscher Verband Spielwaren-Industrie (DVSI), the Association of the German Toy Industry, has on their website a list of many German manufacturers of toys and games, ranked in alphabetical order (http://toy.de/show150.html). Their main product range, address and website are displayed per company. Choose ‘Hersteller’ on the main page.
Opportunities and threats
Trends and market developments offer opportunities and threats to exporters. A given trend can be a threat to some and an opportunity to others at the same time, e.g. the increasing popularity of electronic toys can offer opportunities for manufacturers in that field, but be a threat to producers of plush toys. The following trends should therefore always be analyzed in relation to your specific circumstances. Refer to chapter 7 of the CBI market survey covering the EU for further information.
+ Product groups which offer opportunities are infant and pre-school, early learning and construction sets.
+ Individual product groups with strong growth were electric car racing games (+35.3% average annual change between 2001 and 2005, 1.8% share in 2005); ride-ons (+5.8%, 6.4%); non-mechanical toys of plastic (+5.7%, 31.1%); construction sets of wood (+3.9%, 4.1%).
+ Outsourcing is still popular among German manufacturers, though many of the most important companies already source a significant share of their production in China.
+ It can be worthwhile to apply for the ‘Spiel Gut’ (‘sound toy’) certificate if your toy or game has educational or pedagogical merits, and is produced within the, quite strict,
specifications. Application is not free - http://www.spielgut.org/.
+ Green consumerism and Fair Trade is still on the rise, offering possibilities for products within that category and fulfilling the requirements posed.
For more information, ‘Fair spielt’ - http://www.fair-spielt.de - Prices have been falling in the past two years.
- Domestic production of wooden toys has been increasing strongly in the past five years. Local consumption does not seem to have increased at a similar rate.
- Video games remain the most important competitor of traditional toys. Useful sources
• Deutscher Verband Spielwaren-Industrie (DVSI) - http://www.toy.de - apart from the above mentioned list of manufacturers, the site contains freely available market and production data from NPD Eurotoys.
• Toyscene / Branchenbrief International - http://www.toyscene.de • Woek-Web - http://www.woek-web.de/ - extensive market figures
• NPD Eurotoys - http://www.npd.com - the most important supplier of market information about toys and games in the European Union.
• Duracell, the battery company, publishes an annual survey on toys in various European countries. The results for Germany can be retrieved at
• Kids Verbraucher Analyse -
http://www.ehapamedia.de/pdf_download/KVA06_Praesentation.pdf - research on kids’ preferences and media usage by Egmont Ehapa Verlag.
• ICEX - the Spanish export promotion council - http://www.icex.es - extensive analysis of the German market analysis (in Spanish).
• Eurostat statistical data from the Prodcom database -
http://fd.comext.eurostat.cec.eu.int/xtweb/ - it is possible to register for free in order to make large data collections.
• Top 10 toys - http://www.top10spielzeug.de - competition promoting the industry, participation is expensive and only possible for the larger companies. Still it gives an indication of new products on the market.
2 Trade channels for market entry Trade channels
The most likely partner is an importing distributor or an importer. Especially in a large country like Germany there are many of these. Typically they can be differentiated in three groups: the top-level importer dealing with recognized international brands; the smaller professional
importer/distributor who takes his business very seriously, loves high-quality toys, has many contacts and aims for long-lasting relationships; the small, more opportunity-oriented
importers, who take chances as they come and who will only put in an effort if they see a expect a quick profit. Of course, it is dependent on your product characteristics which of these will suit you. The first category will not be of interest. The second category can be of interest if you have a well-defined and well-designed line of products which offers opportunities once established in a market. The last category is the least secure, but will work for you as long as you remain competitive. However, this type of importer is often the one making an initial market entrance possible.
Distributors - purchasing organisations
The big buying groups play an important role in Germany. They control a large part of the retail market and act as direct importers. They tend focus on the major brands but have their own portfolio of companies as well. Vedes and Idee+Spiel recently formed an alliance in order to combine the development of private label products so as to be able to compete with
hypermarkets and discounters.
• VEDES Group - purchasing organisation - 1100 members - € 620 million turnover - http://www.vedes.com - store concepts include Spielzeug Ring.
• Idee+Spiel - purchasing organisation - 874 members - € 440 million turnover - http://www.idee-und-spiel.de
• Spiel & Spass - purchasing organisation - 400 members - € 300 million turnover - http://www.spiel-und-spass.de
• Duo Schreib + Spiel - purchasing organisation - 300 members - http://www.duo-shop.de Retail
Toy specialist stores have traditionally had a very strong position and have been able to consolidate this. However, this is only applies to traditional toys. When buying video games and consoles, customers move to different places, mainly to electronics stores, but also to department stores and hypermarkets and discounters. Toy specialist stores have less than 10% of that segment. As yet, pure web shops have not been very successful. Strategies of existing shops and mail-order companies have better chances, because of existing brand recognition, warehouses and regular funds.
Dominant actors are small toy specialist stores (‘Spielwaren Facheinzelhandel’) which are members of one of the large buying groups: Vedes (14.6% market share in 2005), Idee+Spiel (12.7%); Spiel und Spass (5.8%) and duo Schreib und Spiel. The total turnover of specialist stores was € 1.1 billion in 2005, which is 36% of the market. Further specialists are large surface retail chains like Toys ‘R’ Us (6.5%) or Rofu. The turnover of specialist chains was € 330 million in 2005, with Toys ‘R’ Us leading the field. Department stores like Karstadt and Kaufhoff together account for € 380 million. Other stores, like cash & carry (2.4%) discounters (5.5%); supermarkets/hypermarkets (14%) and mail order supply the remainder.
Table 2.1 Retail distribution of toys, share in % per channel 2001 2003 2005
Average annual change
Toy specialists 41.0% 42.0% 41.8% 0.5%
Hyper markets & supermarkets 15.2% 16.2% 14.2% -1.7%
General merchandise 5.5% 5.2% 5.5% 0.0%
Department stores 15.7% 15.6% 15.7% 0.0%
Mail order / Internet 8.0% 6.8% 6.7% -4.3%
Other 14.6% 14.2% 17.1% 4.0%
Source: NPD (2007 and earlier)
• See above the stores of the four main purchasing chains VEDES, Idee+Spiel, Spiel & spass, duo Schreib + Spiel; together their members operate just under 3,000 shops. • Rofu - specialist chain - 70 shops - http://www.rofu.de
• Toys 'R' us - international specialist chain - 55 shops - http://www.toysrus.de/
• BR Toys - international specialist chain - 11 shops - http://www.top-toy.com - Danish toy company Top-Toy has entered the market with 11 shops
• Karstadt - department stores - 189 shops - € 215 million turnover - http://www.karstadt.de - part of the KarstadtQuelle group
• Kaufhoff - department stores - € 200 million turnover - http://www.galeria-kaufhof.de • Mueller - general merchandise stores - 226 shops - http://www.mueller.de
• Otto Versand - mail order and online sales - € 70 million turnover - http://www.otto.de/spielwaren
• Quelle - mail order and online sales - € 80 million turnover - http://www.quelle.de - part of the KarstadtQuelle group
Contract manufacturing and outsourcing
Germany has an important toy manufacturing industry with several large, but many small toy companies. It is particularly difficult for the latter to compete on the extremely competitive international market. Companies are being squeezed between the heavily marketed products of multinationals and the cheap imports from China. These companies could offer opportunities for outsourcing. The buying organisations, purchasing departments of retail chains and large distributors and wholesalers furthermore offer opportunities for contract manufacturing of private label products and unbranded toys. See ‘production’ in section 1 for links, or use the useful sources mentioned below.
Price structure
Margins vary widely. Discount products have lower margins than branded products and retailers aiming at large volumes have lower margins than specialist shops, still the following are some general indications. The total mark-up from manufacturer’s price to final consumer price including VAT can easily reach 400%, especially when taking into account costs of logistics.
Average margin
o Agent 2-5%
o Wholesaler 30-40%
o Retail 50-100%
Selecting a suitable trading partner
Sources mentioned below offer leads to companies active in the trade of toys and games. Trade fairs are the most common way to get in contact with possible customers and offer the ability to showcase your company and get informed about the competition. The type of organisation which suits your company best is dependent on your product range and target group. For more information, refer to Chapter 3 of the CBI market survey ‘Toys and games market in the EU’. It is advisable to make an analysis of the type of trade partners your competitors use and find whether they are suitable for you.
It can be difficult for a small exporter to get into direct contact with one of the larger retail chains or buying groups without have established an export reputation. It is therefore
recommended that you focus your initial attention on finding an importing distributor or agent. The higher the quality of your product the better the quality of an interested distributor will be. Be careful in your selection though, for instance, do not commit yourself to exclusivity without being sure about the reputation of the distributor and agreed commitment to the promotion of your products.
Useful sources
• BVS - National Association of Toys Retailers -
http://www.einzelhandel.de/servlet/PB/menu/1002043/index.html - 4,000 members. • DVSI, the Association of the German Toy Industry - http://toy.de/show150.html - list of
top manufacturers (see as well above).
• Woek-Web / Aktion Fair Spielt - http://www.woek-web.de/ - list of manufacturers • Gesamtverband des Deutschen Spielwaren Gross- und Aussenhandels (Association of
German toy wholesalers and importers) - no website - located in Nuremberg - telephone +49-0911 224188.
3 Trade: imports and exports Imports
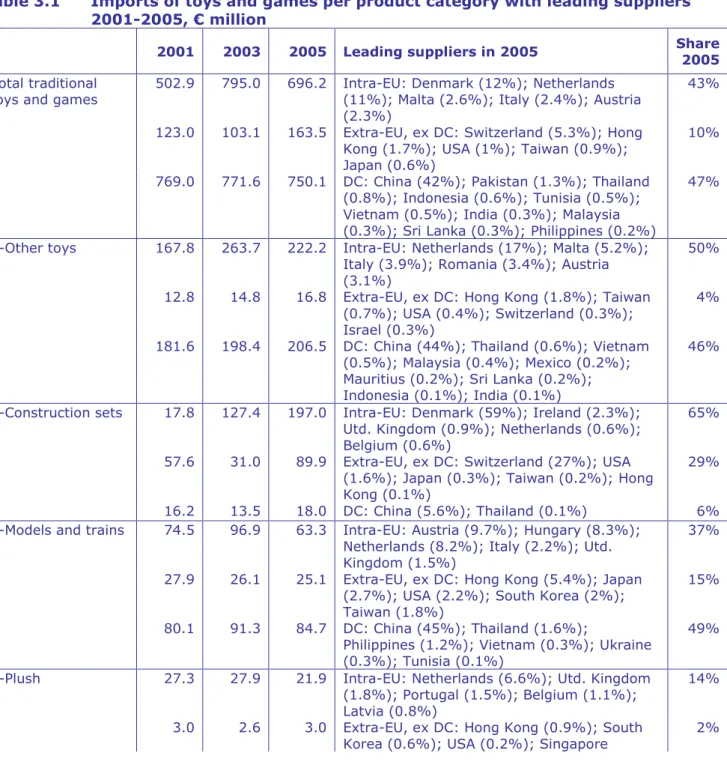
After a high in 2004 of € 1.8 billion, imports of traditional toys fell to € 1.6 billion in 2005, though this was still a significant average annual increase of 3.6% compared to 2001.
Germany remains one of the top EU importers, and imports are expected to increase over the next few years as a result of falling and outsourced production. Imports from EU member states grew especially strongly during that period, with an average annual increase of 8.5%. Important suppliers are Denmark (LEGO) and The Netherlands, though the latter consists mostly of re-exports of goods originating in China, as The Netherlands does not have a significant toys industry.
The share of developing countries of total imports was 47% (€ 750 million) in 2005. This is lower than the EU average, which was 52% in 2005. The growth of DC imports was, at an average annual decrease of 0.6% during the past four years, lower than the EU average increase of 3%.
The main supplying developing countries were China (42%); Pakistan (1.3%); Thailand (0.8%); Indonesia (0.6%); Tunisia (0.5%); Vietnam (0.5%); India (0.3%); Malaysia (0.3%); Sri Lanka (0.3%); and Philippines (0.2%) Imports from China were therefore lower than average in the EU (48%).
The share of Chinese imports shows a downward trend, moving from 49% in 2001 to 42% in 2005. DC countries showing growth were India (17.8% growth); Tunisia (12.8%); Philippines (10.8%); and Pakistan (9.4%).
Imports by product group
In 2005, the most important product categories were other toys (share of 28%, +5.3% average annual growth); construction sets (19%, +35%); models and trains (11%, -1.3%); plush (9.6%, -4.4%).
The imports of all wooden toys decreased by 1.8% on average during period covered. At € 20 million, wooden toys imports are now as high as 1.2% of all traditional toys sold. The imports of plastic toys increased by 10% on average during period covered. Total imports of plastic toys were € 713 million (44.3%) in 2005.
The imports of video games increased by 27.2% on average during period covered. At € 644 million, video games now has imports as high as 40% of all traditional toys sold. This does include a dip in imports in 2004.
Table 3.1 Imports of toys and games per product category with leading suppliers 2001-2005, € million
2001 2003 2005 Leading suppliers in 2005 Share 2005 Total traditional
toys and games
502.9 795.0 696.2 Intra-EU: Denmark (12%); Netherlands (11%); Malta (2.6%); Italy (2.4%); Austria (2.3%)
43%
123.0 103.1 163.5 Extra-EU, ex DC: Switzerland (5.3%); Hong Kong (1.7%); USA (1%); Taiwan (0.9%); Japan (0.6%)
10%
769.0 771.6 750.1 DC: China (42%); Pakistan (1.3%); Thailand (0.8%); Indonesia (0.6%); Tunisia (0.5%); Vietnam (0.5%); India (0.3%); Malaysia (0.3%); Sri Lanka (0.3%); Philippines (0.2%)
47%
1-Other toys 167.8 263.7 222.2 Intra-EU: Netherlands (17%); Malta (5.2%);
Italy (3.9%); Romania (3.4%); Austria (3.1%)
50%
12.8 14.8 16.8 Extra-EU, ex DC: Hong Kong (1.8%); Taiwan
(0.7%); USA (0.4%); Switzerland (0.3%); Israel (0.3%)
4%
181.6 198.4 206.5 DC: China (44%); Thailand (0.6%); Vietnam (0.5%); Malaysia (0.4%); Mexico (0.2%); Mauritius (0.2%); Sri Lanka (0.2%); Indonesia (0.1%); India (0.1%)
46%
2-Construction sets 17.8 127.4 197.0 Intra-EU: Denmark (59%); Ireland (2.3%);
Utd. Kingdom (0.9%); Netherlands (0.6%); Belgium (0.6%)
65%
57.6 31.0 89.9 Extra-EU, ex DC: Switzerland (27%); USA
(1.6%); Japan (0.3%); Taiwan (0.2%); Hong Kong (0.1%)
29%
16.2 13.5 18.0 DC: China (5.6%); Thailand (0.1%) 6%
3-Models and trains 74.5 96.9 63.3 Intra-EU: Austria (9.7%); Hungary (8.3%);
Netherlands (8.2%); Italy (2.2%); Utd. Kingdom (1.5%)
37%
27.9 26.1 25.1 Extra-EU, ex DC: Hong Kong (5.4%); Japan
(2.7%); USA (2.2%); South Korea (2%); Taiwan (1.8%)
15%
80.1 91.3 84.7 DC: China (45%); Thailand (1.6%);
Philippines (1.2%); Vietnam (0.3%); Ukraine (0.3%); Tunisia (0.1%)
49%
4-Plush 27.3 27.9 21.9 Intra-EU: Netherlands (6.6%); Utd. Kingdom
(1.8%); Portugal (1.5%); Belgium (1.1%); Latvia (0.8%)
14%
3.0 2.6 3.0 Extra-EU, ex DC: Hong Kong (0.9%); South
Korea (0.6%); USA (0.2%); Singapore
2001 2003 2005 Leading suppliers in 2005 Share 2005 (0.1%); Taiwan (0.1%)
155.2 133.8 130.2 DC: China (72%); Indonesia (5.4%); Vietnam (2.2%); Tunisia (2%); Sri Lanka (0.9%); Thailand (0.8%); Mauritius (0.2%); India (0.2%); Egypt (0.1%)
84%
5-Outdoor 48.2 51.0 42.6 Intra-EU: Netherlands (9.7%); Italy (8.8%);
France (4.1%); Belgium (3.6%); Romania (1.8%)
33%
3.2 2.6 2.8 Extra-EU, ex DC: Taiwan (1.4%); Hong Kong
(0.3%); USA (0.3%); South Korea (0.1%)
2%
92.2 103.3 83.4 DC: China (42%); Pakistan (16%); Thailand
(3.3%); India (2.7%); Vietnam (0.5%); Philippines (0.2%); Indonesia (0.1%)
65%
6-Dolls 24.9 46.5 41.0 Intra-EU: Netherlands (18%); Malta (14%);
France (1.2%); Utd. Kingdom (1.1%); Latvia (0.9%)
38%
3.7 2.5 3.5 Extra-EU, ex DC: Hong Kong (1.6%); USA
(0.6%); Taiwan (0.5%); Switzerland (0.3%); Japan (0.1%)
3%
113.9 81.2 63.2 DC: China (57%); Mauritius (0.5%); Thailand
(0.4%); Indonesia (0.3%); Philippines (0.1%); India (0.1%); Vietnam (0.1%); Sri Lanka (0.1%)
59%
7-Motorized toys 10.9 19.9 14.0 Intra-EU: Netherlands (8%); Austria (2.3%);
Malta (1.5%); Spain (0.7%); Italy (0.6%)
15%
6.4 9.0 12.5 Extra-EU, ex DC: Taiwan (4.7%); Hong Kong
(3.8%); Japan (2.8%); South Korea (1.4%); USA (0.7%)
14%
50.3 62.2 65.0 DC: China (67%); Malaysia (2%); Philippines (1.4%); Vietnam (0.1%)
71% 8-Games and
puzzles
49.0 76.8 47.0 Intra-EU: Netherlands (29%); Czech Rep.
(13%); Belgium (11%); Utd. Kingdom (3.7%); Romania (2.6%)
65%
3.9 10.0 5.4 Extra-EU, ex DC: USA (5.1%); Hong Kong
(0.6%); Canada (0.5%); Japan (0.5%); Taiwan (0.4%)
7%
5.3 6.7 20.2 DC: China (27%); Malaysia (0.2%); Sri Lanka (0.2%); Turkey (0.1%); Thailand (0.1%)
28% 9-Animal and
fantasy
22.3 35.0 20.5 Intra-EU: Netherlands (12%); France (3.8%); Utd. Kingdom (2.8%); Belgium (2.3%); Malta (1.5%)
31%
2.3 1.9 2.3 Extra-EU, ex DC: Hong Kong (2.3%); USA (0.7%); Taiwan (0.2%); Japan (0.1%); Switzerland (0.1%)
3%
50.5 46.8 44.0 DC: China (57%); Tunisia (6.3%); Thailand (1%); Sri Lanka (0.5%); Vietnam (0.4%); Indonesia (0.1%)
66%
10-Mechanical toys 33.9 31.1 14.5 Intra-EU: Romania (16%); Netherlands
(15%); Denmark (5.8%); Italy (3.5%); Belgium (1.9%)
45%
0.8 1.7 1.2 Extra-EU, ex DC: Hong Kong (1.5%); Taiwan
(0.9%); Switzerland (0.6%); USA (0.4%); Norway (0.1%)
4%
9.2 13.9 16.2 DC: China (49%); Thailand (1.4%); Colombia
(0.4%); India (0.2%); Malaysia (0.1%)
51%
11-Learning 26.3 18.7 12.2 Intra-EU: Netherlands (21%); Slovakia
(4.7%); Italy (3.4%); Austria (3%); Czech Rep. (1.4%)
38%
2001 2003 2005 Leading suppliers in 2005 Share 2005 Singapore (1.1%); USA (0.3%); Taiwan
(0.3%); Japan (0.1%)
14.5 20.6 18.5 DC: China (51%); Sri Lanka (4.4%); Thailand
(1.5%); Indonesia (0.6%); Vietnam (0.3%); India (0.3%); Malaysia (0.2%); Turkey (0.1%)
58%
Source: Eurostat (2007)
Product categories with an above average supply from developing countries (apart from China) were animal and fantasy; learning; outdoor; plush; wooden toys. Important developing
countries are Pakistan (outdoor category), Thailand (outdoor, models and trains) and Indonesia (plush).
Exports
Exports of traditional toys reached € 1.1 billion in 2005, an increase of 6.6% between 2001 and 2005. Germany is one of the largest EU exporters.
Total exports consisted of the following product categories: other toys (31% share in 2005, +9% average annual change between 2001 and 2005); construction sets (17.3%, +43.2%); models and trains (15%, -1.3%); plush (7.4%, -0.9%); games and puzzles (7%, +13%); outdoor (5.9%, -2.4%); dolls (4.8%, -4.3%); animal and fantasy figures (4.7%, +0.9%); motorised toys (3.1%, +16.8%); mechanical toys (2.5%, -5.6%); learning (1.3%, -12.6%). Exports of wooden toys were € 22 million in 2005, a decrease of 10.5% between 2001 and 2005. Exports of the various plastic toys reached € 427 million in 2005, an increase of 15.3% between 2001 and 2005.
The product categories with the strongest growth of exports were construction sets (+43.2% average annual growth between 2001 and 2005, 17.3% share in 2005); motorised toys (+16.8%, 3.1%); games and puzzles (+13%, 7%); other toys (+9%, 31%).
Opportunities and threats
+ Germany has a considerable trade deficit, indicating a dependency on imports from other countries to satisfy its demand.
+ Imports increased substantially during the period reviewed.
+ The individual product groups showing strongest import growth were: other construction sets (+73% annual growth, share of 0.9%); construction sets of plastic (+36%, 17%); electric car racing games (+29%, 1.7%); ride-ons (+13%, 2.5%); inflatable balls (+12%, 3.1%).
- Most of the imports are sourced in China, making it difficult to compete on the market, though some other supplying countries are making good progress.
Useful sources
• EU Expanding Exports Helpdesk
http://export-help.cec.eu.int go to: trade statistics • Eurostat - official statistical office of the EU
http://epp.eurostat.cec.eu.int go to ‘themes’ on the left side of the home page
go to ‘external trade’ go to ‘data - full view’ go to ‘external trade - detailed data’ or go directly to http://fd.comext.eurostat.cec.eu.int/xtweb/
• An informative source on the German market, including import and export statistics is http://www.toy.de
4 Prices developments
According to NPD / Eurotoys, the average price for toys and games in Germany fell from € 16.20 in 2001 to € 15.30 in 2005. Especially in 2004, a sharp decrease was visible. Table 4.1 shows the average import values offset by import volumes. The resulting cost per tonne per category, gives an indication of the average import prices for a category. DC imports tend to be much cheaper than intra-EU imports. It is also clear that the costs of imports from developing countries are decreasing quite strongly, while prices of imports sourced in the EU25 are increasing. There are fundamental differences for price variations and developments for the individual product groups. The price level of total imports is 14.3% higher than the EU average. In 2005, the cost per tonne of imports from DCs was 73% of the cost per tonne for imports from EU25 countries. A comparison between countries is given in chapter 5 of the CBI market survey ‘The toys and games market in the EU’.
Table 4.1 Cost per tonne and change of value of import volumes per product category, 2005: € per tonne, 2001-2005: % change
Import cost per tonne in 2005
Change of import cost 2001-2005
Value/Volume Total From
EU25 From DC Total From EU25 From DC
Animal and fantasy figures 7,388 10,595 6,378 -4.5% 4.4% -7.6%
Construction sets 12,100 13,753 5,604 4.3% 18.3% -9.0%
Dolls 7,258 11,260 5,859 -4.2% -10.7% -6.5%
Games and puzzles 5,356 5,326 4,796 -2.1% -2.5% 2.4%
Learning 4,528 4,203 4,836 -3.4% -3.4% -5.7%
Mechanical toys 4,469 4,639 4,230 -5.1% -1.8% -15.4%
Models and trains 11,694 14,634 9,180 -3.4% 3.1% -5.6%
Motorised toys 8,435 12,543 7,132 -3.6% -0.4% -4.6%
Outdoor 5,457 5,838 5,323 -8.2% -4.1% -10.1%
Plush 8,764 9,981 8,557 -4.7% -7.1% -4.3%
Other toys 5,605 6,463 4,862 -2.3% 1.3% -5.2%
Total traditional toys 7,211 8,282 6,025 -2.4% 3.6% -6.7% Source: Eurostat (2007)
Useful sources
• Kelkoo - http://www.kelkoo.de - check ‘Spiel & Hobby’ • Vedes shop - http://www.toys.de
• Karstadt - http://www.karstadt.de - check ‘Spiele’ • Toys ’R’ Us - http://www.toysrus.de
The websites of the retailers and wholesalers mentioned in section 2 often offer prices for their product range as well.
5 Market access requirements
As a manufacturer in a developing country preparing to access Germany, you should be aware of the market access requirements of your trading partners and the Germany government. Requirements are demanded through legislation and through labels, codes and management systems. These requirements are based on environmental, consumer health and safety and social concerns. You need to comply with EU legislation and have to be aware of the additional non-legislative requirements that your trading partners in the EU might request.
For information on legislative and non-legislative requirements, go to ‘Search CBI database’ at http://www.cbi.eu/marketinfo, select toys and games and Germany in the category search, click on the search button and click on market access requirements.
For information on packaging, marking and labelling applicable, please refer to the CBI market survey ‘The toys and games market in the EU’. Additional information on packaging can be found at the website of ITC on export packaging:
• http://www.intracen.org/ep/packaging/packit.htm
Information on tariffs and quota can be found athttp://export-help.cec.eu.int/ 6 Doing business
General information on doing business like approaching potential business partners, building up a relationship, drawing up an offer, handling the contract (methods of payment, and terms of delivery) can be found in CBI’s export manuals ‘Export Planner’ and ‘Your image builder’. More specific information regarding the toy industry in CBI’s ‘From survey to success: Guidelines for exporting toys and games to the EU’. Section 4 of this publication focuses on export marketing tools.
Trade fairs continue to be the most important place for business, in Germany the most important one is the Nuremberg Toy Fair. Only in special cases will your first visit be an success. Often it takes several years to establish relations and start serious business. For that reason, it is worthwhile to visit the trade fair a couple of years, building up contacts, before reserving an expensive booth for yourself.
It is necessary to have an update portfolio of products and, if applicable, production skills and possibilities. Without such documents your company will not be considered seriously by EU companies.
It can be worthwhile to try contacting EU companies directly, for instance by mail with your product catalogue and a special offer, though this must be followed by personal communication afterwards, and companies need to be selected carefully on matching product ranges and target groups. Otherwise these efforts will be wasted. Local companies can be found through the websites listed in this survey below.
Having made contact with parties in Europe, it is vital to remain in contact with them. Good communications are essential for doing business, this includes the initial stage of building a relationship, as well as later, having established a trade, in order to keep the other partner committed.
Trade associations
• German association for the toy industry (DVSI) - http://www.toy.de • Association of German model train manufacturers - http://www.dvhm.de • Association of the German sport goods industry - http://www.bsi-ev.de
• Association of German sport goods retailers - http://www.vds-sportfachhandel.de More trade associations are listed in section 2. Many smaller and regional associations also exist, especially regarding distribution.
Trade fairs
• Spielwarenmesse - http://www.spielwarenmesse.de - Europe’s largest and most important professional toy fair
• Kind und Jugend - http://www.kindundjugend.de - professional fair aimed at all products relating to kids
• The large international trade fairs are also of importance to the German trade, these include Hong Kong, Shanghai and, to a lesser degree, New York. See the market survey covering the EU for details.
Trade press
• Nostheide Verlag - http://www.nostheide.de - publisher of
o Branchenbrief - http://www.toyscene.de/ - bi-weekly newsletter - one of the most important sources of market information - German
o BB-Jahresbericht - annual compendium of market information - German
o Spielmittel - http://www.nostheide.de/spielmittel/ - aimed at parents - German o Spielbox- http://www.spielbox-magazin.de - leading games magazine
• Spielzeug International - http://www.itm-si.de - with English and German pages • Furthermore, many specialist and niche publications exist, for instance aimed at model
trains. Useful sources
Cultural awareness is a critical skill in securing success as an exporter.
• Information on cultural differences in the EU can be found in chapter 3 of CBI’s export manual ‘Exporting to the EU’. This manual can be downloaded from:
http://www.cbi.eu/marketinfo go to search publications.
Websites providing practical tips on business culture and etiquette in Germany:
• http://www.kwintessential.co.uk/resources/global-etiquette/germany-country-profile.html • http://www.buyusa.gov/germany/en/294.pdf
Babelfish - http://babelfish.altavista.com - online translation of German into English and other languages.
This survey was compiled for CBI by VLI