1
16
Cosmology
16.1 Epochs of the Big Bang
16.2 Observation of Radiation from the Primordial Fireball
16.3 Spectrum Emitted by a Receding Blackbody
16.4 Ripples in the Microwave Bath
What Caused the CMB Ripples? The Horizon Problem
Inflation
Sound Waves in the Early Universe
16.5 Other Evidence for the Expanding Universe
Evidence from Observational Astronomy
Hubble and Company Observe Galaxies
What the Hubble Telesope Found New Evidence from Exploding Stars Big Bang Nucleosynthesis
Critical Density,m, and Dark Matter 16.6 Freidmann Models and the Age of
the Universe
16.7 Will the Universe Expand Forever? 16.8 Problems and Perspectives Chapter Outline
O
ne of the most exciting and rapidly developing areas in all of physics is cosmology, the study of the origin, content, form, and time evolution of theUniverse. Initial cosmological speculations of a homogeneous, eternal, static
Universe with constant average separation of clumps of matter on a very large scale were rather staid and dull. Now, however, proof has accumulated of a sur-prising expanding Universe with a distinct origin in time 14 billion years ago! In the past 50 years interesting and important refinements in the expansion rate (recession rate of all galaxies from each other) have been confirmed: a very rapid early expansion (inflation) filling the Universe with an extremely uniform distribution of radiation and matter, a decelerating period of expan-sion dominated by gravitational attraction in which galaxies had time to form yet still moved apart from each other, and finally, a preposterous application of the accelerator to the cosmic car about 5 billion years ago so that galaxies are currently accelerating away from each other again. In this chapter we ex-plore the experimental evidence for these ideas. We also speculate on the causes of a slower or faster expansion rate. These include familiar forms of matter and energy as well as unusual forms like dark cold matter and dark en-ergy, which produces gravitational repulsion.
16.1 EPOCHS OF THE BIG BANG
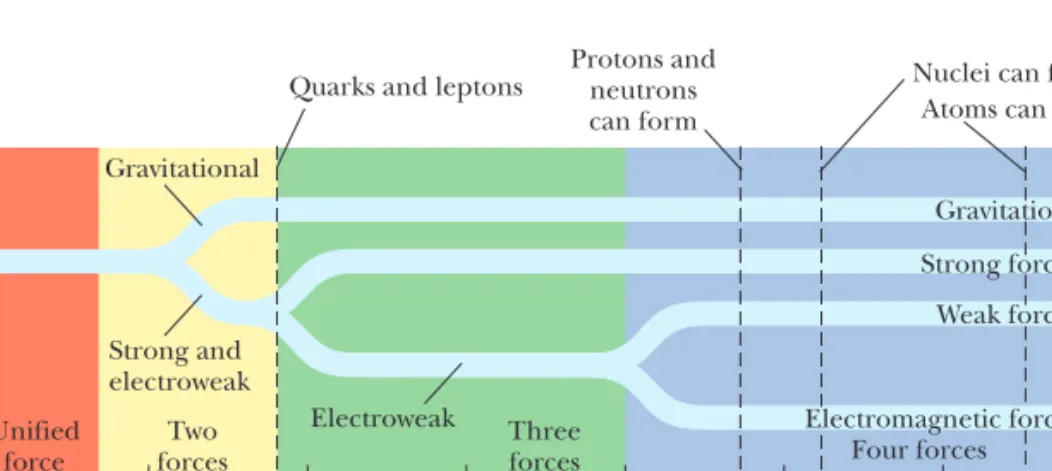
In this chapter we describe one of the most fascinating theories in all of science — the Big Bang theory of the creation of the Universe — and the ex-perimental evidence that supports it. This theory of cosmology states that the Universe had a beginning and erupted from an extremely dense, pointlike sin-gularity about 14 billion years ago.1 Such an extreme of energy occurred in the first few instants after the Big Bang that it is believed that all four interac-tions of physics were unified and that all matter melted down into an undiffer-entiated “quark-gluon primordial soup.”
Figure 16.1 shows the evolution of the four fundamental forces from the Big Bang to the present. During the first 1043s (the ultrahot epoch during which T1032K), it is presumed that the strong, electroweak, and gravitational forces were joined to form a completely unified force. In the first 1035s fol-lowing the Big Bang (the hot epoch, T1029K), gravity broke free of this uni-fication while the strong and electroweak forces remained joined. This was a period when particle energies were so great (1016GeV) that very massive par-ticles such as those predicted by Supersymmetry (see Section 15.12) as well as quarks, leptons, and their antiparticles existed. Then, after 1035s, the Uni-verse rapidly expanded and cooled (the warm epoch, T1029to 1015K) and the strong and electroweak forces parted company. As the Universe continued to cool, the electroweak force split into the weak force and the electromagnetic force about 1010s after the Big Bang. After a few more minutes, protons and neutrons condensed out of the cooling quark-gluon plasma.
During the first half-hour of creation, the temperature was probably about 1010K and the Universe could be viewed as a cosmic thermonuclear bomb fus-ing protons and neutrons into deuterium and then helium, producfus-ing most of
10–40 10–30 10–20 10–10 100 1010 1020
Quarks and leptons
Protons and neutrons
can form Atoms can form
Nuclei can form
Unified force
Two forces
Three
forces Four forces
Age of the Universe (s) Present age
of Universe Big Bang Gravitation Strong force Weak force Electromagnetic force Gravitational Strong and electroweak Electroweak
Figure 16.1 A brief history of the Universe from the Big Bang to the present. The four forces became distinguishable during the first nanosecond. Following this, all the quarks combined to form particles that interact via the nuclear force. However, the lep-tons remained separate and to this day exist as individual, observable particles.
1Data from the Wilkinson Microwave Anisotropy Probe in 2003 pinpointed the age of the
Universe at 13.7 0.2 billion years (“WMAP Spacecraft Maps the Entire Cosmic Microwave Sky with Unprecedented Precision,” Physics Today,April 2003, 56(4): pp. 21 – 24.)
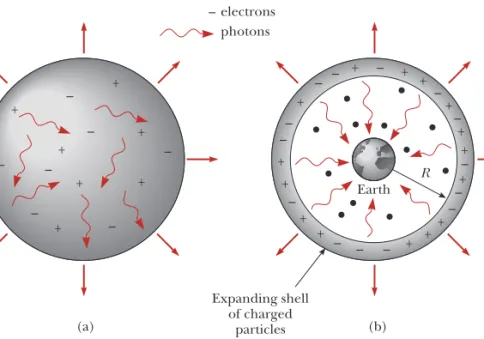
the helium nuclei that now exist. (See Fig. 16.2.) Until about 400,000 years after the Big Bang, the Universe was dominated by radiation. Energetic pho-tons prevented matter from forming clumps, or even single hydrogen and he-lium atoms, because photon-atom collisions would instantly ionize any atoms that happened to form. In addition, photons experienced continuous Comp-ton scattering from vast numbers of free electrons, resulting in a universe that was opaque to electromagnetic radiation. By the time the Universe was about 400,000 years old — it had expanded to one-thousandth of its current size and cooled to about 3000 K — electrons could bind to protons and helium nuclei to form atoms. Because of the drastic reduction in free charged particles, far fewer photons were absorbed or scattered, and the Universe suddenly became transparent to photons. Radiation no longer dominated the Universe, and clumps of neutral matter steadily grew — first atoms, then molecules, gas clouds, stars, and finally galaxies. The state of affairs for radiation- and matter-dominated periods is shown in Figure 16.3.
16.2 OBSERVATION OF RADIATION FROM THE PRIMORDIAL FIREBALL
In 1965, Arno A. Penzias and Robert W. Wilson of Bell Laboratories were testing a sensitive microwave receiver and made an amazing discovery. A pesky
16.2 OBSERVATION OF RADIATION FROM THE PRIMORDIAL FIREBALL 3
Figure 16.2 George Gamow, 1904 – 1968, Russian-American physicist. Gamow and two of his students, Ralph Alpher and Robert Herman, were the first to take the first half-hour of the Universe seriously. In a mostly overlooked paper published in 1948, they made truly remark-able cosmological predictions. They correctly calculated the abundances of hydrogen and helium after the first half-hour (75% H and 25% He) and pre-dicted that radiation from the Big Bang should still be pre-sent, with an apparent tempera-ture of about 5 K. In Gamow’s own words, the Universe’s sup-ply of hydrogen and helium were created very quickly, “in less time than it takes to cook a dish of duck and roast pota-toes.” The comment is charac-teristic of this interesting physi-cist, who is known as much for his explanation of alpha decay and his theories of cosmology as for his delightful popular books, his cartoons, and his wonderful sense of humor. A classic Gamow story holds that, having coauthored a paper with Alpher, he made Hans Bethe an honorary author so that the credits would read “Alpher, Bethe, and Gamow” (to resem-ble the Greek letters , , and ). (AIP Emilio Segre Visual Archives) + – (a) – – + + + + + + – – – – + – H atoms
protons, deuterium and helium nuclei electrons photons Earth R (b) Expanding shell of charged particles + – – + – + + – – – + + + – – + – + + – + – + + – + – – +
Figure 16.3 Radiation- and matter-dominated stages in the evolution of the Universe. (a) The radiation-dominated stage (T3000 K, age 400,000 years) is an expanding Universe filled with protons, electrons, neutrons, photons, and neutrinos. Charged par-ticles continually scatter photons, ensuring thermal equilibrium of radiation and mat-ter. (b) The matter-dominated state (T 3000 K, age 400,000 years). Hydrogen atoms form, making the Universe transparent to photons. Photons emitted from an ex-panding ion shell at R≈14 billion lightyears are currently seen on Earth enormously Doppler-shifted to the red.
signal that produced a faint background hiss was interfering with their satellite communications experiments. Despite their valiant efforts, the signal remained. Ultimately it became clear that they were detecting microwave back-ground radiation (at a wavelength of 7.35 cm) that represented some of the leftover electromagnetic “glow” from the Big Bang.
The microwave horn that served as their receiving antenna is shown in Figure 16.4. The intensity of the detected signal remained unchanged as the antenna was pointed in different directions. The fact that the radiation had equal strengths in all directions suggested that the entire Universe was the source of this radiation. Booting a flock of pigeons from the 20-foot horn and cooling the microwave detector both failed to remove the “spurious” signal. Through a casual conversation, Penzias and Wilson discovered that a group at Princeton had predicted the residual radiation from the Big Bang and were planning an experiment to confirm their theory. The excitement in the scien-tific community was high when Penzias and Wilson announced that they had already observed an excess microwave background of a 3-K blackbody source, which was the predicted temperature of the cooled, residual Big Bang radia-tion at the present time.
Because Penzias and Wilson took their measurements at a single wave-length, they did not completely confirm the radiation as 3-K blackbody radia-tion. One can imagine the excitement in the late 1960s and 1970s as experi-mentalists fought obscuring atmospheric absorption and, point by point, added intensity data at different wavelengths. The results shown in Figure 16.5, which include precise measurements taken around the maximum inten-sity wavelength of 0.1 cm by the Cosmic Background Explorer Satellite (COBE), unambiguously confirm that the radiation is that of a black body at 2.7 K. Figure 16.5 is probably the most clear- cut evidence that the Big Bang
Figure 16.4 Robert W. Wilson (left) and Arno A. Penzias with the Bell Telephone Laboratories horn-reflector antenna. (AIP Emilio Segre Visual Archives/Physics Today Collection)
occurred. It also presents the earliest view of the Universe, a much earlier view than that available with the largest optical and radio telescopes. The 1978 Nobel Prize was awarded to Penzias and Wilson for their important discovery.
16.3 SPECTRUM EMITTED BY A RECEDING BLACKBODY Since the observed 3-K blackbody spectrum is the single strongest piece of evi-dence for the Big Bang theory of the Universe, it is important to examine this topic in more detail. In particular, we want to show what happens to a black-body spectrum in an expanding Universe.
Consider blackbody radiation from the Big Bang at the time when the Uni-verse first became transparent to photons, 400,000 years after the Big Bang (ABB). Recall from Chapter 3 that the wavelength distribution for blackbody radiation is
(3.20) where u(,T)d is the energy per unit volume of the radiation with wave-length between and demitted by a blackbody at temperature T. Sup-pose that between then (400,000 years ABB) and now (14,000,000,000 years ABB), the Universe has expanded and a photon of original wavelength is
u(,T)d 8hc
5
1
ehc/kBT1
d16.3 SPECTRUM EMITTED BY A RECEDING BLACKBODY 5
10–2 100 102 104 106 108
Radiant energy density per wavelength inter
val (eV/m 3 /m) 0.01 0.1 1 10 100 Wavelength (cm) Penzias and Wilson
Figure 16.5 Theoretical blackbody (brown curve) and measured radiation spectra (blue points) of the Big Bang. Most of the data were collected from the Cosmic Back-ground Explorer (COBE) satellite. The datum of Penzias and Wilson is indicated.
now Doppler-shifted to , where is longer than . Our question is: What happens to the form of the original wavelength distribution u(,T) d?
Let f(,T) dbe the current energy per unit volume of the residual Big Bang radiation as measured from the Earth. Since the shell of charged parti-cles that emitted the radiation is moving away from the Earth at extremely rel-ativistic speed (Fig. 16.3), we must use the relrel-ativistic Doppler shift for light from a receding source to relate to . As shown in Chapter 1, Example 1.6, this connection is
(16.1) where vis the speed of recession of the charged shell. For our purposes, Equa-tion 16.1 may be written more simply as
(16.2) which shows that the present wavelength is greater than the original
wave-length by the factor . (Equation 16.2 may be
generalized to mean that all distances in the Universe have grown by a factor of F since 400,000 years ABB.) To find the relation between the currently observed spectrum f(,T)d and the original blackbody distribution u(,T)d, we substitute /F into the expression for u(,T)d:
or
(16.3) where T T/F. We can identify the right side of Equation 16.3 as a (current) blackbody spectrum f(,T)dbecause it has the standard functional form of a blackbody spectrum with wavelength and temperature T. Thus we can write Equation 16.3 as
(16.4) where f(,T)dhas the explicit form
(16.5) with T T/F. Equation 16.4 shows that the radiation from a receding blackbody still has the same spectral distribution, but its temperature Tdrops by a factor of F and its energy per unit volume decreases by a factor of F4. In a frame of reference moving with the charged particles that last scattered the radiation, the characteristic temperature of the radiation is about 3000 K. Using the current observation of a 3-K cosmic background from Earth, and substituting into FT/T, we find F3000 K /3 K1000. This means distances in the Universe have grown by a factor of 1000 since 400,000 years ABB and that the speed of recession from the Earth of the charged shell which emitted the radiation is very high.
f(,T)d 8hc ()5
1 ehc/kBT1d u(,T)d F4 f(,T)d u(,T)d F4 8hc ()5 1 ehc/kBT1d u(,T)d 8hc 5 1 ehc/kBT1d 8hc (/F)5 1 ehc/(F)kBT1 d F F√1(v/c)/√1(v/c) F √1(v/c) √1(v/c)Exercise 1 Find the speed of recession from the Earth of the charged shell that emit-ted the cosmic background radiation.
Answer 0.999998 c
16.4 RIPPLES IN THE MICROWAVE BATH
The discovery of the cosmic microwave background (CMB) radiation bathing the Earth brought with it a problem, however — the radiation was too uniform. Scientists believed that slight fluctuations in the temperature of the CMB from spot to spot in the sky had to occur in order to act as nucleation sites for the for-mation of the galaxies, stars, and planets that now exist. In 1992, George Smoot (b. 1945), an American astronomer at the Lawrence Berkeley Laboratory, found, by carefully analyzing data collected by COBE, that the background was not perfectly uniform as was first thought, but instead contained irregularities that corresponded to temperature variations of 1 part in 100,000. While varia-tions of this size may seem insignificant, temperature variavaria-tions of just this size have been shown by computer simulation to lead to the galaxy clusters we see to-day.2 The Wilkinson Microwave Anisotropy Probe (WMAP), launched in June 2001, has provided the most definitive data to date showing that distinct hot and cold spots in the CMB have angular sizes precisely predicted by cosmological theory. (See Fig. 16.6.) Additionally, WMAP has confirmed the composition of the Universe at different epochs as well as the geometry of the Universe.
What Caused the CMB Ripples?
The hot and cold spots in the CMB are believed to correspond, respectively, to density compressions and rarefactions (sound waves) in the gaslike system of
16.4 RIPPLES IN THE MICROWAVE BATH 7
2See “Reading the Blueprints of Creation,” by Michael A. Strauss, Sci. Am.,February 2004. Figure 16.6 A “baby picture” of the Universe taken when it was only 380,000 years old. The Earth is at the center of this celestial sphere and red corresponds to warmer regions and blue to colder. (NASA/WMAP SCIENCE TEAM)
photons, electrons, protons, and neutrons of the radiation-dominated era when radiation was trapped by matter. About 380,000 years ABB, the Universe became transparent to radiation, and photons could travel in straight lines for billions of lightyears without scattering. Photons emitted from compressed hot areas were more energetic than those from rarified cooler areas, and when these photons reached the Earth, after a straight-line trip of 45 billion lightyears, they preserved the information about the hot and cold spots pro-duced by sound waves in the early Universe. This explanation, however, just pushes the cause of the CMB ripples back one step, since it is natural to ask what produced the sound waves in the first place. Here, we must invoke the concept of inflation, already introduced in 1981 by Alan H. Guth (b. 1947, American physicist) to explain an important difficulty with the Big Bang the-ory called the horizon problem.
The Horizon Problem. The horizon problem is the issue of the causal con-nectedness shown by the uniform temperature of the entire CMB when, in fact, any two points in the sky separated by more than 1 degree (about twice the Moon’s diameter) contain CMB radiation from regions of the universe that
were causally disconnected at 380,000 years ABB. That is, extrapolating the
paths of photons from points 2 degrees apart in the sky backwards, using the known expansion rate of the Universe, results in a separation of the photons’ points of origin such that a signal would have to travel at about 10 times the speed of light to correlate the behavior of the two regions. This dilemma is called the horizon problem since the limit of the region we can observe — our horizon — is defined by signals traveling at the speed of light. Thus it is diffi-cult to understand the uniform temperature of the CMB to 1 part in 100,000 on the basis of the standard Big Bang theory. What we are left with is that by sheer coincidence all the causally disconnected regions of the early universe happento have a homogeneous density and temperature.
Inflation
In 1981, Guth proposed a more natural solution to this problem, the theory of inflation.3The theory of inflation states that at about 1035s ABB the Universe
went through a period of rapidly accelerating expansion for about 1032s and
exponentially increased in size with time.It is thought that after inflation the
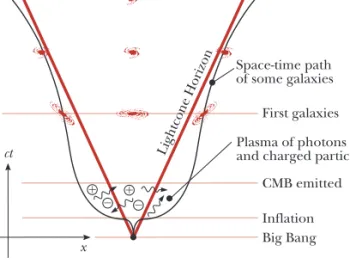
volume of the Universe had increased about 10100 times more than it would have if it had expanded at the standard expansion rate. This solves the hori-zon problem because before inflation, the matter and radiation were so closely packed together that collision processes would easily keep matter and radiation in equilibrium, producing uniform density and temperature in the CMB-emitting postinflation early Universe. It is most interesting that inflation occurred so rapidly it actually outpaced the speed of light, and sections of the Universe grew out of contact with each other during inflation. When inflation ended, the expansion decelerated, and regions of the Universe came back into each other’s view. This situation is shown schematically in Figure 16.7 in terms of a space-time diagram (introduced in Section 1.7). Figure 16.7 shows the plasma of photons and charged particles of the radiation-dominated era
expanding far beyond the horizon (lightcone) during inflation, with different regions dropping out of each others’ view. Note that after inflation ended and the expansion decelerated, some of these regions came back into view. Finally, the current accelerating expansion is also suggested by showing some present galaxies moving past the horizon and out of each others’ view again.
The full predictive power of the theory of inflation is really only seen, how-ever, when it is realized that it also provides answers to several other deep problems that had been troubling cosmologists. One unsolved mystery was the observation that the present Universe seemed to obey Euclidean geometry (sum of the angles of a triangle is 180°— one says the Universe is “flat”) over immense distances, which meant that at about 1 s ABB the Universe had to be exquisitely flat, precariously balanced in mass to a precision of about 1 part in 1015. While standard Big Bang theory gives no reason why the Universe started off in such an unusual way, inflationary theory does — inflation drives an arbi-trarily curved Universe to such a flat state that the presently observed Universe would still appear flat. This occurs in much the same way that blowing up a balloon (enough) causes a fixed area on the balloon’s surface to approach flatness to any desired degree. Another puzzle facing physicists was the failure to detect magnetic monopoles in spite of extensive experimental searches. (There is strong theoretical evidence that these very massive stable particles should have been abundantly produced in the Big Bang.) Inflation solves this dilemma by showing that magnetic monopoles were so thinly spread out by the enormous inflationary expansion that their calculated density in the part of the Universe we can presently observe is below detectable limits.
The cause of inflation is believed to be a new kind of quantum field, the in-flaton, which carried the potential energy needed to cause the rapid expan-sion and trigger sound waves in the early Universe. Furthermore, a consistent theory has been developed that directly relates microscopic quantum fluctua-tions in the inflaton field to observed macroscopic CMB temperature varia-tions. This is a theory that essentially shows that inflation magnified quantum
16.4 RIPPLES IN THE MICROWAVE BATH 9
ct Big Bang x Inflation CMB emitted Space-time path of some galaxies First galaxies Now
Lightcone Horizon Plasma of photonsand charged particles
Figure 16.7 A schematic diagram of the inflationary expanding universe. The space-time diagram shows periods of deceleration and acceleration in the cosmic expansion during which some galaxies move in and out of the observable region of the universe.
fluctuations into the temperature variations we see in the CMB today. Al-though describing this theory in detail is beyond the scope of this chapter, we can describe in a crude way how the pattern of sound waves inferred from the temperature variations in the CMB fit into inflationary theory.
Sound Waves in the Early Universe
Because inflation triggered sound waves with different frequencies all at the same time of 1035 s ABB, the waves are believed to have all started out in phase and oscillated throughout the radiation-dominated era for 380,000 years. If this was the case, astronomers should be able to measure the strengths of the fundamental and overtones — the power spectrum — in the acoustic oscillations of the early Universe in a process similar to that of mea-suring the sound spectrum of a musical instrument. In the case of the CMB, cosmologists measure the magnitude of temperature variations versus the an-gular size of hot and cold spots to get the power spectrum. When these mea-surements are made, a series of peaks with different strengths are found, agreeing with the predictions of inflationary theory in strength and fre-quency and confirming that all sound waves were indeed generated at the same moment by inflation.
Another success of inflationary theory applied to the radiation-dominated era is proof that the Universe obeys Euclidean geometry. Since cosmologists can precisely calculate the length of the fundamental sound wave in the early Universe (f0is measured, the velocity of sound vin the plasma is known, and
v/f0), and the distance CMB photons have traveled to the Earth from op-posite ends of the fundamental is known, the sides of a triangle, literally as big as all outdoors, are known, and the sum of its angles can essentially be checked. When this is done, it is found that space is indeed quite flat or Eu-clidean, in agreement with other types of measurement.
16.5 OTHER EVIDENCE FOR THE EXPANDING UNIVERSE Evidence from Observational Astronomy
Most of the key discoveries supporting the theory of an expanding Universe, and indirectly the Big Bang theory of cosmology, were made in the 20th cen-tury. In 1913, Vesto Melvin Slipher (1875 – 1969), an American astronomer working at the Lowell Observatory, reported that most spiral galaxies4were re-ceding from the Earth at speeds up to several million miles per hour. Slipher was one of the first to use the methods of Doppler shifts in spectral lines to measure velocities. The key to this method is to locate in galactic spectra the characteristic lines of some element whose wavelengths have been measured on Earth. The speed of the receding galaxy (for recession speeds small com-pared to c) is then directly proportional to the wavelength shift to the red, as shown in Figure 16.8. The symbol Z is used by astronomers to denote the
4This was before Hubble had figured out what galaxies really were, very distant “island universes”
consisting of billions of stars. In Slipher’s time, galaxies with spiral arms were called spiral nebu-lae (nebunebu-lae are glowing clouds of gas and dust), since individual stars in the glowing clouds could not be distinguished.
measured redshift of receding astronomical objects, where
(16.6)
0 is the emission wavelength of a particular line measured in the lab, and is the measured wavelength of the same line in a receding galaxy. Slipher found that the number Z was positive in most cases and had the same value for all lines in the spectrum of a particular galaxy. In general, redshift Zis related to galaxy recession velocity v by the relativistic Doppler shift expression (Eq. 16.1), which is frequently written in the form
(16.7)
vcan be explicitly given in terms of Zas
(16.8) vc
Z 22Z Z22Z2 Z√
cv cv 1 Z 0 016.5 OTHER EVIDENCE FOR THE EXPANDING UNIVERSE 11
GALAXY PHOTO VIRGO URSA MAJOR CORONA BOREALIS BÖTES HYDRA DISTANCE IN LIGHT-YEARS 78,000,000 1,000,000,000 1,400,000,000 2,500,000,000 3,960,000,000 RED-SHIFTS 1,200 km/s 15,000 km/s 22,000 km/s 39,000 km/s 61,000 km/s
Figure 16.8 Redshift of the H and K lines of calcium for five galaxies. Redshifts are expressed as speeds c(/). Calibration spectra taken in the laboratory appear above and below each galaxy’s spectrum.
Slipher’s measurements of galactic speeds were quite accurate, but the distances to the galaxies were virtually unknown, although there was some indication that more - distant objects had higher recessional speeds.
Shortly after Slipher’s discovery, a flowering of ideas occurred in theoretical cosmology. In 1916, Einstein published his general theory of relativity (a new theory of gravity replacing Newton’s), in which he formulated the differential equations connecting the distribution of matter in the Universe with the cur-vature of space-time. Einstein solved these equations and found that in order to have a Universe static in time,5he had to add a “cosmic repulsion” force be-tween galaxies characterized by a cosmological constant,. This was a rather unusual force, since it was independent of mass and grew stronger with in-creasing galaxy separation. In the same year, the Dutch mathematician and as-tronomer Willem de Sitter found another static solution to Einstein’s equa-tions. This solution predicted an increasing redshift for lines emitted by more-distant objects. De Sitter’s solution stirred much interest because it seemed capable of being confirmed experimentally.
Major breakthroughs in the cosmological problem came in 1922 and 1924 when Alexander Friedmann,6 (1888 – 1925, Russian mathematician), showed that two nonstaticmodels were predicted by Einstein’s field equations of general relativity: an expanding Universe, called an open Universeand a contracting Universe, called a closed Universe. At first Einstein found it difficult to ex-change the eternal, steady, static Universe for an expanding, dynamic Universe that presumably had a beginning in time. He wrote to de Sitter, “This circum-stance of an expanding Universe irritates me” and “to admit such possibilities seems senseless.”7 However, by 1933 Einstein was finally convinced of the im-peccable logic of Friedmann’s arguments. Any remaining doubt about the non-static nature of the Universe was erased by the powerful experimental results of American astronomers Edwin P. Hubble (1889 – 1953) and Milton Humason (1891 – 1972) on the redshifts of distant nebulae (see Figs. 16.9 and 16.10). We return to a consideration of Freidmann’s important work, the foundation of current cosmology theory based on general relativity, in Section 16.6.
Hubble and Company Observe Galaxies
Hubble first established that spiral nebulae (distant clouds of glowing gas and dust) were actually composed of billions of stars, and then went on to measure
5The average distance between clumps of matter on a large scale is constant with time.
6Freidmann was an amateur meteorologist and balloonist who taught Gamow relativity theory.
Gamow reported that meteorology killed Freidmann, since he died of a severe chill and pneumo-nia following one of his meteorological balloon flights.
7There has been much scientific irritation over expanding Universe theories. Presumably the
irri-tation derives from the fact that the Big Bang theory places the cause of creation beyond the reach of physical investigation. Fred Hoyle (b. 1915, an English astronomer) has never accepted the Big Bang theory and prefers instead a steady-state model of the Universe in which matter is created out of nothing at a rate necessary to compensate for the increasing distances between vis-ible galaxies. Others have expressed their irritation as follows:
Sir Arthur Eddington: “I have no axe to grind in this discussion but the notion of a beginning is repugnant to me . . . I simply do not believe that the present order of things started off with a bang . . . The expanding Universe is preposterous and incredible; it leaves me cold.” Walter Nernst: “To deny the infinite duration of time would be to betray the very foundation of science.”
Phillip Morrison: “I find it hard to accept the big bang theory. I would like to reject it.” Allan Sandage: “It is such a strange conclusion. . . . It cannot really be true.”
Figure 16.9 Milton L. Huma-son (1891 – 1972). He and Ed-win Hubble did the most to demonstrate the expanding Universe experimentally. The two astronomers present an in-teresting contrast. Humason was originally a mule-team driver and janitor at Mount Wil-son. He taught himself astron-omy and became a consummate experimentalist. (Photo by Mar-garet/AIP Emilio Segre Visual Archives)
their distances. By 1923, he had already determined that the Andromeda neb-ula was more than 1 million lightyears distant, well beyond the 100,000-lightyear extent of our own Milky Way galaxy. Hubble measured the distances to nearby galaxies, or “island universes,” by observing the brightness of stars with fluctuating intensity, called cepheid variables. Since the intrinsic luminosity, L, the total electromagnetic energy radiated per second, was known from the period of light fluctuations, Hubble used the observed intensity flux, f, the en-ergy per second per unit area in some frequency band received at the detec-tor, and energy conservation to find the distance, R:
(16.9) In the late 1920s, Hubble made the bold assertion that the entire Universe was expanding. From 1928 to 1936, he and Humason toiled at Mount Wilson to prove this assertion until they reached the limits of the 100-inch telescope. The results of their work and its continuation on a 200-inch telescope in the 1940s showed that the recession velocity, v, of a galaxy increases in direct pro-portion to its distance Rfrom us (Fig. 16.11). This linear relationship, known
as Hubble’s law,may be written
(16.10) where H0, Hubble’s constant,has the currently accepted value
H023 106(km/s)/ lightyear vH0R
f L
4R2
16.5 OTHER EVIDENCE FOR THE EXPANDING UNIVERSE 13
Figure 16.10 Edwin P. Hubble (1889 – 1953). Hubble was born to wealth, graduated from the University of Chicago, and was a Rhodes Scholar, lawyer, athlete, soldier, and astronomer with an unerring eye for important problems in astronomy. (© Bettmann/CORBIS)
with an uncertainty of about 25%. This large uncertainty is produced by the great difficulty of measuring distances to far-off galaxies and galaxy clusters. The amazingly simple form of Hubble’s law follows from the cosmological principle, which states that the Universe is isotropic (has the same average fea-tures — mass density, expansion factor, and so on — in any direction) and ho-mogeneous (has the same average features at any position) when large enough
volumes of the Universe are sampled. If we consider several equally spaced
galaxies in a line moving at nonrelativistic velocities away from us in an ex-panding Universe, we easily find Hubble’s law. (See Problem 2.) So, Hubble’s law is a direct and expected consequence of an expanding homogeneous Universe.
The use of the term Hubble’sconstant for H0is a bit misleading since H0 is constant with distance but varies slowly with time because gravity or other forces (so-called vacuum repulsion or dark energy), respectively, slow down or speed up the expansion of the Universe as time progresses. We can gain more insight into the meaning of Hubble’s law and show that Hubble’s “constant” is a function of time by introducing the universal expansion scaling factor,a(t), which is the same anywhere in the Universe. a(t) is defined by the equation
(16.11) where R(t) is the distance from Earth to some receding galaxy, R0is the cur-rent separation in some appropriate length unit, and a(t) is the dimensionless scaling factor with the present time denoted t0, and a(t0)1. Differentiating
R(t)R0a(t)
Distance (109 lightyears)
Recession velocity (thousands of km/s)
0 1 2 3 4 5 0 10 20 30 40 50 60 70 Hydra Boötes Corona Borealis Ursa Major Virgo
Figure 16.11 Hubble’s law: The recession velocity of a galaxy is directly proportional to distance out to at least 5 billion lightyears. The five galaxies shown in Figure 16.8 are plotted here.
Equation 16.11 with respect to time and substituting for R0 from 16.11, we find
(16.12) where v, R, a, and are all functions of time. Finally, comparing 16.12 to the general form of Hubble’s law written as
v(t) H(t)R(t) (16.13)
we find
(16.14) Equation 16.14 shows that His the time derivative of ln aand that agenerally depends on time except in the case of exponential expansion (inflation), a(t) = Aebt. (See Problem 4.) Further, 16.14 shows that His proportional to the
first derivative with respect to time of a. Another parameter, q(t), the
decelera-tion parameter,determines the second derivative of aand tells whether the
ex-pansion is slowing down or speeding up with time.8 Hand qcan be used to construct a first-order approximation to the function a(t), but in general one needs to measure an infinite set of time derivatives of a(t) or the function it-self to fully characterize a(t). We will further discuss this important scaling function, which describes the expansion of the Universe, in Section 16.6.
H(t) a˙(t) a(t) a˙ vR˙R0a˙ R a a˙
16.5 OTHER EVIDENCE FOR THE EXPANDING UNIVERSE 15
EXAMPLE 16.1
The basic form of Hubble’s law, vH0R, follows from as-suming that the Universe is undergoing a nonrelativistic uniform expansion and is homogeneous. (See Problem 2.) Thus this law in its basic form will begin to fail at some maximum distance, Rmax, at which the recessional
velocity is an appreciable fraction of the speed of light. Estimate the maximum distance at which Hubble’s law applies without relativistic correction by assuming that it fails when vc/4.
Hubble’s law can be corrected for relativistic effects, so that interesting departures from this law can be observed
such as accelerations and decelerations in the expansion of the Universe at different epochs.
Solution lightyears Rmax v H0 c 4H0 3.0105 km/s 80106 km/s/lightyear 410 9
New Evidence from Exploding Stars
Telescopes look farther back in time as they view more distant stars and galax-ies, so by looking at objects over as great a range of distances as possible we can establish the entire history of the expansion of the Universe. In particular, mea-suring the velocity (from redshift) and distance (from apparent brightness or flux) of astronomical objects over a wide range of distances gives the history of the expansion of the Universe. One can tell if the Universe departed from the
8The exact form of qis given by , where q 0 indicates the expansion is slowing
down and q 0 indicates the expansion is speeding up.
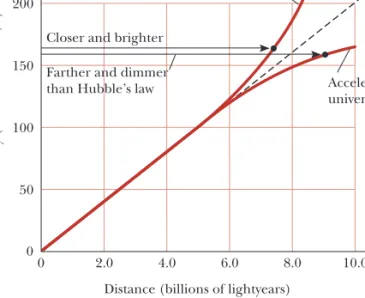
uniform expansion of space predicted by Hubble’s law and if the expansion accelerated or decelerated at different times by comparing the measured values of velocity and distance of astronomical objects to those predicted by Hubble’s law. For example, if the Universe is currently decelerating, the velocity of a very distant galaxy, determined from the redshift of light emitted by this galaxy in the early Universe, would be somewhat greater than the velocity predicted by Hubble’s law; see Figure 16.12. As can be seen from the figure, an equally valid signature of deceleration is that a galaxy with a given velocity will be closer and brighter than expected from Hubble’s law. Similarly, an accelerating expansion would cause galaxies in the early Universe to be more distant and dimmer than predicted by Hubble’s law, as shown in Figure 16.12.
Attempts to measure the distance to very distant galaxies and groups of galaxies in the second half of the 20th century in order to detect departures from Hubble’s law proved very uncertain, with great statistical scatter in data points. The failure of galaxies to act as standardized light sources at large dis-tances is now known to be caused by evolutionary changes in galaxies — early galaxies formed at 2– 5 billion years ABB have been shown to have different shapes and sizes compared to more current galaxies 9– 14 billion years ABB. Thus, galaxies are too variable in structure and intrinsic brightness over very long periods of time to serve as uniform markers of the expansion. However, a particular class of exploding stars undergoing “standardized” thermonuclear detonation are so bright, so uniformly luminous, and so well understood phys-ically that they serve as excellent tracers of the Universe’s expansion. These objects, as bright as 10 billion suns for a time, are called type Ia supernovae (SNe Ia) and are formed after the collapse of white dwarf stars. Since spectra from high-Z (Z 1)supernova are shifted into the near IR where obscuring emission from the Earth is high, supernovae chasers have had to use the Hubble Space Telescope (HST) to accumulate the best results on the history of cosmic expansion.
Distance (billions of lightyears)
Recession velocity (thousands of km/s)
0 10.0 0 200 150 100 50 Hubble’s law Accelerating universe Decelerating universe
Closer and brighter Farther and dimmer than Hubble’s law
8.0 6.0
4.0 2.0
Figure 16.12 Deviations from Hubble’s law (uniform expansion) for decelerating and accelerating expansions.
Two teams, one led by Saul Perlmutter (Supernova Cosmology Project)9 and one by Adam Riess (Space Telescope Institute Baltimore) have discovered most of the distant new Ia supernovae by surveying large sections of sky to lo-cate and measure the rising and falling light curves characteristic of SNe Ia. Figure 16.13a shows as-measured light curves (flux versus time) of SNe Ia with different Z’s, describing SNe located at different distances and having differ-ent recession velocities. Note that the width and peak values of the light curves are all greatly different. When the light curves are corrected for cosmic expan-sion, relativistic time dilation, intervening dust absorption, and instrumental effects, the light curves coalesce and show the same intrinsic peak luminosity and light curve width (Fig. 16.13b). This universal light curve shows that
16.5 OTHER EVIDENCE FOR THE EXPANDING UNIVERSE 17
Figure 16.13 (a) Light curves for SNe Ia at different distances moving with different recession speeds. (b) Universal light curve resulting from correction of the data shown in (a) for various factors, including cosmic expansion and time dilation. (Courtesy the Supernova Cosmology Project, supported by the Director, Office of Science, High Energy Physics, U.S. Department of Energy under Contract No. DE-AC03-76SF00098)
individual type Ia supernovae explosions are incredibly uniform and that SNe Ia are ex-cellent probes of cosmic history, resulting in distance and lookback time measurements with uncertainties of only about 5%. The correction to the light curve for cosmic expansion is made because the distance to the SN was 1/(1 Z) of its present value at the time of emission of light now seen as redshifted by Z. (So for a Z 1 SN, the SN was half its current distance when the light was emitted or the Universe was half its present linear size.) The relativistic time correction involves the same factor of 1Z. Because the SN was receding from us at high velocity at the time its light was emitted, we see the detonation slowed down by a factor of 1 Z ,which means that for a Z1 supernova, an explo-sion lasting 40 days in its rest frame appears to us to take 80.
What HST Found. The first results in 1998 showed that the light from SNe which had exploded around 9 billion years ABB was fainter than predicted by Hubble’s law. Consequently these objects were thought to be farther away than expected and that the expansion of the Universe was currently speeding up. Such a controversial finding immediately led to suggestions of other causes of the dimming, such as intergalactic dust, which would make the SNe seem far-ther away than they actually were. In 2002, a new imaging instrument installed on the HST called the Advanced Camera for Surveys greatly boosted Hubble’s
ability to find supernovae.Many more ancient SNe that exploded from 5 to 7
billion years ABB were located and measured, a real trick since there is only about one SN explosion per century in a large galaxy and such ancient SNe are very dim. The results conclusively show that the current acceleration is real, and that prior to about 9 billion years ABB, the expansion of the Universe was actually decelerating! Because dust filling intergalactic space would make distant (higher redshift) SNe dimmer yet, and the more-distant SNe are actually much brighter than the results predicted for dust and not dimmer, the latest results rule out dust. Figure 16.14 shows a plot of the departure of measured brightness of supernovae from what is expected at a specific redshift for a Universe governed by the freely expanding Hubble model. (Note that increasing redshift corresponds to decreasing time after the Big Bang, with Z= 0.5 corresponding to 9 billion years ABB and Z= 2 to about 3 billion years ABB.) The data points are averages of several measured SNe with the same redshift, and the curve through the points shows a transition from recent acceleration to past deceleration at about Z 0.5. Model curves showing constant acceleration (positive slope) and deceleration (negative slope) over the age of the Universe are seen to be definitely ruled out by the new high-Zmeasurements.
Big Bang Nucleosynthesis
Another important confirmation of Big Bang theory comes from the predic-tions of cosmic abundances of light elements made in the first half-hour after the Big Bang. When the equations of the hot Big Bang are combined with the well-understood physics of low - energy nuclear reactions, detailed predictions of the abundances of certain light elements emerge that are in good agree-ment with observed values. In addition, considerations of nucleosynthesis de-termine the amount of neutrons and protons in the Universe. Let’s investigate this in a little more detail.
George Gamow and his collaborators were the first to make serious calcula-tions of the production of elements following a hot Big Bang. In a series of pa-pers starting in 1946, they predicted that 75% of the observable mass in the Universe was hydrogen and about 25% was helium, cooked up in a Big Bang that they predicted should show residual blackbody radiation at a temperature of 5 K. They also calculated the changing neutron-to-proton ratio as a func-tion of time (this ratio is crucial in determining what reacfunc-tions occur) but were stymied in their attempts to show that allthe elements from H to U were made in the Big Bang by the occurrence of a mass 5 bottleneck. This means that at the temperature, pressure, and density calculated for the expanding Universe in the first few minutes, there were no mass number A5 nuclei formed for long enough times to allow A6 and heavier nuclei to be formed by combination with a neutron, proton, or other synthesized nuclei. It is now known that 98% of the observable mass in the cosmos in the form of hydro-gen, helium, and trace amounts of lithium was produced in the first few min-utes of the Universe. All heavier elements formed later in stellar interiors (ear-liest stars 0.3 billion years ABB) and were spit into interstellar space by supernovae detonations.10Although helium can indeed be produced in stars, calculations first made by Fred Hoyle and Roger Taylor in 1964 showed that if
16.5 OTHER EVIDENCE FOR THE EXPANDING UNIVERSE 19
Redshift Z Earlier Times 0.0 –1.0 +1.0 +0.5 0.0 –0.5 Constant acceleration Present acceleration, past deceleration Freely expanding Hubble model Constant deceleration
Relative brightness (magnitude)
Brighter Fainter 2.0 1.5 1.0 0.5
Figure 16.14 Observed brightness (flux) of supernovae relative to the brightness pre-dicted by Hubble’s law. The relative brightness is measured in terms of astronomical magnitude, which is smaller for brighter objects. Constant acceleration and decelera-tion of the cosmic expansion are indicated by the red and blue curves, respectively. The observed data points are best fit by the green curve, showing a transition from cur-rent acceleration to past deceleration at Z 0.5 and with cosmological parameters m 0.3, 0.7. The freely expanding Hubble line has m 0, 0.
10The answer to the mass 5 puzzle was found in 1952 by E. E. Salpeter, who showed that in the hot,
dense cores of red giant stars there is an unstable A 5 state which lasts barely long enough to make A 6 nuclei.
all the helium were made in stars, galaxies would be 10 to 100 times brighter than they are observed to be — thus confirming the primordial origin of cosmic helium.
The most important reactions considered in helium production at the tem-peratures and densities of the first few minutes ABB are
Current calculations of all the elements made in the first few minutes are quite sophisticated, involving shifting numbers of protons, neutrons, and other synthesized nuclei and hundreds of interdependent nuclear reactions of nuclei with As as high as 23. Figure 16.15 shows the results of such calcula-tions, starting from thermal equilibrium values of neutrons and protons and showing the production of hydrogen, helium, deuterium, lithium, and beryl-lium as a function of time and temperature in the early Universe. In particu-lar, most of the helium, deuterium, and lithium in the Universe today was pro-duced shortly after the Big Bang, and the observed abundances agree with the calculations shown in Figure 16.15.
2 1H31H9:42He10n 2 1H32He9:42He11H 2 1H21H9:31H11H 2 1H21H9:32He10n 1 1H10n9:21H 1012 1010 108 106 104 102 1 Protons Neutrons Neutrons 4 2He 10
Time (in seconds)
102 103 104
3 109 1 109 3 108 1 108
Temperature (kelvins)
Fraction of total mass
2 1H 2 1H 3 1H 3 2He 7 4Be 7 3Li 6 3Li
Figure 16.15 Light element abundances in the first minutes. (Courtesy of Robert Wagoner, Stanford University)
Critical Density, m, and Dark Matter
A final point on nucleosynthesis involves the strong dependence of calcu-lated abundances of deuterium, helium-3, and lithium-7 on the density of neutrons and protons at the time of formation of these three elements in the early Universe. Since the density of n p in the early Universe may be extrapolated forward by using the expansion factor of the Universe, we can obtain an estimate of the present cosmic mass density of neutrons and
pro-tons, which is difficult to measure directly. When this is done, one finds a
value of
Cosmologists designate the ratio of the observed effective mass density (mass
densityenergy density/c2) of the Universe to the calculated critical mass
density, c, by m obs/c. The critical density, c, is the calculated mass
density of the Universe needed to gravitationally halt the recession of one
galaxy from another at infinite separation.cdepends on the somewhat
uncer-tain value of H0 (see Example 16.2 below) and has the value
Thus the Big Bang model of nucleosynthesis predicts that the density of neutrons and protons (making up stars, black holes, intergalactic dust and gas — ordinary matter) is only 1% – 10% of the critical density. Even the ef-fective gravitational mass of all the photons and neutrinos in the Universe adds only another 1% at most to the mass of the Universe. The largest con-tribution to the mass of the Universe is believed to come from cold dark
matter, which is inferred to exist from studies of the motion of outlying
stars orbiting galaxies, the motion of galaxy clusters, and from images formed by gravitational lenses (composed of clusters of galaxies) of back-ground galaxies. All these cases show a massive halo of invisible matter ex-tending well beyond the visible material in galaxies and contributing a fac-tor of around 5 to 10 times the visible mass density to the mass of the Universe. Adding in dark matter makes the current value of the ratio of the observed to critical mass density, m, about 0.3. The actual nature of cold dark matter is uncertain, but it is not composed of ordinary atoms or ele-mentary particles, which interact with photons as described by the standard model (Chapter 15). Most likely, dark matter consists of stable, massive, slow-moving exotic particles created at high energy in the first moments of the Big Bang and predicted by grand unified theories like Supersymmetry. The neutralino is the most likely dark matter candidate predicted by
Super-symmetry.The neutralino is the lightest supersymmetric particle, hence the
most stable, and has no electric charge, so it is not affected by photons and only weakly interacts with ordinary matter. Unfortunately, this makes neu-tralinos hard to detect, and no conclusive detection of dark matter in earth-borne detectors has been reported to date.11
c(1.10.7)1029 g/cm3 pn(31)1031 g/cm3
16.5 OTHER EVIDENCE FOR THE EXPANDING UNIVERSE 21
Dark Matter
11For more information on the detection of dark matter, see “The Search for Dark Matter,” by
16.6 FREIDMANN MODELS AND THE AGE OF THE UNIVERSE
Freidmann’s work established the foundation for describing the time evolu-tion of the Universe based on general relativity. General relativity must be used in cosmological calculations because it correctly describes gravity, the most important force determining the Universe’s structure, over immense cos-mological distances. Newtonian theory can lead to errors when applied to the Universe as a whole because it assumes that the force of gravity is always attrac-tive and is instantaneously transmitted. Although Freidmann did consider models both with and without Einstein’s repulsive form of gravity (cosmologi-cal constant), it is easiest to see the general form of Big Bang behavior without introducing repulsive gravitational forces at this point.
Freidmann found three types of time-dependent universes, which may be described in terms of the universal expansion scaling factor a(t). Figure 16.17 shows a(t)(the separation between galaxies) as a function of time for the three cases labeled open universe, flat universe, and closed universe. Note that a(t) alone has a value of zero at the lower-left corner of the graph, not t, and that the three curves start at different times in the past in order to give the same scaling factor at the present time, denoted t0. Open universes have less
mass and energy than that needed to halt the expansion.They start with a scale
factor of zero and grow without limit, any given galaxy approaching a limiting
EXAMPLE 16.2 Critical Density of the Universe
We can estimate the critical mass density of the Universe, c, using classical energy considerations. The result turns out to be in agreement with the rigorous predictions of general relativity because of the simplifying assumption that the mass of the Universe is uniformly distributed. Solution Figure 16.16 shows a large section of the Uni-verse with radius Rwith the critical density, containing a total mass M, where Mconsists of the total mass of matter plus the effective mass of radiation with energy E, E/c2. A galaxy of mass mand speed vat Rwill just escape to infin-ity with zero speed if the sum of its kinetic energy and gravitational potential energy is zero. Thus,
Because the galaxy of mass m obeys the Hubble law,
vHR,the preceding equation becomes or c 3H2 8G H2 8G 3 c
v2 8G 3 R 2 c 1 2mv2 Gm43R3 c R Etotal0KU12mv2 GmM R
Using H 23 103 m/(s · lightyear), where 1 light-year 9.46 1015m and G6.67 1011N · m2/kg2, yields a present value of the critical density c1.1 1026kg/m3. As the mass of a hydrogen atom is 1.67 1027kg,
c corresponds to about 7 hydrogen atoms per cubic meter, an incredibly low density.
R
v
m
Figure 16.16 (Example 16.2) A galaxy escaping from a large cluster contained within radius R. Only the mass within Rslows the mass m.
velocity that is higher the lower the mass-energy density within the universe. Thus, the curve labeled open universe shows a typical case and really stands for a set of curves describing universes with different densities, all less than the critical density. Closed universes have so much gravitationally attractive mass-energy that the expansion is actually stopped and the recessional motion of all the galaxies reversed so that the universe collapses and returns to the
state a(t) 0. Again the figure shows a single closed-universe curve, which
stands for a set of curves describing universes with densities greater than the critical density. Both open and closed universes satisfy non-Euclidean geome-tries. In between these two cases is the case of the flat universe. A flat universe has precisely the critical mass-energy density, and the recessional velocity of
any two galaxies approaches zero with increasing time. A flat universe is
Euclidean.
The connection between Freidmann models and the age of the Universe is easiest to see in the simple hypothetical case shown by the straight line, which is the tangent to the a(t) curves at the present moment, t0(Fig. 16.18). This line shows the behavior of a(t) for the case where there is no gravity in the universe to slow the expansion. Since the slope of this line is (da/dt)t0 a(t0)/and
Hub-ble’s constant H(t0) (t0)/a(t0), 1/H is the age of the Universe in this no-gravity case. is called the Hubble time,and we will show in the next section that a flat universe with gravity has an age of (2/3)or 2/3H. Since the effect of grav-ity is to slow the expansion, as shown in Figure 16.18, an open universe has an age between and (2/3), and a closed universe has an age less than (2/3).
In order to treat accelerations (current epoch) and decelerations (previous epoch) of the expansion most generally, and to get a flavor of the equations of general relativity describing an expanding Universe, we turn to the equations themselves. One can show that general relativity requires the universal scaling factor a(t) to obey the differential equations:12
a
16.6 FREIDMANN MODELS AND THE AGE OF THE UNIVERSE 23
Flat Open Closed t0 (Now) Start of closed universe Start of open universe 0 a(t) t
Figure 16.17 Time-dependent Freidmann universes. The figure shows the time de-pendence of the universal expansion scaling factor a(t) (proportional to the distance between galaxies) for the three cases of open, closed, and flat universes. It also shows that the Big Bang occurred at different times in the past for the different cases.
12See P. J. E. Peebles, Principles of Physical Cosmology,Princeton, NJ, Princeton University Press,
(16.15)
(16.16) In these equations, aand are functions of time, where is the effective mass density of the Universe; that is, includes the density of ordinary matter like hydrogen as well as the effective mass density of fields with energy density u, u/c2. k is a parameter that determines whether the Universe is closed (k 1), open (k 1), or flat (k 0, also called the Einstein – de Sitter
case),Pis the internal pressure, and the other symbols have their usual
mean-ings. The first equation comes from the conservation of energy, and the sec-ond is a sort of Newton’s secsec-ond law, giving the rate of change of the expan-sion in terms of the effective mass density within the Universe. The unusual part of Equation 16.16 is the appearance of the internal pressure P of a sub-stance that apparently adds to the attractive mass density of matter in the Uni-verse. Pappears because general relativity treats matter in the Universe on the average as an extremely dilute gas characterized by a mass density and an in-ternal pressure, a measure of the gas’s kinetic energy. The amount of effective mass density that P adds is much smaller than the contribution of the actual mass density of a substance under ordinary conditions since Pis divided by c2. For example, the contribution of the internal pressure of 1 cubic meter of air at standard temperature and pressure is about 1012 of that of the mass den-sity of the air. But it gets even more interesting. Freidmann considered the Universe to have P 0 on average, which would be the case for a universe filled with cold, pressure-free dust particles. In extreme cases, Pcan be posi-tive and very large (inside stars and in the Big Bang) or even negaposi-tive (for
dark energy) and swamp out to actually produce an acceleration of the
ex-pansion, as shown by Equation 16.16.We will return to the dizzying subject of
d2a dt2 4aG 3
3P c2 da dt 2 8Ga2 3 kc 2 Freely expanding Hubble case Open Flat Closed t0 a(t0) 0 a(t) tFigure 16.18 The straight line is the tangent to the Freidmann a(t) curves at the pre-sent moment and models the case where there is no gravitational attraction in the Uni-verse. For this case, the age of the Universe is 1/H. All the curves have steeper slopes than the tangent, indicating that these cases including gravity expanded at faster rates in the past and so reached the current size of the Universe more quickly. Consequently, open, flat, and closed universes have younger ages than the freely expanding Hubble case.
the connection of mass density and internal pressure of different substances in the next section, but for now it suffices to realize that the term
allows us to consider both attractive and repulsive forms of gravity in the Universe.
Equation 16.15 can be immediately solved for Hubble’s constant in terms of
fundamental parameters. Since , 16.15 gives
(16.17) Equation 16.15 also may be used to show that the scale factor in the simple case of an Einstein – de Sitter Universe is proportional to t2/3, where t is the time since the Big Bang. For this case, Equation 16.15 becomes
(16.18) In order to separate variables and integrate this equation, we need to express
(t) as a function of a. We take t 0 at the singularity a:0 and :and
assume a finite effective mass Min the first instants of the Universe. If the Uni-verse simply expanded and no matter left or entered through its surface
or
(16.19) where are the density and scaling factor at time t. Substituting 16.19 into 16.18 gives
(16.20) where . Integrating 16.20 gives
and finally,
(16.21) where . Since , using 16.21 we find that the Einstein – de Sitter Universe has an age of 2/3H, as claimed.
Although we have mentioned that light emitted from astronomical objects at increasingly distant time epochs means the light is increasingly redshifted as we see it now, Equation 16.21 gives the exact connection between redshift and past epoch for the Einstein – de Sitter model. The expansion of the universe between now (t0) and the time of emission (te) of radiation now seen to be redshifted by Zis described by
(16.22) For the Einstein – de Sitter model, this equation becomes
(16.23) 1Z t0 2/3 te2/3 1Z a(t0) a(te) H a a C
3B 2 2/3 aCt2/3 a a0 a1/2daB t t0 dt B√
2GM da dt Ba 1/2 (t) and a(t) (t)3M/4a3(t) M(t) 4a 3(t) 3 da dt√
8G 3 a H2(t0) 8G(t0) 3 kc2 a2(t0) H2(t0)aB2(t0)/a2(t0) ( 3P/c2)Thus, when we observe a supernova with a high Z of 2 in an Einstein – de Sitter universe, we are looking at historical conditions in a universe which was 1/3 of its present size and about 20% of its present age when the supernova deto-nated.
16.7 WILL THE UNIVERSE EXPAND FOREVER?
In a current mythology the ultimate fate of the Universe may be viewed as a cosmic struggle between two titans: the attractive gravitational force of matter and the repulsive force of dark energy spread uniformly through the vacuum. The specific nature of dark energy or vacuum energy and its variation with time are unknown except that it has a negative pressure in our general
relativ-ity Equation 16.16 and so acts as a repulsive gravitational force. In fact, the
term ( 3P/c2) in Equation 16.16 can be used to categorize the attractive or repulsive gravitational nature of substances both common and exotic, which are summed in this term:
• For an ordinary gas at STP, the mass density term is 1012times larger than the internal pressure term, both terms are positive, so the effect of gases is to produce gravitational attraction.
• For photons, which are mass 0 particles, it is convenient to write ( 3P/c2) 1/c2(u 3P), where uis the energy density or energy per unit volume of the photons. As the internal pressure of a photon gas is given by P u/3, 1/c2(u 3P) 2u/c2, a positive term, so that photons also exert a force tending to hold the Universe together.
• For cold dark matter, P 0, and only the mass density of these exotic par-ticles contributes to the attractive gravitational force.
• For all forms of dark energy, P0, and if P is sufficiently negative it will dominate all positive contributions and produce a net repulsive gravita-tional force in the Universe, which is believed to be the case now. For a “substance” called the quantum vacuum (to be discussed shortly) with an energy density uqv, P uqv, so 1/c2(u 3P) 2uqv/c2. The quan-tum vacuum produces a strongly repulsive force term that may dominate all attractive terms provided the quantum vacuum energy density is large enough. In fact, examination of Equation 16.16 shows that observation of accelerated expansion means dark energy exists. Denoting the energy density and pressure of dark energy by udeand Pde, an observed accelera-tion of the expansion means ( 1/c2(ude3Pde)) 0 or Pde ude/3 for any form of dark energy. Different models of dark energy predict dif-ferent time variations for ude and different values for Pde, where Pde is limited as udePde ude/3.13
It is very interesting that current observations show that dark energy
actu-ally exists and the effective mass density of dark energy, ude/c2, dominates the
observed attractive mass density of the Universem by a factor of about 2:1.
The normalized dark energy density is expressed by writing ude/uc, where udeand ucstand, respectively, for the observed dark energy and critical energy (mass) densities. When the constraint m1 from inflationary
13See the article by Bertram Schwarzchild, Physics Today,June 2004, p. 19. Dark Energy
theory is imposed on the most recent SN1e data, the best-fit values of
m0.29 0.04 and 0.71 are found.14
The existence of dark energy had been suspected for several years, as well as a transition from an earlier epoch of deceleration to the current period of acceleration of the expansion. The transition was expected because the effec-tive mass density term falls as 1/a3(t) as the Universe expands, and the 3P/c2dark energy term is believed to be constant or more slowly decreasing than . The actual observation of this expected switchover point provides con-clusive evidence of the existence of dark energy and some information on how it changes with time. The latest results show that the transition from decelera-tion to acceleradecelera-tion occurred about 9 billion years ABB, or in terms of model-independent redshift, at a time corresponding to Ztransition0.46 0.13. The time dependence of the dark energy is described by the Zdependence of the dimensionless parameter w, the ratio of the dark energy’s pressure to its en-ergy density.
(16.24) Writing
(16.25) the best-fit values to the new supernovae data have
(16.26) To place these results in context, Einstein’s cosmological constant has w0 1 and dw/dZ 0. If the current large value of w 1.31 remains con-stant or becomes more negative with time, the Universe will not only continue to expand but the eventual unhappy fate of galaxies, solar systems, atoms, and nuclei will be to be ripped apart.
16.8 PROBLEMS AND PERSPECTIVES
While particle physicists have been exploring the realm of the very small, cos-mologists have been exploring cosmic history back to the first moments of the Big Bang. Observation of events that occur when two particles collide in an ac-celerator is important for understanding the early moments in cosmic history, but perhaps the key to understanding the early Universe is to find a unified theory of quantum mechanics and gravity. Such a theory is urgently needed to adequately describe the first instants of the Big Bang. Cosmologists and parti-cle physicists now find that they have many common goals and are joining hands to attempt to understand the physical world at its most fundamental level.
Lest the reader be fooled by our simplified overview of cosmology, it is im-portant to realize that understanding is far from complete. There are many questions remaining concerning our incredible Universe so finely tuned that it has allowed the fragile and intricate complexities of life to arise 10 billion
w(Z) 1.311.48Z w(Z)w0 dw dZ
t0 Z w Pde ude16.8 PROBLEMS AND PERSPECTIVES 27
14The latest SN1e results are from A. G. Riess et al., Astrophys. J. (in press), available at