5.4.2
Coastal Erosion
The following section provides the hazard profile (hazard description, location, extent, previous occurrences and losses, probability of future occurrences, and impact of climate change) and vulnerability assessment for the coastal erosion hazard in Cape May County.
2021 Plan Update Changes
➢ The hazard profile has been significantly enhanced to include a detailed hazard description, location, extent, previous occurrences (updated with events that occurred between 2016 and 2020), probability of future occurrence, and potential climate change impacts using best available data.
➢ A vulnerability assessment section was completed for the coastal erosion hazard that provides a more accurate estimated exposure and potential losses to Cape May County.
5.4.2.1
Profile
Hazard Description
Along with flooding, coastal erosion is one of the primary coastal hazards leading to loss of lives or damage to property and infrastructure in damaged coastal areas. Erosion is the process of the wearing away of beaches and bluffs along the coastline by large storms, flooding, strong wave action, sea level rise, and human activities. Erosion occurs when the waves and currents remove sand from the
beach system. The loss of sand causes the beach to become narrower and lower in elevation. During storms, waves carry the sand offshore, depositing and storing the sediment in large sandbars. In weeks and months following the storm, the sand is returned to the beach by calmer waves (CRS Coordinator's Manual 2015). However, transfer of sand down the beach due to longshore currents may result in a net loss of sand to a beach if new sand does not migrate into the area to offset the longshore losses.
Many natural factors affect erosion of the shoreline, including
shore and nearshore morphology, shoreline orientation, and the response of these factors to storm frequency and sea level rise. Coastal shorelines change constantly in response to wind, waves, tides, sea-level fluctuation, seasonal and climatic variations, human alteration, and other factors that influence the movement of sand and material within a shoreline system.
Unsafe tidal conditions, as a result of high winds, heavy surf, erosion, and fog are ordinary coastal hazard phenomena. Some or all of these processes can occur during a coastal storm, resulting in an often detrimental impact on the surrounding coastline. Factors including: (1) storms such as Nor’Easters and hurricanes, (2) decreased sediment supplies, and (3) sea-level rise contribute to these coastal hazards.
Historically, some of the methods used by the USACE, the state, municipalities, and property owners to stop or slow down coastal erosion or shoreline change have actually exacerbated the problem. Attempting to halt the natural process of erosion with shore parallel or perpendicular structures such as seawalls (groins and jetties) and other hard structures typically worsens the erosion in front of the structure (i.e. walls), prevents or starves any sediment behind the structure (groins) from supplying down-drift properties with sediment, and subjects down-drift beaches to increased erosion. Since most sediment transport associated with erosion and longshore drift has been reduced, some of the State’s greatest assets and attractions – beaches, dunes, barrier beaches, salt
Coastal erosion is a complex physical process shaped by both natural processes and human activity. Natural factors include the sand supply; changes in sea level or the water level in the Great Lakes; geologic characteristics of the shore; the effects of waves, currents, tides, and wind; and the bathymetry of the offshore sea bottom. Human activity may have direct or indirect effects on the coastal areas (USGS 2015).
marshes, and estuaries – are threatened and will slowly disappear as the sediment sources that feed and sustain them are eliminated.
Sandy barrier/bluff coastlines are constantly changing as the result of wind, currents, storms, and sea level rise. Because of this, developed sandy shorelines are often stabilized with hardened structures (seawalls, bulkheads, revetments, rip-rap, gabions, and groins) to protect coastal properties from erosion. While hardened structures typically prove to be beneficial in reducing property damage, the rate of coastal erosion usually increases near stabilization structures. Shore protection structures such as seawalls and revetments tend to eliminate natural wave run-up and sand deposition processes and can increase reflected wave action and currents at the waterline. Increased wave action can cause localized scour in front of structures and prevent settlement of suspended sediment (FEMA 1996). This increased erosion impacts natural habitats, spawning grounds, recreational activity areas, and public access (Frizzera 2011). According to the NJDEP, Cape May County has a number of shoreline structures that includes one breakwater structure, 94 groins, eight jetties, four revetments, and three seawalls (NJDEP 1993).
Coastal erosion can be classified as short-term or long-term. The long-term changes of shoreline may not be evident on a day-to-day or even year-to-year basis. They occur over a period of decades, over which short-term changes tend to average out to the underlying erosion or accretion trend. However, short-term changes due to storm events are immediately noticed. Short-term changes occur over periods ranging from a few days to a few years. They can be highly variable in direction and magnitude.
Coastal erosion is typically a sporadic event and most typically associated with another hazard event, such as a hurricane. Additionally, erosion rates are influenced by local geographic features and man-made structures. Although most typically associated with flooding, coastal erosion can also be caused by windstorm events, which can blow beach and dune sand overland into adjacent low-lying marshes, upland habitats, inland bays, and communities. If related to a flood event, erosion is typically seen when extreme rainfall scours and erodes dunes and when inland floodwaters return through the dunes and beach face into the ocean (FEMA 1996).
Coastal erosion can result in significant economic loss through the destruction of buildings, roads, infrastructure, natural resources, and wildlife habitats. Damage often results from an episodic event with the combination of severe storm waves and dune or bluff erosion.
Location
NJDEP defines ‘coastal’ as any land adjacent to a tidally influenced waterway. New Jersey has three primary coastal regions: the Atlantic Coast which includes communities along the Atlantic Ocean and communities that lie inland of the Atlantic coast barrier islands; the Delaware Bayshore; and the urban coast which includes communities such as Jersey City and Hoboken that lie along the tidal portion of the Hudson River (Rutgers 2014). The coastal area includes coastal waters to the limit of tidal influence including: the Atlantic Ocean (to the limit of New Jersey's seaward jurisdiction); Upper New York Bay, Newark Bay, Raritan Bay and the Arthur Kill; the Hudson, Raritan, Passaic, and Hackensack Rivers, and the tidal portions of the tributaries to these bays and rivers. The Delaware River and Bay and other tidal streams of the Coastal Plain are also in the coastal area, as is a narrow band of adjacent uplands in the Waterfront Development area beyond the CAFRA area (NJDEP 2014). As previously stated, a coastal area is any land adjacent to a tidally influenced waterway; therefore, Cape May County is considered a coastal county because nearly all its municipalities lie along the tidal portion of the Delaware Bay or the Atlantic Ocean. Figure 5.4.2-1 illustrates the coastal areas of Cape May County.
Catastrophic events can alter the natural features of the shoreline, such as beaches, dunes, and wetlands, and threaten people and property. The prediction of a rising sea level and an increase in storm frequency and intensity, will result in the exacerbation of vulnerability to the risks of coastal hazards (NJDEP 2020).
New Jersey Beach Profile Network
In 1986, The Richard Stockton College Coastal Research Center (CRC) established the New Jersey Beach Profile Network (NJBPN) for the purpose of monitoring shoreline conditions along New Jersey’s coast. NJBPN consists of over 100 beach profile sites along the entire shoreline of New Jersey, including the Raritan and Delaware Bays. The profile sites are spaced approximately one mile apart, with at least one site located in each oceanfront municipality. The dune, beach, and nearshore are surveyed at each profile site twice a year (fall and spring), and analyzed for seasonal and multiyear changes in shoreline position and sand volume. Reports on all beach profiles are published annually (Stockton University 2020).
There are 31 NJBPN survey sites along the beaches of Cape May County, consisting of a combination of barrier islands, coastal headlands, and the Delaware Bay shore. There are 27 sites along the Atlantic Ocean and four set along the Delaware Bay of western Cape May County. The profile sites are located in the following municipalities of the County: Ocean City, Strathmere (Upper Township), Sea Isle City, Avalon Borough, Stone Harbor Borough, City of North Wildwood, City of Wildwood, Lower Township, City of Cape May and the Borough of Cape May Point. The four Delaware Bay profiles are located in Reeds Beach (Middle Township), Villas (Lower Township), North Cape May (Lower Township), and Higbee Beach State Park.
Delaware Bay Shoreline of Western Cape May County
During 2013 and 2014, habitat restoration work commenced through an umbrella of conservation groups funded with National Fish & Wildlife Foundation Hurricane Sandy recovery money. Sandy destroyed or severely damaged 70 percent of known horseshoe crab spawning habitat on the New Jersey Delaware Bay shoreline. These marsh edge beaches consist of thin veneers of coarse sand supporting spawning activity each May of the largest population of horseshoe crabs worldwide. Sandy’s storm surge and waves inundated and over-washed these low elevation beaches removing the thin veneer of sand exposing the salt marsh below, leaving an inhospitable shoreline for horseshoe crab spawning and successful egg production. Attention initially focused on restoring the western shoreline of Cape May County (Pierces Point – Reeds Beach) and included Moore’s Beach in eastern Cumberland County. This stretch of post Sandy degraded shoreline was determined as critical habitat and targeted for immediate restoration based on documented reliance on the region for spawning and subsequent migratory shorebird foraging. Red Knots and other northbound migratory shorebirds depend on the horseshoe crab eggs as a major source of nutrients during their stopover along the Delaware Bay, adding critical weight needed to complete their long flight from South America to the Artic breeding grounds each spring. Sand for restoration was supplied from Cape May County quarries and the beaches engineered to have a steeper sloping beachface with a beach berm elevation just above normal mean higher high water. Restoration work expanded during 2015 westward along the Delaware Bay shoreline into Cumberland County (Fortescue, Thompson Beach and Dyer Cove (2016)) restoring additional sandy beach habitats suitable for horseshoe crab spawning damaged by Hurricane Sandy (Stockton 2019).
Other efforts focused on sediment distribution budgets and documentation of wave energy flux (heights, periods and direction of travel) along the lower Delaware Bay NJ shoreline. Installation of various structure types supporting oyster growth and development is providing interesting data on wave energy reduction at the sand beach. The structures act as nearshore oyster reefs to attenuate wave energy, reduce erosion rates and prolong the stability of the rebuilt beaches. Local oystermen are interested in this and similar approaches to oyster propagation as aquaculture opportunities especially viable along the bay front in Cape May County. Structures range from natural shell to “oyster castle” concrete shapes and timber and rebar platforms placed nearshore in
water depths that expose the structures at low tide, but covers them completely during the higher tide cycle. Wave measurements have shown a reduction in incident wave energy at the beach landward of the structures versus open approach sections of the coastline. The combined efforts and methodologies helped restore the degraded shoreline and assist the migratory shorebirds including the Red Knot that depends on nutrients from horseshoe crab eggs to gain weight to complete their migration and for successful breeding (Stockton 2019). Marsh restoration is being incorporated into the Maurice River delta area to convert extensive mud flats back into viable marsh habitat. In addition, the USACE completed a feasibility study to use dredged sands from Delaware Bay to reduce coastal storm risks in three bayshore communities. Potential sources of sand are from maintenance of the Delaware River Main Channel-Lower Reach E or from the Buoy 10 open water disposal site located one mile east of the Delaware Main Channel. In March 2018, the Township of Lower submitted a proposal to the US Army Corps of Engineers (Section 1122 of the Water Resources Development Act) for the use of this source of dredged material to improve shore protection (Stockton 2019).
Cape May City
Cape May City beaches continue to shed sand into the “Cove” beach belonging to The Nature Conservancy. These losses are remedied during the US Army Corps of Engineers work between Cold Spring Inlet and Cape May Point. Added studies were approved by the City in 2016 to better understand the beach configuration and seaward slope data following a number of injury complaints alleged to be the result of a too steep a beach and enhanced wave breaking at the beach. However, an administration change in the fall of 2016 election resulted in suspending this municipal study (Stockton 2019).
The Wildwoods
The North Wildwood beaches continue to lose sand primarily at the northeastern end of the island at Hereford Inlet. The North Wildwood situation appears to be the most troublesome concern in Cape May County with serious beach loss driving the municipality to undertake multiple emergency construction projects in the absence of the final USACE shore protection project (Stockton 2020). Sand back-passing from Wildwood City has been quite successful in holding the shoreline without returning to the ebb-tidal delta deposit in Hereford Inlet (Stockton 2019).
Work by the Philadelphia District USACE continues toward an approved design document for the Wildwoods that includes sand harvesting from Wildwood and Wildwood Crest and passing it back north to the erosion zone in North Wildwood instead of pumping in new sand from offshore or from the Hereford Inlet tidal shoals. The City of North Wildwood conducted sand harvesting work as well transferring 200,000 cy of Wildwood sand north in early 2017 and again by May 24, 2018. Interactions with the Department of the Interior regarding use of Hereford Inlet’s ebb-tidal delta as a sand source produced agreement from the Department Secretary to allow access to the authorized borrow zone for hydraulic dredging for beach nourishment. This use was allowed under the exceptions to employing federal funding within the NJ Coastal Barrier Resource Unit #9 (Hereford Inlet) (Stockton 2019).
Avalon & Stone Harbor
These two communities have been leaders in shore protection by having successfully managed to have Federal shore protection projects constructed and, for years, have promoted wider, higher dunes with coordinated development of pedestrian access pathways that do not make a breach easier at street end access points. The US Army Corps of Engineers completed a project restoration from the 8th Street jetty to 31st Street in Avalon and from 70th Street in Avalon south to the terminal groin south of 123rd Street in Stone Harbor. This work was completed under PL 113-2 Emergency Restoration funds for Hurricane Sandy damage to the federal project. Since that was completed in early 2013, erosion claimed the sand to the revetment rocks at 12th Street in Avalon. The Borough conducted its individual beach project in 2015 adding 740,000 cy between 9th and 25th Streets.
The USACE returned in 2017 adding over 900,000 cy to the Avalon beach. Currently a sand back-passing operation is underway to move sand from the mid-island borrow zone beaches to the erosional part of the island. Stone Harbor’s southern oceanfront has suffered severe loss rates culminating in NE storm damage in early 2016 that were addressed in 2017 with some Hereford Inlet sand. Sand was also pumped from Townsend’s Inlet ebb-tidal delta to Stone Harbor due to issues related to Hereford Inlet being located within a unit of the Coastal Barrier Resource System (CBRS) that prohibits federal funds for use to promote “development” within or for extraction of sediment out of the CBRS unit. This prohibition was lifted by the Department of the Interior Secretary in the fall of 2019 (Stockton 2019).
Sea Isle City & Strathmere
A 2009 NJ State and locally sponsored shore protection project saved these two communities from substantial damage from Hurricane Sandy with about 230,000 cubic yards of sand lost that was replaced starting April 17, 2015 in Ocean City under a federal responsibility for Ludlam Island. This project covered from 42nd Street to 59th Street in Ocean City and extended from Seaspray Avenue south to 93rd Street in Stone Harbor and was accomplished using sand from offshore borrow sites previously defined. Sand was added first in Ocean City, then starting in Strathmere and working south finishing at 93rd Street in Sea Isle City. Over 3.4 million cubic yards of new sand was pumped onto this island from offshore borrow sites by 2016 (Stockton 2019).
The Corson’s Inlet State Park shoreline south of development in Ocean City suffered dune loss of considerable magnitude during Hurricane Sandy. Since sand moves south naturally under wave dominance from the northeast, this shoreline should benefit from any sand losses in Ocean City’s part of the new project. The dune will need fencing to encourage reconstruction as the beach widens. The position of the main tidal channel in Corson’s Inlet has been monitored because it’s position vis-à-vis the Strathmere inlet shoreline is critical to the rates of erosion observed on the southern shoreline. Restoration work was recently completed at the Strathmere side and north of the State Park on the Ocean City side of Corson’s Inlet using ebb-tidal delta sand and appears to be stable (Stockton 2019, 2020).
Ocean City
The Ludlam Island project also included 1.5 million cubic yards of sand for the southern shoreline of Ocean City that was damaged by Hurricane Sandy due to low, narrow dunes. This places the shoreline between Great Egg Inlet in Ocean City and Hereford Inlet in Stone Harbor under USACE project jurisdiction with a 3 to 5-year expectancy of maintenance work on restoring these beaches to the design specifications (Stockton 2019). Ocean City continues to lose sand south to 12th Street with the middle section of the City remaining stable (Stockton 2020).
For details regarding the restoration and/or beach nourishments efforts within the County, please refer to the NJBPN Annual Reports found here: https://www.stockton.edu/coastal-research-center/njbpn/reports.html Extent
All beaches are affected by storms and other natural events that cause erosion; however, the extent and severity of erosion differs across the United States. It may be intensified by activities such as boat wakes, shoreline hardening, or dredging. Natural recovery after erosive episodes can take months or years. If a dune or beach does not recover quickly enough via natural processes, coastal and upland property may be exposed to further damage in subsequent events. Coastal erosion can cause the destruction of buildings and infrastructure (FEMA 1996).
Coastal erosion is measured as the rate of change in the position or horizontal displacement of a shoreline over a period of time. Geologists measure the severity of erosion in two ways -- as a rate of linear retreat (feet of
shoreline recession per year) and volumetric loss (cubic yards of eroded sediment per linear foot of shoreline frontage per year) (NYC Emergency Management 2019).
Coastal erosion can be rapid or can occur gradually. However, measuring gradual (or long-term) erosion is often difficult, because the extent of natural erosion in a specific shoreline varies significantly from year to year. If choices are made to dredge or nourish beaches along particular parts of the coast, it can be difficult to determine how much beach is being lost or gained through natural processes and how much is being affected by human activities (NYC Emergency Management 2019). Coastal erosion may also be exacerbated by human activities, such as boat wakes, shoreline hardening, and dredging (FEMA 1996). In barrier islands and barrier spits, severe erosion can result in the formation of tidal inlets.
The USGS Coastal Change Hazards Portal hosts a short-term (30 years) change mapper, which displays the rate of average shoreline change on coastal shorelines. The Portal indicates that, over the past 30 years, Cape May County had various rates shoreline change ranging from >2 meters added per year to <2 meters lost per year on the Atlantic Coast. Figure 5.4.2-2 displays short-term shoreline change rates for Cape May County’s Atlantic Coast.
Figure 5.4.2-2. Shoreline Change Rates for Cape May County
Source: USGS 2020
A number of factors determine whether a community exhibits greater long-term erosion or accretion: • Exposure to high-energy storm waves,
• Sediment size and composition of eroding coastal landforms feeding adjacent beaches, • Near-shore bathymetric variations which direct wave approach,
• Alongshore variations in wave energy and sediment transport rates, • Relative sea level rise,
• Frequency and severity of storm events, and
• Human interference with sediment supply (e.g. revetments, seawalls, jetties) (Woods Hole Sea Grant 2003).
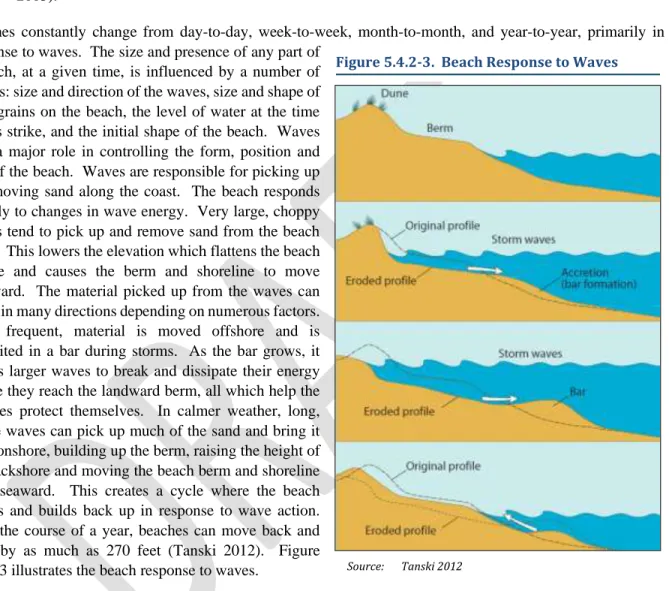
Beaches constantly change from day-to-day, week-to-week, month-to-month, and year-to-year, primarily in response to waves. The size and presence of any part of
a beach, at a given time, is influenced by a number of factors: size and direction of the waves, size and shape of sand grains on the beach, the level of water at the time waves strike, and the initial shape of the beach. Waves play a major role in controlling the form, position and size of the beach. Waves are responsible for picking up and moving sand along the coast. The beach responds quickly to changes in wave energy. Very large, choppy waves tend to pick up and remove sand from the beach berm. This lowers the elevation which flattens the beach profile and causes the berm and shoreline to move landward. The material picked up from the waves can move in many directions depending on numerous factors. Most frequent, material is moved offshore and is deposited in a bar during storms. As the bar grows, it causes larger waves to break and dissipate their energy before they reach the landward berm, all which help the beaches protect themselves. In calmer weather, long, gentle waves can pick up much of the sand and bring it back onshore, building up the berm, raising the height of the backshore and moving the beach berm and shoreline back seaward. This creates a cycle where the beach erodes and builds back up in response to wave action. Over the course of a year, beaches can move back and forth by as much as 270 feet (Tanski 2012). Figure 5.4.2-3 illustrates the beach response to waves.
Previous Occurrences and Losses
Many sources provided historical information regarding previous occurrences and losses associated with coastal erosion throughout the State of New Jersey and Cape May County; therefore, the loss and impact information for many events varies depending on the source. The accuracy of monetary figures discussed is based only on the available information in cited sources.
Although many factors contribute to the natural coastal erosion of Cape May County shorelines; historical hurricanes, tropical storms and Nor’Easter events have significantly increased coastal erosion processes throughout Cape May County. Because Cape May County is primarily surrounded by coastal waters, most tropical and extra-tropical events that commonly occur within the area result in significant losses and temporary or permanent changes to the County’s shorelines. Details regarding Hurricane and Nor’Easter events that have impacted Cape May County are presented earlier in Section 5.4.5 and Section 5.4.6, respectively.
Figure 5.4.2-3. Beach Response to Waves
FEMA Major Disasters and Emergency Declarations
Between 1954 and 2020, the State of New Jersey was included in nine FEMA coastal erosion-related disasters (DR) or emergencies (EM), classified as one or a combination of the following event types: severe storm, flood, coastal storm, high tides, heavy rain, Nor’Easter, tropical storm, and hurricane. Generally, these disasters cover a wide region of the State; therefore, they may have impacted many counties. Of those eight declarations, Cape May County was included in seven of the declarations (Table 5.4.2-1) (FEMA 2020).
Table 5.4.2-1. Coastal Erosion-Related FEMA DR and EM Declarations for Cape May County FEMA
Declaration
Number Date(s) of Event Event Type Location
DR-973 December 10-17, 1992
Coastal Storm, High Tides, Heavy Rain, Flooding
Atlantic, Bergen, Cape May, Cumberland, Essex, Hudson, Middlesex, Monmouth,
Ocean, Salem, Somerset, Union DR-1206 February 4-8, 1998 Coastal Storm Atlantic, Cape May and Ocean DR-1867 November 11-19,
2009
Severe Storms and Flooding Associated with Tropical Depression Ida and a Nor'Easter
Atlantic, Cape May and Ocean DR-4021 August 26 –
September 5, 2011 Hurricane Irene
Twenty-one Counties in New Jersey including Cape May County DR-4048 October 29, 2011 Severe Storm
Bergen, Cape May, Essex, Hunterdon, Middlesex, Morris, Passaic, Somerset,
Sussex, Union, Warren DR-4086 October 26 –
November 8, 2012 Hurricane Sandy
Twenty-one Counties in New Jersey including Cape May County DR-4264 January 22-24,
2016 March 14, 2016
Severe Storm(s): Severe Winter Storm and Snowstorm
Source: FEMA 2020
Previous Events
For this 2021 Plan Update, known coastal erosion events that have impacted Cape May County between 2016 and 2020 are identified are identified in Table 5.4.2-2. For events prior to 2016, refer to Appendix E (Risk Assessment Supplementary Data).
Table 5.4.2-2. Coastal Erosion Events in Cape May County, 2016 to 2020
Dates of Event Event Type
FEMA Declaration
Number
Cape May County
Designated? Location Losses / Impacts
January 22-24, 2016 Winter Storm & Coastal Flooding (Winter Storm Jonas), Coastal Erosion
DR-4264 Yes Cape May County
Snow began to develop on January 22nd from south to north. Across the coastal regions, the snow changed over to rain which limited the totals for those areas. There were intense bands of snow with rates of two to four inches per hour in north-central New Jersey and the Lehigh Valley in Pennsylvania. In addition to snow, there were strong wind gusts that topped out between 30 and 50 mph for most of the region. A 64
MPH wind gust was recorded on the 23rd near Strathmere (Cape May). At one point during the storm, up to 270,000 customers were without power. Outages were
concentrated closer to the coast where the strongest winds occurred. New Jersey Governor Chris Christie declared a State of Emergency on Friday, January 22nd for the duration of the event. Schools and many businesses recessed
early on Friday afternoon in anticipation of the storm.
At the airports, most flights were cancelled due to the storm. Travel became nearly impossible at times for most of the areas impacted. Moderate to major tidal flooding occurred along the New Jersey and Delaware beaches which resulted in severe beach
erosion and some property damage in coastal communities.
The New Jersey Department of Transportation spent approximately $25 million dollars to clear and maintain the state's highways and roadways. In seeking federal
disaster aid, Governor Chris Christie announced the storm cost the state of New Jersey $82.6 million in damages and expenses.
In Cape May County, snowfall totals ranged from seven inches in the City of Cape May to 11.3 inches in Wildwood Crest. Peak wind gusts ranged from 50 mph in Cape
May Point to 64 mph in Strathmere. In addition to snow and wind, coastal flooding impacted the county. In Cape May, there was a record storm surge of 9.4 feet. The tides in the County were as high as 10 feet in some parts which flooded garages and
ground floors of buildings. Flood damage was significant as water levels exceeded those observed during Sandy and ranked in the top 10 on record. Beach erosion was
moderate to major. Major tidal flooding was reported at the Cape May tide gage – 8.98 feet above MLLW was recorded at 1:30pm on January 23rd (major tidal flooding
starts at 8.7 feet above MLLW). September 3-6, 2016 Coastal Erosion, Tropical Storm Hermine
N/A N/A Cape May
County
Slow moving tropical cyclone Hermine caused several days of 8 to 12 feet of surf breaking on Atlantic Ocean shorelines. Cape May County beaches experienced
Dates of Event Event Type FEMA Declaration Number Cape May County
Designated? Location Losses / Impacts
March 14, 2017 Coastal Erosion, Coastal Flood
N/A N/A Ocean City, Wildwood
Low pressure systems across the Ohio Valley and Carolinas phased. This led to a rapidly developing storm which tracked just offshore. Wind, coastal flooding, heavy rain and snow all occurred. Heavy rainfall in Southeast New Jersey ranged from 1-3
inches.
Widespread roadway flooding accompanied the morning high tide in the coastal communities of Cape May county which led to road closures. George Redding Bridge
into Wildwood was closed. Moderate beach erosion also occurred in Ocean City and Wildwood.
Ocean City gauge reached 6.92 ft, moderate flooding begins at 6.5 ft. Sea Isle gauge reached 6.98 ft, moderate flooding begins at 6.9 feet.
July 29, 2017 Coastal Flood and Heavy Rain
N/A N/A Cape May
County
A rare summertime Nor'easter tracked just offshore producing heavy rain, thunderstorms and wind. Coastal flooding and beach erosion also occurred. Rainfall and high tide led to flooding on NJ 47 and West Rio Grand Avenue in Wildwood Crest. Flooding took place on NJ 47 at 5th street in Wildwood Gardens. Tides and rainfall led to street flooding in Stone Harbor. Street flooding was reported on Ocean Drive in Avalon. NJ 47 at CR 624 closed due to flooding in Wildwood. NJ
147 in North Wildwood was closed in both directions due to flooding and street flooding took place at 17th and North. Parts of Hudson Ave were flooded in North Wildwood. Street flooding occurred near the Inlet in Sea Isle City. Several inches of water were reported on roads in Avalon. Water was reported on roads in Ocean City
from 24th to 33rd and on Haven Avenue. September 19-20, 2017 Coastal Erosion, Tropical Storm Jose
N/A N/A North
Wildwood, Ocean City
Tropical cyclone Jose tracked north and east along the Mid Atlantic coast Tuesday September 19th, eventually passing well offshore of Cape May County. Tidal
flooding and erosion occurred.
According to eyewitnesses and video, storm surge pounded the seawall at Third Avenue and Kennedy Boulevard, pouring over the top of the seawall in North
Wildwood. Ocean City’s north end experienced heavy erosion. October 20-21, 2019 Coastal Erosion, Subtropical Storm Melissa
N/A N/A Sea Isle City, North Wildwood and
Ocean City
Subtropical Storm Melissa caused erosion on Cape May Beaches. Most of the towns that saw the worst were in Cape May and Atlantic counties, including parts of Atlantic City, Sea Isle City, North Wildwood and Ocean City. North Wildwood was one of the hardest hit. There, surveyors recorded 40 feet of erosion on the beach, up to four feet in height, between 2nd and 7th Avenues. Five
blocks of beach had 12-foot high scarps, according to the survey from the DEP’s Division of Coastal Engineering. North Wildwood Mayor Patrick Rosenello estimated
the city lost a total of 500,000 cubic yards of sand from the storm. In May, the city placed 200,000 cubic yards onto its beaches-- all of which was lost due to Melissa. In
Ocean City, Subtropical Storm Melissa created scarps up to five feet high in the northern part of the island and wiped out dunes a few blocks from the Ocean City
Dates of Event Event Type FEMA Declaration Number Cape May County
Designated? Location Losses / Impacts
May 22-24, 2020 Coastal Erosion
N/A N/A Cape May
County
Northeast winds contributed to mild coastal erosion over the course of three days.
July 2, 2020 Coastal Erosion
N/A N/A Sea Isle City A rapid erosion event at Townsend Inlet Beach was caused by a unique combination of beach profile and tidal currents. The event was not storm related, but due to oversteepening of the channel margin by scour. Video of the event went viral on
social media platforms. July 9, 2020 Coastal
Erosion, Tropical Storm Fay
N/A N/A Cape May
County
Tropical Storm Fay made landfall at the border of Ocean and Atlantic County bringing heavy rain and flash flooding. Significant erosion occurred in portions of the
County including Cape May City.
Source: NOAA-NCEI 2020; FEMA 2020, NHC 2020, Press of Atlantic City 2016, Cape May County Herald. 2017, Press of Atlantic City 2019, Press of Atlantic City 2020, CBSN Philly 2020.
Probability of Future Occurrences
Long-term coastal erosion is a continuous and dynamic process, impacting the coastal counties along the Atlantic Ocean. It is anticipated that coastal erosion will continue due to the predicted increase in sea level rise and storm frequency and intensity. In New Jersey, coastal erosion will continue to be an on-going problem along many areas of coastline. It is difficult to assign a probability to the near constant small on-going erosion that may occur over a continuous period of time. However, a probability can be assigned to larger storm events such as Nor’easters and hurricanes, which can result in significant, rapid coastal erosion. The period of time suggest the probability of coastal erosion will be about the same in the future, with year-to-year variations. For information on the probability of coastal storms, refer to the Hurricane and Tropical Storm (Section 5.4.5) and Nor’Easter (Section 5.4.6) hazard profiles.
For Cape May County, impacts will vary from place to place along the surge-impacted areas of the County. As temperatures increase (see climate change impacts), the probability for future events will likely increase as well. It is estimated that Cape May County will continue to experience direct and indirect impacts of coastal erosion on occasion.
In Section 5.3, the identified hazards of concern for the County were ranked. The probability of occurrence, or likelihood of the event, is one parameter used for hazard rankings. Based on historical records and input from the Planning Partnership, the probability of occurrence for coastal erosion in the County is considered ‘frequent' (100% chance of occurring in any given year, occurring multiple times a year).
Climate Change Impacts
Due to the increase in greenhouse gas concentrations since the end of the 1890s, New Jersey has experienced a 3.5° F (1.9° C) increase in the State’s average temperature (Office of the New Jersey State Climatologist 2020), which is faster than the rest of the Northeast region (2° F [1.1° C]) (Melillo et al. 2014) and the world (1.5° F [0.8° C]) (IPCC 2014). This warming trend is expected to continue. By 2050, temperatures in New Jersey are expected to increase by 4.1 to 5.7° F (2.3° C to 3.2° C) (Horton et al. 2015).
Since the end of the twentieth century, New Jersey has experienced slight increases in the amount of precipitation it receives each year, and over the last 10 years there has been a 7.9% increase. By 2050, annual precipitation in New Jersey could increase by 4% to 11% (Horton et al. 2015). By the end of this century, heavy precipitation events are projected to occur two to five times more often (Walsh et al. 2014) and with more intensity (Huang et al. 2017) than in the last century. New Jersey will experience more intense rain events, less snow, and more rainfalls (Fan et al. 2014, Demaria et al. 2016, Runkle et al. 2017).
According to NOAA, sea level rise can amplify factors that currently contribute to coastal flooding: high tides, storm surge, high waves, and high runoff from rivers and creeks. Other secondary hazards that could occur along the Mid-Atlantic coast in response to sea level rise include:
• Bluff and upland erosion – Shorelines composed of older geologic units that form headland regions of
the coast will retreat landward with rising sea level. As sea level rises, the uplands are eroded and sandy materials are incorporated into the beach and dune systems along the shore and adjacent compartments (Gutierrez et al. 2007).
• Overwash, inlet processes, shoreline retreat, and barrier island narrowing – As sea level rise occurs,
storm overwash will become more likely. Tidal inlet formation and migration will become important components of future shoreline changes. Barrier islands are subject to inlet formation by storms. If the storm surge produces channels that extend below sea level, an inlet may persist after the storm. The combination of rising sea level and stronger storms can create the potential to accelerate shoreline retreat
in many locations. Assessments of shoreline change on barrier islands have shown that barrier island narrowing has been observed on some islands over the last 100 years (Gutierrez et al. 2007).
A warmer atmosphere means storms have the potential to be more intense (Guilbert et al. 2015) and occur more often (Coumou and Rahmstorf 2012, Marquardt Collow et al. 2016, Broccoli et al. 2020). In New Jersey, extreme storms typically include coastal nor’easters, snowstorms, spring and summer thunderstorms, tropical storms, and on rare occasions hurricanes. Most of these events occur in the warmer months between April and October, with nor’easters occurring between September and April. Over the last 50 years, in New Jersey, storms that resulted in extreme rain increased by 71% (Walsh et al. 2014) which is a faster rate than anywhere else in the United States (Huang et al. 2017). As temperatures increase so will the energy in a storm system, increasing the potential for more intense tropical storms (Huang et al. 2017), especially those of Category 4 and 5 (Melillo et al. 2014). In Atlantic City, Cape May, and Sandy Hook, sea-level has risen at a rate of approximately 0.2 to 0.5 inches per year since the beginning of the 20th century, and this rate will continue to increase (Kopp et al. 2019). The amount of greenhouse gases that are emitted is tied to rates of sea-level rise. By 2050, New Jersey will likely experience at least a 0.9 to 2.1-foot increase (above the levels in 2000; all emissions scenarios), 1.4 to 3.1-foot increase by 2070 (moderate emissions scenario), and potentially a 2.0 to 5.1-foot increase by 2100 (moderate emissions scenario).
Impacts of climate change can lead to shoreline erosion, coastal flooding, and water pollution; affecting man-made coastal infrastructures and coastal ecosystems. Coastal areas may be impacted by climate change in different ways. These areas are sensitive to sea level rise, changes in the frequency and intensity of storms, increase in precipitation, and warmer ocean temperatures (USEPA 2017). As noted above, temperatures are predicted to increase in Cape May County, which lead to an increase in intensity and frequency of severe storm. This increase may lead to more weather patterns that cause coastal erosion events. Rising sea levels will also exacerbate erosional issues.
For details regarding climate change and sea level rise, refer to Section 5.4.1 (Climate Change and Sea Level Rise).
5.4.2.2
Vulnerability Assessment
To assess Cape May County’s risk to the coastal erosion hazard, a spatial analysis was conducted using the best available spatially-delineated coastal erosion hazard areas. To determine the geographic distribution of coastal risk, the Limit of Moderate Wave Action (LiMWA) boundary was referenced from FEMA’s 2014 Preliminary DFIRM and 2017 Effective DFIRM flood data. The LiMWA boundary was selected to assess coastal erosion because it represents land area that is susceptible to wave action. Wave action can be a driver for coastal erosion in Cape May County. Refer to Section 5.1 (Methodology and Tools) for additional details on the methodology used to assess coastal erosion risk.
Coastal erosion is a significant concern because of the large number of communities and cultural resources located along the coast in Cape May County. Beach dunes and other protective measures like sea walls serve as a buffer and protect the built environment and other natural resources on the mainland from coastal storm events such as hurricanes, tropical storms, and nor’easters, which can cause shoreline erosion or accretion. A changing climate and rising sea levels will have devastating impacts on New Jersey’s economy, the health of its residents, the State’s natural resources, and the extensive infrastructure system that provides transportation services, energy and clear water to millions of people in New Jersey (Rutgers University 2014). Please refer to Section 5.4.1 (Climate Change and Sea Level Rise) and Section 5.4.5 (Flood) for more information on the County’s vulnerability to sea level rise and coastal flood hazards.
Impact on Life, Health and Safety
Coastal erosion is not generally considered an imminent threat to public safety when the changes are gradual over many years. However, drastic changes to the shoreline may occur as a result of a single storm event which can threaten homes and public safety. The population exposed, or located in the estimated hazard area, is also considered vulnerable to this hazard. The analysis indicates that 1,268 people are located in the estimated coastal erosion hazard area. Please note this table (Table 5.4.2-3) does not account for an increase in seasonal population along the County’s coastal shores.
Table 5.4.2-3. Estimated Population Exposed to the Coastal Erosion Hazard
Jurisdiction
American Community Survey (2014-2018) Total
Population
Estimated Population Exposed Number of Persons
Exposed to the Coastal Erosion
Hazard Area Percent of Total
Avalon Borough 1,409 11 0.8%
Cape May City 3,491 48 1.4%
Cape May Point Borough 188 0 0.3%
Dennis Township 6,244 15 0.2%
Lower Township 21,838 156 0.7%
Middle Township 18,492 438 2.4%
North Wildwood City 3,849 9 0.2%
Ocean City 11,202 257 2.3%
Sea Isle City 1,955 11 0.5%
Stone Harbor Borough 955 60 6.3%
Upper Township 11,909 139 1.2%
West Cape May Borough 1,103 0 0.0%
West Wildwood Borough 376 71 18.8%
Wildwood City 5,073 20 0.4%
Wildwood Crest Borough 3,131 34 1.1%
Woodbine Borough 2,490 0 0.0%
Cape May County (Total) 93,705 1,268 1.4%
Impact on General Building Stock
To estimate the general building stock exposed to coastal erosion, the updated building inventory was used. The total number of buildings with their centroid in the estimated hazard area were determined in GIS for each municipality. It is estimated that 1,891 buildings accounting for approximately $2 billion of replacement cost value are located in the estimated coastal erosion hazard area (Table 5.4.2-4). As mentioned above, please note the limitations of this analysis are recognized and the results should only be used as an estimate.
Table 5.4.2-4. Estimated Buildings Exposed to the Coastal Erosion Hazard Jurisdiction Total Number of Buildings Total Replacement Cost Value (RCV)
Estimated Building Stock Exposed Number of Buildings Exposed to the Coastal Erosion Hazard
Area Percent of Total
Total Replacement
Cost Value Exposed to the Coastal Erosion
Hazard Area Percent of Total Avalon Borough 5,867 $8,232,959,879 48 0.8% $91,054,166 1.1% Cape May City 4,234 $5,153,049,612 60 1.4% $75,412,227 1.5% Cape May Point Borough 785 $663,183,164 2 0.3% $1,510,014 0.2% Dennis Township 7,301 $3,813,425,173 14 0.2% $11,197,921 0.3% Lower Township 19,597 $9,950,232,225 196 1.0% $205,465,667 2.1% Middle Township 18,197 $11,557,342,752 352 1.9% $177,157,079 1.5% North Wildwood City 4,729 $4,423,365,953 74 1.6% $155,942,162 3.5% Ocean City 18,172 $17,100,920,036 432 2.4% $440,783,157 2.6% Sea Isle City 6,712 $7,663,928,227 37 0.6% $62,845,017 0.8% Stone Harbor Borough 3,836 $3,291,756,871 242 6.3% $241,642,763 7.3% Upper Township 9,627 $6,506,171,365 103 1.1% $115,671,014 1.8% West Cape May Borough 1,623 $1,178,516,373 0 0.0% $0 0.0% West Wildwood Borough 805 $459,103,094 159 19.8% $92,051,909 20.1% Wildwood City 3,679 $4,379,038,844 112 3.0% $288,871,025 6.6% Wildwood Crest Borough 5,410 $4,552,156,876 60 1.1% $57,536,103 1.3%
Woodbine Borough 1,416 $1,335,589,432 0 0.0% $0 0.0%
Cape May County (Total) 111,990 $90,260,739,877 1,891 1.7% $2,017,140,222 2.2%
Impact on Critical Facilities
Coastal erosion can also impact critical facilities and lifelines. There are 76 critical facilities, 74 of which are identified as lifelines, located in the coastal erosion hazard area. Refer to Table 5.4.2-5 for these results by municipality and Table 5.4.2-6 for these results by municipality and critical facility type.
Table 5.4.2-5. Critical Facilities and Lifelines Located in the Estimated Coastal Erosion Hazard Area
Jurisdiction
Total Critical
Facilities LifelinesTotal
Coastal Erosion Hazard Area Number of
Critical Facilities
Exposed Percent of Total
Number of Lifelines
Exposed Percent of Total
Avalon Borough 30 30 4 13.3% 4 13.3%
Cape May City 32 32 1 3.1% 1 3.1%
Cape May Point Borough 10 10 0 0.0% 0 0.0%
Dennis Township 60 60 1 1.7% 1 1.7%
Lower Township 111 111 17 15.3% 17 15.3%
Middle Township 181 181 15 8.3% 15 8.3%
Jurisdiction
Total Critical
Facilities LifelinesTotal
Coastal Erosion Hazard Area Number of
Critical Facilities
Exposed Percent of Total
Number of Lifelines
Exposed Percent of Total
Ocean City 59 58 15 25.4% 15 25.9%
Sea Isle City 26 26 4 15.4% 4 15.4%
Stone Harbor Borough 26 26 2 7.7% 2 7.7%
Upper Township 73 68 6 8.2% 6 8.8%
West Cape May Borough 10 10 0 0.0% 0 0.0%
West Wildwood Borough 8 8 2 25.0% 2 25.0%
Wildwood City 39 37 6 15.4% 4 10.8%
Wildwood Crest Borough 23 23 1 4.3% 1 4.3%
Woodbine Borough 21 21 0 0.0% 0 0.0%
Table 5.4.2-6. Critical Facilities by Type Located in the Estimated Coastal Erosion Hazard Area
Jurisdiction
Critical Facilities in the Coastal Erosion Hazard Area
Airport Bridge Communications Tower FacilitiesCounty
Grocery/ Food
Processing Marinas Polling Places EducationPrimary Recreation Superfund Sites
Wastewater Pump
Station Well
Avalon Borough 0 0 0 0 0 3 0 0 0 0 1 0
Cape May City 0 0 0 0 0 0 0 0 0 1 0 0
Dennis Township 0 0 1 0 0 0 0 0 0 0 0 0
Lower Township 0 1 0 0 0 14 0 0 0 0 0 2
Middle Township 0 7 1 0 0 6 0 0 0 0 1 0
North Wildwood City 0 0 0 1 1 0 0 0 0 0 0 0
Ocean City 1 4 0 0 0 4 1 1 0 1 3 0
Sea Isle City 0 2 0 0 0 2 0 0 0 0 0 0
Stone Harbor Borough 0 1 0 0 0 1 0 0 0 0 0 0
Upper Township 0 3 0 0 0 3 0 0 0 0 0 0
West Wildwood Borough 0 0 0 0 0 2 0 0 0 0 0 0
Wildwood City 0 0 0 0 0 2 1 0 2 1 0 0
Wildwood Crest Borough 0 0 0 0 0 1 0 0 0 0 0 0
Impact on Economy
Coastal erosion can also impact roads and infrastructure. As coastline evolution continues, evacuation and emergency routes need to be considered. Cape May County includes many significant roadways used for daily travel and hurricane evacuation routes. Using the hurricane evacuation routes for New Jersey spatial dataset, the exposure of these roadways to coastal erosion is evident. Evacuation routes that may be impacted by coastal erosion include State Road 109, State Road 50, State Road 52, US Rt 9, Garden State Parkway, North Wildwood Blvd, Delsea Dr, Avalon Blvd, Bayshore & Jonathan Hoffman Rd, Beach Ave, Sunset Blvd, Ocean Dr, Roosevelt Blvd, Sea Isle & JFK Blvd, Delaware Ave, Bay Ave, Stone Harbor Blvd. Of the 224 total miles of evacuation routes in the County, 15 miles are exposed to the coastal erosion hazard are (Table 5.4.2-7).
Table 5.4.2-7. Coastal Erosion Vulnerability for Hurricane Evacuation Routes Total Miles of Evacuation Routes in
the County
Total Miles of Evacuation Routes Exposed to the Coastal Erosion Hazard Area
Percent of Total
224 15 6.6%
Impact on the Environment
Coastal erosion is a natural process which defines and shapes coastal ecosystems. While disruptive, some species rely on the impacts of coastal erosion such as numerous nesting shorebirds. Severe coastal erosion events can lead to the destruction of current ecosystems. However, the destruction of one ecosystem leads to the creation of a different ecosystem (i.e. dune systems convert to sand flats or overwash fans). Negative overall impacts to the environment occur when coastal erosion eliminates critical habitat that is unlikely to be restored over time. Elimination of critical habitat is more likely to occur when shore-parallel structures like seawalls obstruct the natural evolution of shoreline ecosystems.
Future Changes That May Impact Vulnerability
Understanding future changes that affect vulnerability can assist in planning for future development and ensure establishment of appropriate mitigation, planning, and preparedness measures. The County considered the following factors to examine potential conditions that may affect hazard vulnerability:
• Potential or projected development • Projected changes in population
• Other identified conditions as relevant and appropriate, including the impacts of climate change
Projected Development
As discussed in Section 4, areas targeted for future growth and development have been identified across the County. Any areas of growth located in the defined coastal erosion hazard areas could be potentially impacted by coastal erosion similar to those that currently exist within the County. Of the areas of new development identified during the HMP update, only one recently completely commercial property in Wildwood is located in the coastal erosion hazard area.
Projected Changes in Population
The 2010 Census data indicates a County population of 97,265. However, more current data, according to U.S. Census Bureau, 2018 American Community Survey 5-Year Estimate, estimates a County population of approximately 93,705, which is a decrease in population since 2010. According to the South Jersey Transportation Planning Organization Regional Transportation Plan’s Demographic Forecast, it is likely that the current decline in population will be reversed but growth will be minimal through 2040 (SJTPO 2012). For more information on projected changes in population, refer to the County Profile (Section 4).
Climate Change
Climate is defined not simply as average temperature and precipitation but also by the type, frequency and intensity of weather events. Both globally and at the local scale, climate change has the potential to alter the prevalence and severity of events that exacerbate coastal erosion. While predicting changes of coastal erosion under a changing climate is difficult, understanding vulnerabilities to potential changes is a critical part of estimating future climate change impacts on human health, society, and the environment (U.S. Environmental Protection Agency [EPA], 2006).
Impacts of climate change can lead to shoreline erosion, coastal flooding, and water pollution, affecting man-made coastal infrastructure and coastal ecosystems. Coastal areas may be impacted by climate change in different ways. Coastal areas are sensitive to sea-level rise, changes in the frequency and intensity of storms, increase in precipitation, and warmer ocean temperatures. Additionally, oceans are absorbing more carbon dioxide from the rising atmospheric concentrations of the gas, resulting in oceans becoming more acidic. This could have significant impacts on coastal and marine ecosystems (EPA 2017). As previously stated, warmer temperatures may lead to an increase in frequency of storms, thus leading to more weather events with potentially increased severity, that cause coastal erosion.
Change of Vulnerability Since 2016 HMP
Since the 2016 analysis, population statistics have been updated using the 2014-2018 American Community Survey. The updated building stock inventory was created using building footprints and parcel data from the County, which was supplemented with 2013 MOV-ID tax assessor data and 2019 RS Means replacement cost value for building and content replacement costs. This provides an up-to-date look at the entire building stock for Cape May County and gives more accurate results for the exposure and loss estimation analysis.
Since 2016, ongoing coastal erosion mitigation projects have occurred including beach replenishment, replacement of bulkheading, and dredging of nearshore waterways. As the majority of these actions are continuations or restorations of protections in place prior to 2016, the changes in vulnerability to coastal erosion as a result of mitigation projects are not considered to be significant.