Archived Data
Management Systems
Archived Data
Management Systems
A C
ROSS
-C
UTTING
S
TUDY
A C
ROSS
-C
UTTING
S
TUDY
Linking Operations and Planning Data
Linking Operations and Planning Data
Notice
The Federal Highway Administration provides high-quality information to serve Government, industry, and the public in a manner that promotes public understanding. Standards and policies are used to ensure and maximize the quality, objectivity, utility, and integrity of its information. FHWA periodically reviews quality issues and adjusts its programs and processes to ensure continuous quality improvement.
i
Dear Reader,
We have scanned the country to bring together the collective wisdom and expertise of transportation professionals implementing Intelligent Transportation Systems (ITS) projects across the United States. This
information will prove helpful as you set out to plan, design, and deploy ITS in your communities.
This document is one in a series of products designed to help you provide ITS solutions that meet your local and regional transportation needs. We have developed a variety of formats to communicate with people at various levels within your organization and among your community stakeholders:
• Benefits Brochures let experienced community leaders explain in their own words how specific ITS technologies have benefited their areas.
• Cross-Cutting Studies examine various ITS approaches that can be used to meet your community’s goals.
• Case Studies provide in-depth coverage of specific approaches being taken in communities across the United States.
• Implementation Guides serve as “how to” manuals to assist your project staff in the technical details of implementing ITS.
ITS has matured to the point that you are not alone as you move toward deployment. We have gained experience and are committed to providing our state and local partners with the knowledge they need to lead their communities into the future.
The inside back cover contains details on the documents in this series, as well as sources to obtain additional information. We hope you find these documents useful tools for making important transportation investment decisions.
Sincerely,
Jeffrey F. Paniati
Associate Administrator for Operations
Acting Program Manager, ITS Joint Program Office Federal Highway Administration
iii
Contents
EXECUTIVE SUMMARY ... 1-1 INTRODUCTION ... 2-1
WHAT IS THE ARCHIVED DATA USER SERVICE? ... 2-2 ARCHIVED DATA MANAGEMENT SYSTEMS ... 2-4 STANDARDS DEVELOPMENT... 2-4 PLANNING AND OPERATIONS... 2-5
CASE STUDIES... 3-1
WASHINGTON STATE TRAC... 3-1 CALTRANS PeMS ... 3-4 DETROIT MITS... 3-8 MINNESOTA TMC ... 3-10 MARICOPA COUNTY RADS ...3-12 KING COUNTY METRO ... 3-15
CROSS-CUTTING FINDINGS... 4-1 BENEFITS ... 4-3 SYSTEM DESIGN ... 4-5 SYSTEM OPERATIONS ... 4-6 IMPLEMENTATION CHALLENGES ... 4-6 LESSONS LEARNED...5-1
REQUIREMENTS DEFINITION AND SYSTEM DESIGN ... 5-1 SYSTEM OPERATIONS AND MAINTENANCE... 5-1 MARKETING, TRAINING AND OUTREACH ... 5-1
CONCLUSION ...6-1 REFERENCES...7-1 ADDITIONAL RESOURCES ...8-1
LIST OF FIGURES
Figure 1 - Use of Travel Monitoring Data to Support ADUS Stakeholder Functions ... 2-3 Figure 2 - Snapshot of PeMS Internet Login Page... 3-5 Figure 3 - PeMS System Design Overview... 3-6 Figure 4 - Overview of PeMS Data Collection Infrastructure ... 3-7 Figure 5 - TDRL Hardware and Network Architecture... 3-11 Figure 6 - TDRL Interface for Accessing and Analyzing Data... 3-13 Figure 7 - Screen View from SmartTrek Showing Bus Locations from AVL Data ... 3-17
LIST OF TABLES
Table 1 - Typical Transportation Operations Systems and Associated Data ... 2-6 Table 2 - Typical Differences in Survey and ITS Data ... 2-6 Table 3 - Comparative Summary of Six ADMSs ... 4-1
1-1
Many agencies are learning that ITS technologies offer both operations and planning staff advantages for transportation data collection. When operations data are integrated into an Archived Data Management System (ADMS), they offer a valuable tool that supports a variety of purposes, such as developing operational strategies, planning for operations, long-term planning, and policy and investment decision-making. Substantial benefits also come from improved system performance monitoring.
Moreover, ITS technologies offer advantages for traffic data collection. Coverage of highvolume roads with ITS detectors at short intervals -detectors that collect traffic volume data - complements wide-area and special study data from traditional survey methods. Because ITS
detectors and communicators are already in place, the extra cost to archive and manage the data is relatively minor. Other data collected from ITS, such as speed and travel time, enable a new level of decision support capability.
Because of these advantages, many transportation agencies are turning to ITS data archiving as a key source for data. In order to use data from ITS, agencies are establishing regional data archives that pool different data types and data from different sources, such as transit operations and statewide data.
However, there are a number of challenges to overcome to archive successful implementation of an ADMS. These challenges include getting input from all the potential users, designing a system,
integrating the data, establishing procedures for data quality assurance, analyzing the data, and promoting awareness of their benefits. Because stakeholders are often diverse, flexibility is a key requirement for
success.
This report examines five transportation agencies that have established and are operating successful ADMSs, and one that is on the verge of becoming fully operational. This study discusses the design choices, operational policies, funding sources, costs and benefits experienced by each of the six ADMSs.
Finally, lessons learned from the sites are presented for each stage of an ADMS development process: requirements definition and design,
operations and maintenance, and outreach. All of the lessons learned share a common theme, that beginning with the end in mind is key to success.
The purpose of this report is to enable agencies to overcome the challenges of establishing an ADMS and to experience their many benefits for both operations and planning.
In the May 2002 issue of the California Department of Transportation
Journal, Steve Shladover, then Deputy Director of California Partners for
Advanced Transit and Highways (PATH), neatly summed up both the opportunity for and the benefits of archiving ITS-generated data: “You were getting all this data, but you weren’t making full use of it.” PATH researchers had noted the crush of data being provided by loop
detectors in freeway pavement. Shladover continued, adding that after analyzing this data, ”Our people... found a number of things. One of them is that, contrary to accepted notions, less than half the delay on Los Angeles freeways is recurrent delay.”
Transportation professionals, especially those in operations and maintenance, are increasingly coming to understand that the data generated by Intelligent Transportation Systems and subsequently archived are useful well after they are no longer “real-time” data. This report documents the results of case studies conducted to examine the benefits of archived ITS-generated data. Benefits noted in this report range from measuring and analyzing performance of freeway systems more quickly and efficiently to supporting planning for operations with more readily available data, as well as supplementing governmental reporting systems. In addition, this report documents the results of interviews with project staff and key archived data users to provide readers with implementation challenges and lessons learned from practitioners experienced in Archived Data Management System deployment and usage.
Although the terms “ITS data archive” and “ADMS” are frequently used almost interchangeably, the two are actually distinct entities. An ITS data archive is the repository (typically a database) in which data
collected by ITS are stored. An example of an ITS data archive would be stored travel times for buses along a given route that are collected by the agency’s automatic vehicle location (AVL) system. An ADMS is an application that takes the data from the archive and analyzes them or formats them in a way to facilitate subsequent analysis. An application that extracts the AVL data described in the previous example and analyzes them to help planners prepare congestion or travel time reports is an example of an ADMS. ADMSs provide the crucial linkage between the sources of real-time ITS data and archived data users. A Federal Highway Administration (FHWA) study Cross-Cutting Studies
and State-of-the-Practice Reviews: Archive and Use of ITS Generated
Data1conducted in 1999-2000 noted that “the specific benefits of using
ITS-generated data vary from one application to the next.” This still appears to be the case based on the results of the current case studies
2-1
Introduction
1FHWA (2000). Cross-Cutting Studies and State-of-the-Practice Reviews: Archive and Use of ITS
Generated Data. http://www.itsdocs.fhwa.dot.gov/jpodocs/repts_te/13697, EDL# 13697.
“[Using archived
data] our people
found a number
of things. One
of them is that,
contrary to
accepted notions,
less than half
of the delay on
Los Angeles
freeways is
recurrent delay.”
– Steve Shladover, Deputy Director, California Partners for Advanced Transit and Highways (PATH)and analyses. At some sites, benefits continue to accrue to traditional users of historical data such as planners responsible for traffic data analysis. At others, however, end users may be decision makers that need solid data to support continued use of high-occupancy vehicle (HOV) lanes, or operations staff preparing maintenance plans. The National ITS Architecture is based on user services that document what ITS should do from the user’s perspective. The Archived Data User Service (ADUS) was added to the National ITS Architecture in 1999 as a way to enable multiple uses for ITS-generated data. As stated in ITS Data
Archiving: Five Year Program Description,2the vision of ADUS is
“improving transportation decisions through archiving and sharing of ITS-generated data.” In developing the user service, a broad range of users was considered, including system operators, planners and policy makers. ITS collect a vast amount of data for use in real-time control strategies such as incident management, traffic signal control, and traveler information services. These data can also be extremely valuable for many other purposes if they are saved and made accessible. For
example, roadway surveillance data, such as traffic volumes and speeds measured at specific locations, have many potential applications in many fields of transportation.
Because ITS data are already being collected and communicated, the additional effort to archive and manage these data for other purposes is relatively minor. Furthermore, the detailed nature of ITS-generated data allows for more accurate analyses and makes possible many applications that could not have been undertaken except a substantial cost. Data integration and re-use across applications enable an information synergy, which increases the value of the separate data sources. A flier
about ADUS from 20003emphasizes archived data’s many benefits:
“Data are too valuable to use only once.”
Figure 1 displays several examples of how a single subset of archived data - travel monitoring data - supports various ADUS stakeholder functions. ADUS relies on other ITS functions to provide data. This dependency requires that close coordination be achieved with other ITS standards development efforts, such as those of the National Transportation Communications for ITS Protocol (NTCIP) and the Institute of Electrical and Electronics Engineers (IEEE).
One of the stakeholder groups identified in the development of the ADUS is transportation operations personnel. They are crucial to the success of archived data management systems in that they control the collection of data that eventually feed the archives. Moreover,
“Data are too
valuable to be
used only once.”
– ADUS flier, FHWA-OP-00-014
What is the
Archived Data
User Service?
2FHWA (March 2000). ITS Data Archiving: Five Year Program Description.
http://www.itsdocs.fhwa.dot.gov/jpodocs/repts_pr/9PJ01!.pdf, EDL# 12583.
3FHWA (March 2000). ADUS: A New Resource for Operations, Planning, and Research.
FHWA-OP-00-014.
Introduction
operations personnel are also prime beneficiaries of ADMSs. The early ADUS documents postulated that archived data would promote
improved operations by helping to determine control strategies (such as timing of ramp meters and traffic signals and deployment of incident management equipment) and in evaluations of programs. While these original purposes are still valid, it is becoming increasingly clear that an ADMS will improve operations as well.
Several recent events have increased the importance of archived data for ITS deployments. First, the need to conduct performance
benchmarking as a way to track program effectiveness has been
identified. Second, related to benchmarking, is the provision of detailed data for operations planning. Operation of the transportation system has become the primary focus of many transportation organizations including FHWA and the Institute of Transportation Engineers (ITE). ADMSs are the only credible source of data for operations planning, especially considering the expense of dedicated data collection efforts. Third, ADMSs may be helpful in closing a gap that currently exists with Advanced Traveler Information Systems (ATIS), between customers’ high expectations and what these systems provide. A sound and detailed historical record of system performance is needed for ATIS purposes, especially as products become more sophisticated. For example,
short-2-3
Real-Time ITS SourcesArchived Data User Service
Implementation • ADUS Standards • National Architecture •ADUS Research and
Case studies Other Stakeholder Functions • Safety • Land Use • Air Quality • Maintenance Management • Incident Management • ER Deployment • Signal Timing Operations Planning • National Reporting • Based Planning • Evaluations • Public Relations Performance Monitoring • TRANSIMS • IDAS • 4-Step Models Long-Range Planning • Route Planning • Advisories ATIS Functions Travel Conditions Data
Figure 1. Use of Travel Monitoring Data to Support
ADUS Stakeholder Functions
term congestion forecasts are seen as a highly marketable product, but these must rely on analysis of historical congestion trends to be credible. As a user service, ADUS is a concept rather than a tangible system. An ADMS, described below, is the system that implements the concepts embedded in the Archived Data User Service.
Archived Data
Management
Systems
Standards
Development
As noted in the Introduction, ADMSs provide the crucial linkage
between the sources of real-time ITS data and archived data users, other archives, and the manager or operator of the system. At its most basic level, an ADMS is an information management system that collects, processes, and documents or stores real-time ITS data for use by a broad cross section of users. The type of information collected by systems that are managed by an ADMS ranges from vehicle occupancy data derived from loop detector stations to transit data collected from transit agency AVL systems. The level of sophistication of an ADMS is defined by the agency responsible for implementation and its design is ultimately driven by the intended user audience. The most obvious outward
representation of ADMS sophistication can be seen in the interfaces that are developed for the system. An ADMS that offers more “user-friendly” interfaces and available data is likely to represent a complex
information management system that must control for incorrect, suspicious, or missing data while addressing many simultaneous queries in system that is continuously collecting data. Design challenges for ADMS are significant. ITS applications produce enormous amounts of fine-grained data that the ADMS must process and deliver to users. Since its inception as a User Service in the National ITS Architecture, there has been ongoing standards development for ADUS. The goal of the standards development process is to provide an element of
consistency in ADMS development and thereby facilitate ADMS
implementation. The American Society for Testing and Materials (ASTM) has published the first ADUS standard: ASTM E2259-03, Standard Guide
for Archiving and Retrieving ITS Generated Data. The guide promotes a
structured process for developing an ADMS. The guide stresses sound practices for information systems development and maintenance of data quality through mechanisms such as retaining original source data, correcting data at the source, and constructing an audit trail. The standard is general in scope; it does not strictly specify formats and processes. A number of state and local agencies have incorporated or are considering use of the ADUS standard, ASTM E2259-03. These include the state of Alaska’s Department of Transportation and Public
For more information on the Archived Data User Service, visit http://www.fhwa.dot.gov/policy/ohpi/travel/adus.htm.
For more information on the ADUS and the National ITS Architecture, visit http://www.itsarch.iteris.com/itsarch/html/user/usr71.htm.
Facilities, Virginia Department of Transportation, Maryland State Highway Administration, and Maricopa County in Arizona.
ASTM Committee E17.54 is responsible for developing the standard guide for ADUS. Two additional standards currently under development address standard specifications for “metadata” (data that describes certain characteristics about other data that follow) content for ITS-generated data and standard specifications for archiving ITS-related traffic monitoring data.
2-5
For more information on ADUS standards development activities, visit the Joint Program Office Standards Program website
http://www.standards.its.dot.gov. To order a copy of the standard, visit the ASTM website http://www.astm.org.
Several offices within the U.S. Department of Transportation have recently joined together to promote better linkages between planning and operations. The Federal Transit Administration (FTA) Office of Planning, the FHWA Office of Planning, Environment, and Realty, and the FHWA Office of Operations have created a website and reference manual to support this effort. These offices see archived data and
ADMSs as one of several ways to achieve these improved connections. In fact, the reference manual Getting More by Working Together
-Opportunities for Linking Planning and Operations4specifically
recommends that transportation agencies work together on a regional basis to establish a regional data clearinghouse, the first step in
developing a full-fledged ADMS.
The reference guide lists the typical data collected by transportation agencies that can be used to support both planning and operations (see Table 1) and emphasizes the benefits of ITS as a data resource over traditional “hot spot” data collection survey methods (see Table 2).
Planning and
Operations
4FHWA (2004). Getting More by Working Together - Opportunities for Linking Planning and
Operations: A Reference Manual. http://www.ops.fhwa.dot.gov/publications/lpo_ref_guide/ index.htm, FHWA-HOP-05-016.
For more information about linking transportation planning and operations, visit http://www.plan4operations.dot.gov.
Table 1. Typical Transportation Operations Systems and Associated Data
Source: FHWA (2004). Getting More by Working Together - Opportunities for LinkingPlanning and Operations: A Reference Manual.
Table 2. Typical Differences in Survey and ITS Data
Source: FHWA (2004). Getting More by Working Together - Opportunities for Linking
Planning and Operations: A Reference Manual.
Type of System Types of Data Typically Provided Traffic monitoring and
detection systems
Vehicle volume, speed, travel time, classification, weight, and position trajectories
Traveler information systems
Current traffic conditions (e.g., travel time, speed, level of congestion), traffic incidents, work zone, and/or lane closures
Traffic control systems Time and location of traffic control actions (e.g., ramp metering, traffic signal control, lane control signals, message board content)
Incident and emergency management systems
Location, cause, extent and time history of roadway incident/emergency detection and clearance Advanced public transit
systems
Transit vehicle passenger boardings by time and location, vehicle trajectories, passenger origins, and destinations
Characteristic Traditional Survey Data Sources ITS Data Sources
Timeframe Infrequent Continuous
Resources requirements Labor intensive; individual efforts Automated
Sample Specific time period; board coverage
All time periods; specific coverage
Reliability High reliability; errors apparent during inspection
Reliability checks required; errors easily missed
Storage requirements Small Large
This section documents the results of the case studies conducted to identify benefits of an ADMS. This section provides a general overview of the projects examined as well as implementation issues and other challenges of interest to agencies considering or in the process of
developing an ADMS. Given the interest in capturing benefits of ADMSs, the main criterion for site selection was operational status of the
system. Therefore, a number of sophisticated ADMS deployments that are currently underway such as ADMS Virginia or the Road
Infrastructure Management System (RIMS) in Michigan were not considered. An exception to this standard is the Maricopa County Regional Archive Data Server in Arizona, which was not fully deployed at the time this study was written. This system was included because of its unique role as both a data warehouse and an ADMS for multiple agencies and jurisdictions in Arizona and potential lessons it might provide to other agencies designing ADMS. Finally, King County Metro which serves the Seattle region of Washington was included in the study to illustrate how ITS data archived by transit agencies might by used. Information for the following sites is presented in this section:
• Washington State Transportation Center (Washington State TRAC) • California Department of Transportation Freeway Performance
Measuring System (Caltrans PeMS)
• Detroit, Michigan ITS Center (Detroit MITS)
• Minnesota Department of Transportation Traffic Management Center (Minnesota TMC)
• Maricopa County Arizona Regional Archive Data Server (Maricopa County RADS)
• King County Washington Metro (King County Metro)
Washington State TRAC maintains an archive of data from the Puget Sound freeway and ramp-metering program and uses the data for a variety of analytical purposes. Washington State TRAC’s primary purpose is to encourage research in all aspects of transportation by focusing the resources of the University of Washington (UW), Washington State University (WSU), and the Washington State Department of
Transportation (WSDOT) on the transportation problems of the region and the nation. The objectives of this applied research are to improve the effectiveness, efficiency, safety, economy, and energy conservation of the transport of people and goods throughout Washington State and the country.
The first major ADMS developed by Washington State TRAC was oriented toward evaluation of the freeway management system’s performance. The primary design goal was to provide defensible information that could be used to describe the benefits of freeway management activities, as well as provide data that could be used to
3-1
Case Studies
Washington
State TRAC
System Overview
System Design
defend (and guide) freeway operations policy decisions. In addition, the application was intended to resolve questions such as:
• Are we moving more people as a result of the HOV lanes, or should we convert the HOV lanes to general purpose lanes?
• Are the reversible lanes operating in the correct direction at all hours of the day? If not, how should they be operated?
Current use of the archives now tends to serve a wide range of tasks, most of which are planning-oriented in terms of how agencies plan for operations as opposed to the more traditional capital improvements planning function.
Database Formats
The 20-second archive is stored as part of an Oracle database. The 5-minute database uses a flat file structure. Data are initially stored in a binary format, but the data are routinely extracted and stored as ASCII text (still in a flat file structure).
System Users
WSDOT’s use of the system has come through University of Washington staff acting under contract to WSDOT’s Regional office for the Seattle metropolitan area. Among regional planners, the local metropolitan planning organization (MPO) the Puget Sound Regional Council (PSRC) -actively uses the freeway archive for a number of tasks, including their congestion monitoring and management system. A variety of consultants working locally and nationally also regularly use the system.
Role of National Architecture and ITS Standards in ADMS Design
Development of the Washington State TRAC archive and ADMS predated the National ITS Architecture ADUS development process by several years. The National ITS Architecture and current ITS standards organizations therefore had no role in its development.
Data Selection and Collection
Washington State TRAC’s approach is to store as much and as many different types of data as possible. Depending on the data archive being updated, a “copy” of data used by the freeway operations central computer is either sent via a secure Internet connection to a server hardwired to the WSDOT freeway operations computer or data in the form of flat files stored on CD-ROMs are sent by WSDOT to Washington State TRAC on a quarterly basis. WSDOT data can be reached through Washington State TRAC’s Internet site. The data are essentially available as soon as they are stored. WSDOT provides access to a real-time data stream for these data.
System Operations
Case Studies
Data Quality Assurance
The Washington State TRAC ADMS does not automatically generate data to replace data that is missing, considered bad or suspect. Users of the archive data must then decide how to use these data (i.e., use only valid data, accept questionable data, etc.). Thus, a large portion of the analytical process involves identifying methods to deal with bad or suspect data as part of the analysis being performed.
Quality Assurance (QA) flags are produced for each traffic detectors providing data by the 170 controller software along with each data summary (in 20-second increments). These flags are stored with the 20-second archive and a composite QA flag is set based on the 15 20-second data sets aggregated to produce a 5-minute data set for each detector. The 20-second error flags refer to specific types of errors (e.g., the detector is stuck on, etc.) The 5-minute flags are more general in nature (e.g., detector is good, bad, questionable, or not working).
Making Data from the ADMS Available to Users and How They Are Used
Twenty-second (20-second) archive data is available via the Internet to all interested parties. Five-minute (5-minute) archive data via CD-ROM is only available upon request, and consists of one quarter’s data per disk. The primary analytical tools for creating performance measures are only available for the 5-minute archive.
Support for transportation decision-making is one of the driving forces behind the Washington State TRAC. Archived data have been used for accessing the performance of the HOV lane system, work zone traffic control planning, and planning for the use of reversible lanes for special events. Archived data are also used for decisions on ramp metering at specific locations, and factored into the analysis of opening HOV lanes to regular traffic during night time off-peak hours.
Implementation and System Updates
Washington State TRAC never had a budget to design and build an archive. Thus, Washington State TRAC implemented the archive and ADMS in informal phases. Updates to the Washington State TRAC archive and ADMS have been performed as a response to analysis tasks, with budgets for the analysis supporting development of new analytical tools and ADMS features. Consequently, each phase of the archive
development process has been in response to the need to perform some newly desired analytical task. Once the new analytical process is available, Washington State TRAC distributes those additional capabilities to the WSDOT and other users. Because those new capabilities tend to require new analytical tools, they are distributed as new versions of the analytical software that accompanies the CD-ROMs that contain the data archives. Updates to the ADMS are distributed every 12 to 18 months.
3-3
Outreach
Washington State TRAC developed a formal training class for the archive and analysis software. This class is given on demand to WSDOT staff and other invited public agency personnel. A website was created to provide training support. Members of the UW staff speak at national meetings about how the archive is used and why it is valuable. WSDOT staff is responsible for making other WSDOT staff aware of the archive and analysis software’s availability and uses.
The initial research budget that supported development of the ADMS was $70,000. The CD-ROM approach for the initial archive was
approximately $15,000. The initial archive was constructed by a
graduate student working half-time as an intern. Subsequent biannual budgets (which include software improvements) have ranged from $250,000 to $350,000. There was no cost sharing arrangement for the development of the Washington State TRAC archive. These costs were borne entirely by WSDOT. Washington State TRAC performs analysis and software improvement work on a contract basis. Costs associated with maintaining the 20-second archive are not easily separated from the cost of the ITS backbone, a regional communications infrastructure used by area transportation agencies.
The Freeway Performance Measurement System (PeMS) is a joint effort of the California Department of Transportation (Caltrans) and the University of California’s Berkeley (UC Berkeley) Institute for
Transportation Studies. Growing from a UC Berkeley white paper in 1997 and a desire by Caltrans to tap into the vast amount of data being generated by the thousands of loops detectors deployed throughout the state, Caltrans initiated development of the PeMS. The system was delivered to Caltrans in 2002. PeMS provides Caltrans with a powerful tool for system performance monitoring and congestion management. Caltrans uses the system, which resides at UC Berkeley’s Institute for Transportation Studies, for performance analysis, including congestion monitoring and estimating travel time reliability. Caltrans PeMS travel time estimates are used as the basis for travel time predictions on 20 to 30 routes statewide, and travel time predictions are posted on dynamic message signs (DMS) in the San Francisco metropolitan area. This
information is also provided to value-added resellers (VARs). The system uses volume and lane occupancy data to determine the proportion of travel delay that is based on recurrent or non-recurring congestion. Data from the system are frequently used for quick turn-around analyses cited in media outlets during major transportation events. For example, the
Los Angeles Times used data from the system in coverage of recent
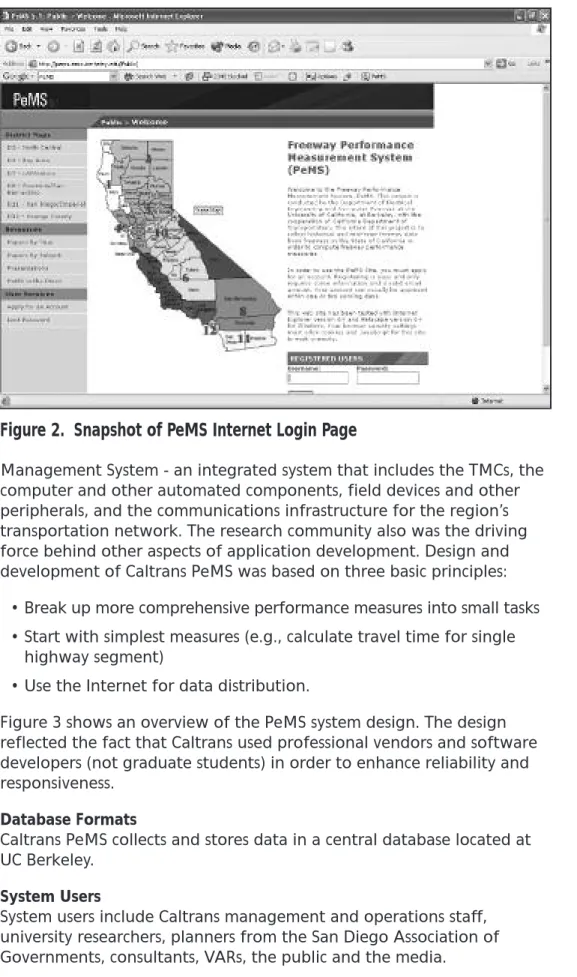
transit strikes in the region. Figure 2 shows the PeMS login page.
System design was originally driven by Caltrans’ operations community, which realized that improvements in system performance could no longer rely on increased capacity. The operations community wanted to use data collected by ITS to support development of highway
congestion reports and to support the state’s Transportation
System Costs
Caltrans PeMS
System Overview
System Design
Case Studies
3-5
Figure 2. Snapshot of PeMS Internet Login Page
Management System - an integrated system that includes the TMCs, the computer and other automated components, field devices and other peripherals, and the communications infrastructure for the region’s transportation network. The research community also was the driving force behind other aspects of application development. Design and development of Caltrans PeMS was based on three basic principles:
• Break up more comprehensive performance measures into small tasks • Start with simplest measures (e.g., calculate travel time for single
highway segment)
• Use the Internet for data distribution.
Figure 3 shows an overview of the PeMS system design. The design reflected the fact that Caltrans used professional vendors and software developers (not graduate students) in order to enhance reliability and responsiveness.
Database Formats
Caltrans PeMS collects and stores data in a central database located at UC Berkeley.
System Users
System users include Caltrans management and operations staff, university researchers, planners from the San Diego Association of Governments, consultants, VARs, the public and the media.
Role of National Architecture and ITS Standards in ADMS Design
ITS standards for ADUS were still under development at the time Caltrans PeMS was designed. The development team referenced ADUS standards when applicable and available. The system has been included in regional ITS architectures.
Data Selection and Collection
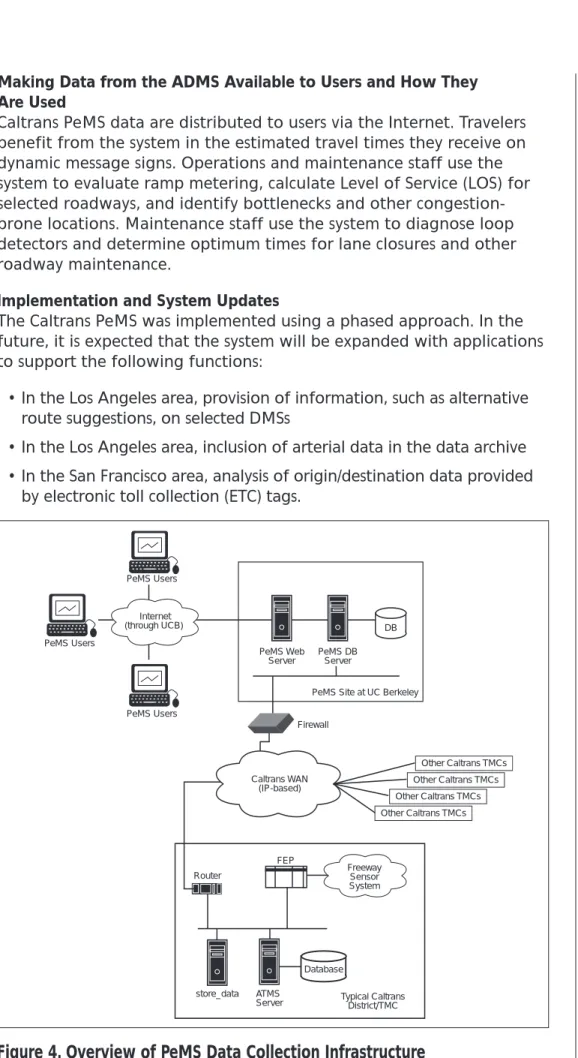
Caltrans PeMS collects traffic detector data from Caltrans Districts 3, 4, 7, 8, 11, and 12 and stores them online. The data are sent to the system’s central database from transportation management centers (TMCs) around the state via the Caltrans wide area network (WAN). The system collects approximately 2 Gb or gigabytes of data each day. (One gigabyte is roughly one billion bytes.) Stored data consists of approximately 2 Tb or terabytes of data. (One terabyte is roughly 1,000 billion bytes.) Figure 4 shows an overview of the data collection infrastructure.
Data Quality Assurance
Caltrans PeMS produces a daily diagnostic report that lists loops with problems as well as the likely cause of the problem (e.g., loop
malfunction, communications failure, etc.) for every loop detector in its system. The system assesses data as they are received and determines if any data are suspect or missing. Missing or suspect data are
automatically replaced with a value imputed from the adjacent values.
D4 (XML-Based) NWS Weather.com CHP CAD System
PeMS System Incident Collection and
Management System
Weather Data Collection Systems
Caltrans Traffic Data Collection Systems Users Pe M S P ro c e s s in g a n d In te rf a c e L a y e rs Incident Database Weather Database Freeway Database VARS Raw Data Processed Data Speeds Other Systems Route Travel Time Web Users Planners Engineers Administration Academic Public Adaptor Adaptor Adaptor Adaptor Adaptor Incidents Call Box Wireless 9-1-1 Weather Reporting Stations Freeway Sensor Stations D3, 7, 8, 12 (ATMS-Based) D11 (RPC-Based)
Figure 3. PeMS System Design Overview
System Operations
Case Studies
3-7
PeMS Users PeMS Users PeMS Users Internet (through UCB) PeMS Web Server PeMS DB Server DB Router FEP Freeway Sensor System Database ATMS Serverstore_data Typical Caltrans District/TMC Firewall
PeMS Site at UC Berkeley
Other Caltrans TMCs Other Caltrans TMCs Other Caltrans TMCs Other Caltrans TMCs Caltrans WAN (IP-based)
Making Data from the ADMS Available to Users and How They Are Used
Caltrans PeMS data are distributed to users via the Internet. Travelers benefit from the system in the estimated travel times they receive on dynamic message signs. Operations and maintenance staff use the system to evaluate ramp metering, calculate Level of Service (LOS) for selected roadways, and identify bottlenecks and other congestion-prone locations. Maintenance staff use the system to diagnose loop detectors and determine optimum times for lane closures and other roadway maintenance.
Implementation and System Updates
The Caltrans PeMS was implemented using a phased approach. In the future, it is expected that the system will be expanded with applications to support the following functions:
• In the Los Angeles area, provision of information, such as alternative route suggestions, on selected DMSs
• In the Los Angeles area, inclusion of arterial data in the data archive • In the San Francisco area, analysis of origin/destination data provided
by electronic toll collection (ETC) tags.
Figure 4. Overview of PeMS Data Collection Infrastructure
Outreach
Training is provided to Caltrans staff and planning staff from San Diego Association of Governments (SANDAG). In addition, program directors from UC Berkeley highlight the value of Caltrans PeMS to potential users by regularly participating in national conferences and committees. Initial cost to establish the Caltrans PeMS was approximately $8 million and was paid for by Caltrans. There was no cost sharing for the initial effort, although UC Berkeley hosts the system at its main campus. Annual maintenance of the system requires approximately 1.5 full time equivalent (FTE) positions and software upgrades that cost $150,000-$200,000 annually.
The Michigan ITS Center (Detroit MITS) is the hub of ITS technology applications at the Michigan Department of Transportation (MDOT). The Detroit MITS ADMS is capable of providing raw data as well as aggregated data. Both the raw and aggregated formats are used in a wide range of applications. Detroit MITS center staff oversee a traffic monitoring system consisting of thousands of loop detectors, 156 closed circuit television cameras, 59 DMSs, 61 ramp meters, and 11 highway advisory radio transmitters. Data for the ADMS are collected through two systems of loop detectors. The older system covers 32 miles of freeway with single loop detectors located at 1/3-mile intervals. Data collected from this system are aggregated to hourly lane volumes. The new system covers 150 miles of freeway with double loop detectors at nominal 2-mile intervals. Data collected by the new system are in 1-minute intervals and includes volume, occupancy, and speed.
The original design goal of the ADMS was to simplify collection of traffic counts and to support traffic management efforts such as analysis of ramp meter effectiveness and to supplement development of Highway
Performance Monitoring System (HPMS) input. A requirement for hourly data was included in the design when the system was expanded in 1999. The design focus was not on a single application but rather on supporting MDOT congestion management efforts. Although the system resides at a TMC that is responsible for 250 miles of freeway in the Detroit
metropolitan area, the focus of the ADMS at this time is supporting traffic information needs of MDOT planners. Design was led by a combined Detroit MITS-MDOT team that also included consultant support. Mike Walimaki, Supervisor of the Travel Information Unit at MDOT’s Bureau of Transportation Planning describes the partnership that made the Detroit MITS possible. “The traffic data is very important in the Metro Detroit area and without the cooperation of the MITS staff traffic count data on these freeways and major ramp interchanges would be nearly impossible to get. This cooperative effort definitely helps MDOT obtain the best possible data to drive transportation planning efforts and continue to receive the states fair share of transportation funds from the FHWA. We are looking for many more years of cooperation and maybe increased use of data as congestion and truck traffic concerns continue to come to the front.”
System Costs
System Design
Detroit MITS
System Overview
Case Studies
Database Formats
Data in the Detroit MITS system are maintained in a centralized database at the Detroit MITS center. Data are stored in a flat file data format using commercially available database and spreadsheet
applications.
System Users
The main users of the Detroit MITS system are MDOT planners, MDOT staff responsible for providing traffic information through the Detroit MITS center’s ATIS, and maintenance staff responsible for data collection devices such as loop detectors. Other users include Southeast Michigan Council of Governments (SEMCOG) planners responsible for
transportation analysis.
Role of National Architecture and ITS Standards in ADMS Design
The system was originally developed as part of the ITS Early Deployment Federal grant program and predates inclusion of ADUS into the
National ITS Architecture, as well as standards for ADMS development.
Data Selection and Collection
Data are collected from over 2,200 loop detectors located on freeway access ramps and freeway mainlines. The older system collects data from single loop detectors located on 32 miles of freeway. These detectors are scanned every 10 milliseconds by the system and the data are stored to magnetic tape. Data collected by the new system are aggregated in the field at 20-second intervals and then sent to the main center where they are then aggregated in 1-minute intervals and stored.
Data Quality Assurance
The Detroit MITS system automatically checks data quality based on diagnostics that evaluate how well each loop is operating. Flags such as “Loop down 1 minute” (which means “This traffic detector has been out of operation for this 1-minute period.”) are produced to inform users that data from that location may be suspect. Data monitoring is also performed by comparing current data to historical data, as well as through user feedback.
Making Data from the ADMS Available to Users and How They Are Used
The Detroit MITS ADMS is a stand-alone system. Data from the ADMS are made available only upon request. Updates are provided monthly.
Implementation and System Updates
The Detroit MITS is being implemented in stages, with each stage requiring three to four years from design to implementation. The first stage was initiated in the early 1990s as part of one of the first regional ITS deployments funded by the ITS Early Deployment Federal grant program. Additional functionality was added in 1999. The system is currently being expanded to encompass locations around Detroit Metropolitan Airport.
3-9
“The traffic data is
very important in the
Metro Detroit area and
without the cooperation
of the MITS staff traffic
count data on these
freeways and major
ramp interchanges
would be nearly
impossible to get.”
-Mike Walimaki, Supervisor, Travel Information Unit, Bureau of Transportation Planning, MDOTSystem Operations
Case Studies
Outreach
MDOT does not actively promote availability of data produced by the Detroit MITS outside MDOT and regional planning organizations. Detroit MITS development costs have been shared by MDOT and FHWA. Costs for ADMS development, which were included in a larger project encompassing deployment of ITS in the Detroit region, were not available.
The Minnesota TMC ADMS is the result of a long term partnership between Minnesota DOT (MnDOT) and the University of Minnesota Duluth (UM Duluth). The Minnesota TMC collects data from over 3,500 loop detectors to support traffic monitoring and effectiveness of traffic control devices such as the 430 ramp meters that are monitored by TMC staff. The main purpose of the loops is to manage traffic in real-time and to provide real-time road condition information to the motorists. Data from the system indicated that the ramp metering system had a significant, positive, effect on traffic flow and on the frequency of crashes during a suspension of ramp metering operations mandated by the legislature in 2000. The ADMS that is hosted at UM Duluth’s
Transportation Data Research Laboratory (TDRL) is separate from the daily operations of the Regional Transportation Management Center (RTMC). All aspects of the operations of the RTMC are supported by in-house servers and software applications. The system with its visualization and analysis tools provided by TDRL support a variety of researchers, planners, and traffic monitoring program related data requests.
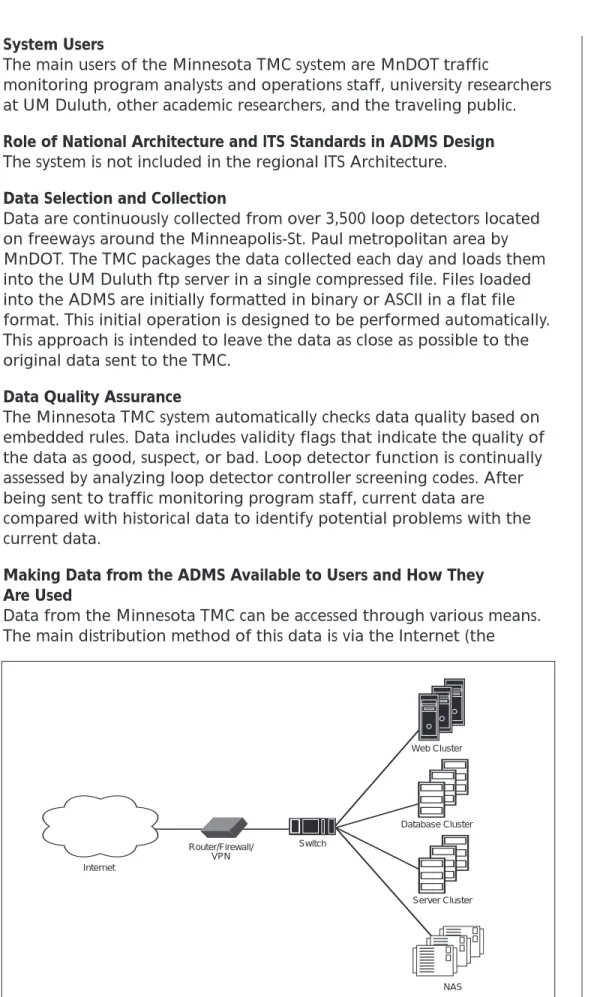
The main system design goal for the Minnesota TMC was to develop a large-scale centralized transportation data center that serves as a transportation information resource for MnDOT. System developers have therefore focused on ensuring that all data are centralized and distributed via the Internet, though individual applications could be distributed or localized, depending on the needs and interests of system users. The hardware architecture design is therefore based on principles of simplicity, scalability, security, and Internet access. The Minnesota TMC’s ADMS design provides efficient single point management and unified data format and analysis functions, as shown in the TDRL hardware and network architecture in Figure 5.
Database Formats
The Minnesota TMC’s database format is structured to facilitate query response to support a broad range of users and applications. Data formats used by the system therefore include commercially available relational database applications, Common Data Format (CDF), Hierarchical Data Formats (HDF), and Binary Indexed Table Format (BITF).
System Costs
Minnesota TMC
System Overview
System Design
Case Studies
System Users
The main users of the Minnesota TMC system are MnDOT traffic
monitoring program analysts and operations staff, university researchers at UM Duluth, other academic researchers, and the traveling public.
Role of National Architecture and ITS Standards in ADMS Design
The system is not included in the regional ITS Architecture.
Data Selection and Collection
Data are continuously collected from over 3,500 loop detectors located on freeways around the Minneapolis-St. Paul metropolitan area by MnDOT. The TMC packages the data collected each day and loads them into the UM Duluth ftp server in a single compressed file. Files loaded into the ADMS are initially formatted in binary or ASCII in a flat file format. This initial operation is designed to be performed automatically. This approach is intended to leave the data as close as possible to the original data sent to the TMC.
Data Quality Assurance
The Minnesota TMC system automatically checks data quality based on embedded rules. Data includes validity flags that indicate the quality of the data as good, suspect, or bad. Loop detector function is continually assessed by analyzing loop detector controller screening codes. After being sent to traffic monitoring program staff, current data are compared with historical data to identify potential problems with the current data.
Making Data from the ADMS Available to Users and How They Are Used
Data from the Minnesota TMC can be accessed through various means. The main distribution method of this data is via the Internet (the
3-11
Internet Router/Firewall/ VPN Switch Web Cluster Database Cluster Server Cluster NASFigure 5. TDRL Hardware and Network Architecture
System Operations
Case Studies
“The development of an
ADMS for ‘continuous’
volume data from our
regional traffic
management center has
given the staff in
MnDOT’s traffic
monitoring program an
opportunity to more
easily tap the wealth of
data that had only been
available earlier through
the use of manually
intensive methods.”
-Mark Flinner, Research Analyst, MnDOT
interface is shown in Figure 6). In addition, data are also available on CD-ROM and DVD. Hard copies may also be available and require coordination with TDRL staff. The ADMS is used by MnDOT staff to support planning designed to improve traffic flow and to support development of estimates for annual average daily traffic (AADT) as part of the traffic monitoring program. In addition, the data are used to evaluate the effectiveness of ramp metering algorithms. ADMS data are also used by MnDOT maintenance staff to facilitate maintenance
scheduling.
Mark Flinner, Research Analyst at MnDOT describes the systems current capabilities and future plans. “The development of an ADMS for
‘continuous’ volume data from our regional traffic management center has given the staff in MnDOT’s traffic monitoring program an
opportunity to more easily tap the wealth of data that had only been available earlier through the use of manually intensive methods. I am hopeful that the partnerships formed during the past few years will be useful in the development of additional data screening and reporting methods to supplement our traditional sources of traffic data.”
Implementation and System Updates
The Minnesota TMC has been in continuous operation since 1984, however, development of the ADMS began in 1997. MnDOT recognized the opportunity to screen and manipulate data to support the traffic monitoring program and to provide an enhanced means of data dissemination. The concept of UM Duluth hosting the ADMS was not related to any specific need of the RTMC. UM Duluth offered an opportunity for MnDOT to shift data management to an outside partner, thus freeing resources for MnDOT, while providing a valuable resource for university researchers.
Outreach
UM Duluth is responsible for most outreach for the system through participation in professional conferences and through its website. Costs for development of the Minnesota TMC ADMS have been provided by MnDOT. UM Duluth pays for hosting the system.
The Maricopa County RADS is the only one of the six ADMSs profiled in this report that was not operational at the time this report was written. Despite this fact, however, much can be learned from their ambitious plans. Maricopa County RADS will collect and store data from the various systems in Maricopa County, Arizona, including the Arizona Department of Transportation (ADOT) Freeway Management System (FMS), Highway Closure and Restriction System (HCRS), the AZTech SMART Corridors, Road Condition Reporting System (RCRS), and transit operations. The City of Chandler is expected to be the first jurisdiction to provide data to the system, starting in 2005. Future data sources also will be incorporated in the Maricopa County RADS as they become available. Potential data sources include commercial vehicle data,
System Costs
Maricopa County
RADS
System Overview
Case Studies
expanded multimodal data, parking and event information, and weather information. Although the system has passed several proof-of-concept milestones such as using HCRS, it is still in development and is not ready for use as a decision support tool. A prototype of the system is currently in use by ADOT. Full implementation will begin following procurement of a heavy-duty server for the data warehousing function. Approximately 300 Gb of data from loop detectors (aggregated in 5-minute increments) will be loaded into an online archive. The system will then keep track of the data, adding about 3.5 Gb each month.
Shifting funding priorities have slowed the implementation of the system.
3-13
Figure 6. TDRL Interface for Accessing and Analyzing Data
The main system design goal for the system is to take ITS data from systems throughout the Phoenix metropolitan area, store the data in a centralized archive data server, and then make the data available for a variety of data users through a common Web interface. Data to be stored include traffic volumes, speeds, closures, incidents, public transit operations, and other data collected by AZTech partner agencies. A key facet of the design approach for the Maricopa County RADS ADMS is the use of Common Object Request Broker Architecture (CORBA) interfaces to primary data stored at each participating agency. Each agency archives data for its own purposes; data are then warehoused in the Maricopa County RADS so that any agency interested in obtaining the data can access them. The source agency can filter data so that only the data they wish to share are accessible. Eventually, information will be available over a public (non-secure) interface.
System Design
Database Formats
The Maricopa County RADS will accommodate a variety of database formats to accommodate the range of agencies that will provide data to the system.
System Users
As part of the requirements development process, the Maricopa County Department of Transportation (MCDOT) conducted extensive user surveys. Based on these surveys, the main users of the system are expected to be Maricopa Association of Governments (MAG) planners, ADOT staff involved in ITS, local traffic engineers, transit agency staff, commercial vehicle operators, and private sector information providers.
Role of National Architecture and ITS Standards in ADMS Design
The Maricopa County RADS is designed and being implemented to be compatible with the National ITS Architecture ADUS, as well as standard data registries, including the Traffic Management Data Dictionary
(TMDD) and other appropriate standards.
Data Selection and Collection
The Maricopa County RADS will rely largely on open source software to address data collection. Open source software is well suited for the wide variety of data types that the Maricopa County RADS is expected to store and process. The system will collect data via the Internet, CD-ROMs, or dedicated landlines, depending upon the agency providing the data. Decisions on which data to archive will be as decentralized as possible, leaving it up to the agencies themselves to determine which data they wish to provide to the system. At a minimum, the system will accommodate freeway data from ADOT and arterial data from the City of Tempe.
Data Quality Assurance
Responsibility for data quality will rest with the agencies providing the data to the Maricopa County RADS.
Making Data from the ADMS Available to Users and How They Are Used
Users will access data from the Maricopa County RADS via the Internet. The system will be used to support a variety of analyses. One of the opportunities presented by the system is its capability to blend data from various agencies or sources. The City of Phoenix is expected to develop evacuation planning methods. The Maricopa County RADS is expected to be a reliable source of historical data and near real-time information.
Implementation and System Updates
Planned system updates include development of a Web interface to allow the public to access and use the system.
Outreach
No additional outreach is planned beyond initial contributing agencies until the system is fully implemented.
System Operations
Case Studies
The Maricopa County RADS is being funded primarily through Federal Congestion Management and Air Quality (CMAQ) funding with local match and cooperation of Maricopa County, Arizona DOT, and Maricopa Association of Governments. Annual estimated maintenance costs for the system are $150,000, not including hardware and software
upgrades.
The ITS system implemented at King County Metro was originally designed to support transit operations and service planning by
providing staff with vehicle location, schedule adherence information, emergency alarm processing, and incident information. Archiving of AVL data is performed to support route development and schedule
adherence analysis. Over time, however, other agencies have recognized the value of the information in the archive, especially the AVL data that tracks the location of buses in real time. When examined historically, it was found that these data provide a comprehensive understanding of travel times along bus routes. King County Metro currently publishes AVL data to the Internet via applications developed by the University of Washington, as part of a suite of traveler information products
developed for the SmartTrek project. “SmartTrek” is the name of Seattle’s regional ITS deployment effort funded by the Metropolitan Model Deployment Initiative (MMDI) Federal grant program. Seattle was one of only four metropolitan areas selected under the MMDI program. Planning for SmartTrek began in 1996, and it became operational in 1999. Figure 7 shows one of those products, called “BUSVIEW” that displays bus locations using AVL data.
The original focus of the system design was to provide current vehicle status information for operational supervision. The main purpose for saving data is to allow analysis of system operations and to facilitate staff planning functions. The AVL system used by King County Metro operations staff was not originally designed to store large volumes of historical schedule adherence data. Reporting capabilities and server capacity have been expanded as internal and external customers have identified additional uses for the data. Several significant AVL data quality issues were addressed under the SmartTrek program as
SmartTrek provided real-time AVL information to the public. After the SmartTrek project was completed, King County Metro staff continued to refine the tracking algorithms in order to ensure the highest possible data quality and optimal performance.
Role of National Architecture and ITS Standards in ADMS Design
At the time that the AVL system was originally developed, the ADUS had not been incorporated into the National ITS Architecture, so ITS standards were not applicable to the project.
Data Selection and Collection
The AVL system polls all operational buses on a continuous loop, typically resulting in vehicle location updates every 30 to 90 seconds. This information is provided to the University of Washington servers.
3-15
System Costs
King County Metro
System Overview
System Design
System Operations
Case Studies
Data Quality Assurance
The system continuously monitors data quality as it is collected and does not store data that fall outside of defined parameters. The applications developed by the University of Washington also address data quality in order to filter information going to the public, under the assumption that it is better to report “no data available” or refer customers to the posted schedule at times when the data might be subject to
questionable interpretation.
Making Data from the ADMS Available to Users and How They Are Used
In general, the King County Metro will share its data with any agency or user that makes a request. However, King County Metro typically
aggregates the data to address the nature of the request. With the exception of data used by the University of Washington, King County Metro does not disseminate raw data. The Puget Sound Regional Council and the Seattle Metropolitan Planning Commission occasionally use the data generated by King County Metro to develop strategies to improve air quality. County traffic engineers and planners from various jurisdictions within the county have used the data to assess the
effectiveness of traffic control systems and to adjust signal timing plans. Planners use the data to supplement congestion monitoring programs. The University of Washington uses the data to develop real-time travel planning and information tools.
Implementation and System Updates
The system has been updated to facilitate data sharing and to address other operational issues related to improving transit operations. King County Metro plans to shift from a signpost and odometer AVL system to a global positioning system (GPS) system in the future.
Outreach
King County Metro conducts outreach with various internal user groups, but has not pursued external customers.
Costs of the system were combined within overall hardware/software package which was originally funded by FHWA under the Metropolitan Model Deployment Initiative program. Software packages for computer-aided dispatch (CAD)/AVL systems that process the type of AVL data used in the King County Metro can cost as much as $1 million or more, depending on the size of the transit system and desired features. This cost does not include the hardware on the transit vehicles or the communications system required to get the location information from the vehicle to the operations center.
System Costs
Case Studies
3-17
Figure 7. Screen View from SmartTrek Showing Bus Locations
from AVL Data
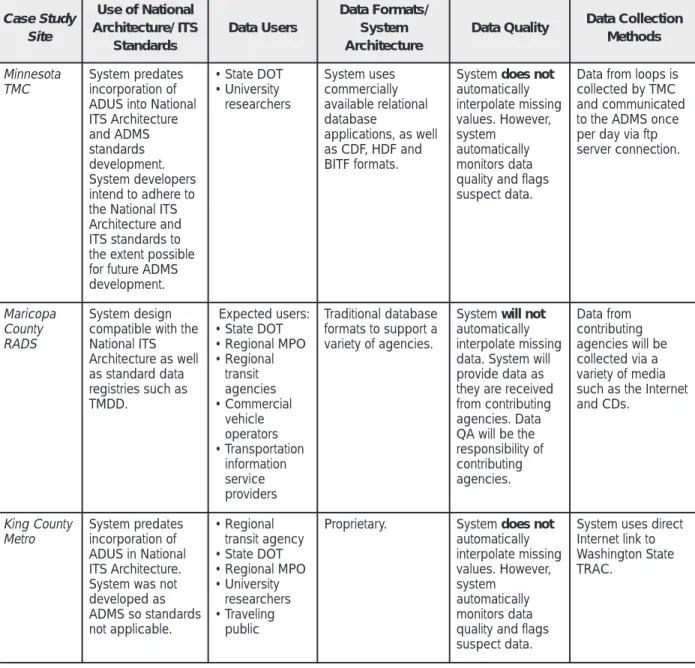
Although the case study sites represented a broad cross section of ADMS systems in terms of implementation and years of operation, a number of trends can be observed. The systems reviewed were designed without the benefit of established standards such as the TMDD, yet the majority of these systems share common functionalities such as automated data interpolation or quality assurance systems. Agencies and individuals making use of the systems are also relatively consistent, despite the fact that King County Metro’s system was not originally designed for use by outside agencies. Cross-cutting findings such as the role of the National ITS Architecture and ADUS standards during ADMS design, data quality, data user and other findings for each of the case study sites are
summarized in Table 3.
4-1
Cross-Cutting Findings
Case Study Site Use of National Architecture/ ITS Standards Data Users Data Formats/ System ArchitectureData Quality Data Collection Methods
Washington State TRAC
System predates incorporation of ADUS into National ITS Architecture and ADMS standards development. • State DOT • University researchers • Regional MPO • Consultants The 20-second archive is stored as part of an Oracle database. The 5-minute archive uses a flat file structure (typically in ASCII text). Centralized system collects data and distributes traveler information via Internet.
System does not automatically interpolate missing values. The system requires the individual user to decide how they will deal with bad and missing data. Data includes flags to alert users of suspect data.
System collects data via a secure Internet connection to a server hardwired to the WSDOT freeway operations computer or data in the form of flat files stored on CD-ROMs. Caltrans PeMS System incorporated in regional ITS architectures. System predates final ITS standards development. Standards were used when applicable and available. • State DOT • University researchers • Consultants • Media • Traveling public • Value added resellers Database consists of 2 TB of historical data stored in commercially available database format. Centralized system connected to TMCs via WAN. System does automatically interpolates missing values. System performs diagnostic on each loop in the system.
Data collected from TMCs using Caltrans WAN. Incident data also provided by California Highway Patrol. Michigan MITS System predates incorporation of ADUS into National ITS Architecture and ADMS standards development. • State DOT • Regional MPO Majority of data stored in commercially available database and spreadsheet-compatible format. Data for a small portion of the system stored on magnetic tape.
System does not automatically interpolate missing values. However, system automatically monitors data quality and flags suspect data based on loop function.
Data collected via a complex hybrid communication system consisting of an OC-48 SONET* fiber optic ring backbone, more than 135 spread spectrum radio links and coaxial cable.
*OC-48 SONET= Optical Carrier-48 Synchronous Optical Network
Case Study Site Use of National Architecture/ ITS Standards Data Users Data Formats/ System Architecture
Data Quality Data Collection Methods
Minnesota TMC
System predates incorporation of ADUS into National ITS Architecture and ADMS standards development. System developers intend to adhere to the National ITS Architecture and ITS standards to the extent possible for future ADMS development. • State DOT • University researchers System uses commercially available relational database applications, as well as CDF, HDF and BITF formats.
System does not automatically interpolate missing values. However, system automatically monitors data quality and flags suspect data.
Data from loops is collected by TMC and communicated to the ADMS once per day via ftp server connection.
Maricopa County RADS
System design compatible with the National ITS Architecture as well as standard data registries such as TMDD. Expected users: • State DOT • Regional MPO • Regional transit agencies • Commercial vehicle operators • Transportation information service providers Traditional database formats to support a variety of agencies.
System will not automatically interpolate missing data. System will provide data as they are received from contributing agencies. Data QA will be the responsibility of contributing agencies. Data from contributing agencies will be collected via a variety of media such as the Internet and CDs. King County Metro System predates incorporation of ADUS in National ITS Architecture. System was not developed as ADMS so standards not applicable. • Regional transit agency • State DOT • Regional MPO • University researchers • Traveling public
Proprietary. System does not automatically interpolate missing values. However, system automatically monitors data quality and flags suspect data.
System uses direct Internet link to Washington State TRAC.
Table 3. Comparative Summary of Six ADMSs
(Continued from previous page)Improved Planning
The addition of the ADUS to the National ITS Architecture was largely driven by transportation planners who hoped that ADMSs would improve transportation planning. The results to date from the six ADMSs profiled in this report are mixed. In some cases, project staff were not aware of any improvements to long-range planning efforts based on the use of their archives while others noted that formal output from their systems to support long-range planning were well publicized in the region. None reported conducting outreach to promote use of their archive to support long-range planning.
Staff from Washington State TRAC and Detroit MITS reported that the Puget Sound Regional Council and the Southeast Michigan Council of Governments, respectively, used their data archives to support their long-range planning analyses. In addition, King County Metro provides archived AVL data to support congestion management analysis by the Puget Sound Regional Council, as well as the Seattle Metropolitan Planning Commission.
According to staff from Washington State TRAC, the local consulting community regularly uses reports generated by their system, which suggests that other agencies may also be using the outputs of Washington State TRAC’s archive-based analyses.
ADMSs also have the capability to overcome one of the limitations of traditional planning, which is to collect data and analyze the
performance of the transportation system under only average
conditions. ADMSs, however, capture data continuously, and are thus able to assess the performance of the transportation network under both average and extreme conditions, such as severe weather, significant incidents, and special events.
Improved Policy Decision-Making
The experience of Washington State TRAC, Caltrans PeMS, and the Minnesota TMC system demonstrate the vast potential that archived data systems offer for supporting improved policy decision-making. All three ADMSs cited significant benefits derived from their ADMS in supporting their goals and initiatives. For example, Caltrans PeMS figured prominently (mentioned on nearly every other page) in a Gubernatorial review of statewide agencies.
Washington State TRAC reported that the archives are a key source of data used for communicating with the public and decision makers. WSDOT uses the archived data to assess the impact of management decisions and to test the potential impact of alternative future
scenarios. WSDOT often uses the data as a key input into its decision-making process. WSDOT is committed to discussing the performance of the roadway system with the state legislature and public, and the archive has given them immense credibility when it comes to discussing that performance.