www.small-journal.com
In Situ Visualization of the Structural Evolution and
Alignment of Lyotropic Liquid Crystals in Confined Flow
Adrian Rodriguez-Palomo, Viviane Lutz-Bueno, Xiaobao Cao, Roland Kádár,
Martin Andersson, and Marianne Liebi*
DOI: 10.1002/smll.202006229
1. Introduction
Hierarchical structuring with different architectures in the micro- and nano-scale often bring an improvement in the mechanical
Self-assembled materials such as lyotropic liquid crystals offer a wide variety of structures and applications by tuning the composition. Understanding materials behavior under flow and the induced alignment is wanted in order to tailor structure related properties. A method to visualize the structure and anisotropy of ordered systems in situ under dynamic conditions is presented where flow-induced nanostructural alignment in microfluidic channels is observed by scanning small angle X-ray scattering in hexagonal and lamellar self-assembled phases. In the hexagonal phase, the material in regions with high extensional flow exhibits orientation perpendicular to the flow and is oriented in the flow direction only in regions with a high enough shear rate. For the lamellar phase, a flow-induced morphological transition occurs from aligned lamellae toward multilamellar vesicles. However, the vesicles do not withstand the mechanical forces and break in extended lamellae in regions with high shear rates. This evolution of nanostructure with different shear rates can be correlated with a shear thinning viscosity curve with different slopes. The results demonstrate new fundamental knowledge about the struc-turing of liquid crystals under flow. The methodology widens the quantitative investigation of complex structures and identifies important mechanisms of reorientation and structural changes.
A. Rodriguez-Palomo, Prof. M. Liebi Department of Physics
Chalmers University of Technology Gothenburg 41296, Sweden E-mail: [email protected] Dr. V. Lutz-Bueno[+]
Swiss Light Source Paul Scherrer Institute Villigen 5232, Switzerland
strength and toughness,[1–3] interesting
optical behaviors,[4–6] or better biological
performance (e.g., biocompatibility, and osteoconductivity).[7–9] Found in nature or
created artificially in the lab, self-assembly processes are commonly shown to take part in introducing hierarchy in materials, where individual units such as molecules, nanoparticles, or elongated structures are spontaneously arranged into structures with long-range order. The arrangement is driven by weak interactions, and thus the structure can reversibly break and rear-range upon change of solvent conditions or as a result to external forces.
Lyotropic liquid crystals based on block copolymers, such as the ones studied here, are a good example of self-assembled hierarchical systems. Amphiphilic poly-meric chains are folded and ordered in dif-ferent structures (e.g., spheres, cylinders, and bilayers) creating the building blocks, which are assembled in periodic structures in the meso- and micro-scale. Complex nanostructures can be reached controlling only the composition of the liquid crystal(s). In contrast with other liquid crystals formed by large molecules conforming a fluid, these systems are highly viscous solid-like materials with similar rheological properties than viscous colloidal fluids and
[+]Present address: Department of Health Sciences and Technology, ETH
Zurich, Zurich 8093, Switzerland
The ORCID identification number(s) for the author(s) of this article can be found under https://doi.org/10.1002/smll.202006229.
Dr. X. Cao
Institute for Chemical and Bioengineering ETH Zurich
Zurich 8093, Switzerland Prof. R. Kádár
Department of Industrial and Materials Science Chalmers University of Technology
Gothenburg 41296, Sweden Prof. M. Andersson
Department of Chemistry and Chemical Engineering Chalmers University of Technology
Gothenburg 41296, Sweden Prof. M. Liebi
Empa, Swiss Federal Laboratories for Materials Science and Technology
Centre for X-ray Analytics St. Gallen 9014, Switzerland © 2021 The Authors. Small published by Wiley-VCH GmbH. This is an
open access article under the terms of the Creative Commons Attribu-tion-NonCommercial License, which permits use, distribution and repro-duction in any medium, provided the original work is properly cited and is not used for commercial purposes.
polymers. Other previous studies have examined these mate-rials under static conditions[10–12] focusing their discussion on
polymers self-assembly and polymer rheology.
Pluronic is a nonionic triblock copolymer with basic chain structure of polyethylene oxide–polypropylene oxide–polyethylene oxide (PEO–PPO–PEO). It is widely studied both experimentally and computationally[13,14] and due to its stability and safety it is
used in many biological and pharmaceutical applications.[15,16]
When it is mixed with water and/or oil, a wide variety of structures can be formed, among which hexagonally packed cylinders and lamellar are the most interesting for hierarchical structuring. Such structuring can for example be performed through extrusion-based 3D printing. When these materials are extruded through a nozzle or die, the nano entities may become aligned in the flow direction, which produces a highly anisotropic macrostructure resulting in improved structure related proper-ties. Such properties are of high interest in applications such as scaffolds for catalysis and separation,[17] templating,[18]
encapsula-tion of molecules as drug delivery agents and nanocarriers,[19,20]
or as media to obtain structural data of molecules.[21,22]
Introducing anisotropy into an ordered structure highly influ-ences the physical properties of the final material as seen in some previous works using lyotropic liquid crystals for bioin-spired anisotropic materials.[23,24] In a further step, the anisotropy
in the nanostructure can be used to guide the mineralization of the liquid crystal by precipitating needle-like ceramic particles[25]
resulting in an ordered composite having similar structures and properties as bone. However, the degree of alignment, effect of flow rate and geometry of the nozzle, or possible structural changes induced by flow stress that are unknown will produce deviations from the expected results. Understanding the pro-cesses involved during production of these materials will help future researchers to predict undesired changes or direct the nanostructure for a controlled performance on the macroscale.
In order to study the structure of liquid crystals and ordered systems in general, small angle scattering using light, neutrons, and X-rays[26,27] has been proven useful. The use of scanning
small angle X-ray scattering (SAXS) with a focused beam is of interest specifically for hierarchical structures, since it allows us to analyze their nanostructure and orientation with spatial resolution in macroscopic systems. This method is particularly useful when examining anisotropic systems, such as the liquid crystals studied here. The anisotropy in the scattering pattern makes it possible to quantify degree and angle of orientation as observed before in other systems.[28,29]
The aim of this research is to bring new insights about flow behavior of self-assembly systems, as demonstrated here using lyotropic liquid crystals. This work addresses several length scales, ranging from the molecular to the nano-assembly and microdomains. The knowledge brought by this work, can potentially be used in future research of 3D printed scaffolds and templating technologies for microelectronics, biomaterials, or drug encapsulation.
2. Results and Discussion
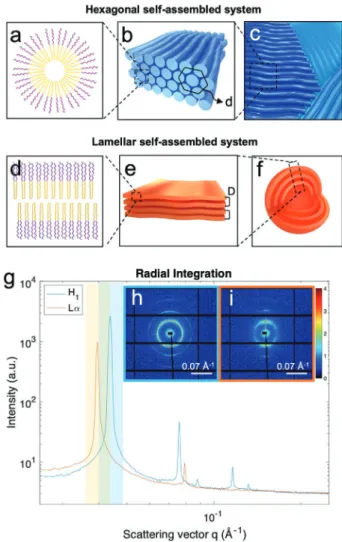
The materials used in this study consist of self-assembled cylindrical micelles in a hexagonal compact lattice (H1) with
characteristic cylinder distance, d, as well as planar bilayers in a lamellar structure (Lα) with lamella-to-lamella space, D, as
rep-resented schematically in Figure 1. The characteristic distance between elements, usually in the nanometer scale, is highly dependent on composition. These two phases were chosen since they have ordered structures in one (Lα) or two (H1)
dimensions which can extend infinite in one dimension. SAXS was used to determine the structure of the lyotropic liquid crystals. The SAXS results in Figure 1g show a mesoscopic order for both phases due to the presence of clear diffraction peaks. The amphiphilic character of the triblock copolymer
Figure1. a) Pluronic F-127 in cylindrical cross-section, b) self-assembled cylinders in a hexagonal 2D lattice with cylinder interdistance, d. c) At rest, the self-assembled cylinders form microdomains with different orienta-tions. d) Pluronic F-127 can also form bilayers which are e) self-assembled in a lamellar structure with interlamellar distance, D. f) They can form extended lamellae or close themselves as multilamellar vesicles. The pink and yellow parts in (a) and (d) corresponds to the hydrophilic and hydrophobic blocks, respectively, in the triblock copolymer. g) Integrated intensity along the azimuthal angle for the hexagonal and lamellar phases of the lyotropic liquid crystals. The insets show the 2D scattering signal recorded by the detector for h) hexagonal and i) lamellar. The anisotropy in the rings shows the orientation of the self-assembled structure. The highlighted zones for H1 (blue) and Lα (orange) indicate the q-ranges
used for the orientation and angle calculation as well as for the peak fitting analysis.
and the use of a ternary system polymer/water/oil create polar and apolar domains with the polymer at the water–oil interface. The terminal polyethylene oxide chains can be found in the water domains while the middle polypropylene oxide block folds to be in contact with 1-butanol (Figure 1a,d). The self-assembled phase can be identified by calculating the ratios between the positions of the diffraction peaks. The lyotropic liquid crystal with composition 35:50:15 wt% of F-127:water:butanol has a ratio of 1:√3:2:√5 and the composition 25:47.5:27.5 wt% has a ratio of 1:2 in the positions of the diffraction peaks. This is in agreement with previous studies relating the ratio 1:√3:2:√5 with H1 and 1:2 with Lα ordered structures.[30] In the H1 phase,
cylindrical micelles are ordered in a 2D hexagonal lattice with cylinder interdistance d = 16.72 nm (Figure 1b). The Lα phase
consists of a stack of bilayers (lamellae) which are assumed to have infinite lateral dimension[31,32] and an interspace D =
15.95 nm (Figure 1e). Additionally, polarized light microscopy
and birefringence microscopy was performed (static condi-tions) as shown in Figure S2, Supporting Information.
A rheological characterization of the two different self-assembled structures was performed by oscillatory and steady shear experiments. The results from the oscillatory tests are shown in Figure 2a,b. The frequency sweep in Figure 2a repre-sent the linear viscoelastic storage, G′, and loss, G″, moduli for a shear strain of 0.01%, which is within the linear viscoelastic regime, determined by the strain sweep in Figure 2b. For both phases, the material response is dominated by its elastic com-ponent, G′ > G″, while the moduli are largely parallel and inde-pendent of the angular frequency, particularly for H1, which is
characteristic of a gel-like behavior.[33] This is an indication that
the rheological material response in both phases is dominated by the interaction between the self-assembled structures.[34]
The moduli from strain sweep tests are presented in Figure 2b, for an angular frequency of 1.0 rad s−1. From a quantitative
Figure2. Results from rheology measurements of the H1 and Lα lyotropic liquid crystals. a) Frequency sweep and b) strain sweep from the oscillatory
tests showing the storage (G′) and loss (G″) modulus of both phases. Black arrows indicate the point where strain overshoot can be identified. Steady shear measurements representing the c) shear stress and fitted data using a power law for non-Newtonian fluids (σ = ⋅K γn) and d) shear viscosity.
point of view, the dynamic moduli in the linear viscoelastic region (≈<0.1%) correspond to the frequency sweep data in Figure 2a, confirming again the gel-like material response. For strain amplitudes beyond the linear viscoelastic regime, a local increase in the storage and loss modulus was found in
H1, γ in 2–10%, which is known as strong strain overshoot.[35]
Strong strain overshoot has been related with the intermolec-ular interactions between polar groups in large ordered systems and this effect could be explained as cluster size growth.[35–37]
As aggregates start moving and orienting during flow their size increase, cluster growth processes become relevant and as a consequence, G′ and G″ increase. For strain amplitudes
>10 aggregates tend to break up and start orienting in the flow direction. In the case of Lα, at the transition to nonlinear
defor-mations, G′ drops while G″ slightly increases, which is known as weak strain overshoot.[35] This effect is probably linked to
break up of cluster into layers and sliding between those layers. The storage modulus, related with energy dissipation, changes due to the microstructural break-up. At high strain, the struc-ture is oriented and layers slide and flow freely.[37,38] At high
shear rates G″ becomes higher than G′. From that point on, the original microdomains are likely broken apart allowing for reorganizing, and the materials flows more easily.
The shear viscosity function and flow curve are shown in Figure 2c,d. The shear stress as well as shear viscosity can be divided in three regimes with different slopes. Ordered micellar systems[39,40] with the same self-assembled structures as well as
other colloidal solutions[41] follow a power-law trend where the
exponent (slope) is defined as the power law index (n), being
<1 for shear thinning, 1 for a Newtonian, or >1 for shear thick-ening fluids.[42] A general higher shear thinning behavior for H1 compared to Lα can be seen in Figure 2c. While H1 shows a
shear thinning character with similar indexes of 0.07 and 0.18 at regime ΙΙ and ΙΙΙ, Lα has a pronounced difference between
them, being 0.25 in the regime ΙΙ and 0.62 in the regime ΙΙΙ. The viscosity dependence of the shear rate for both materials is shown in Figure 2d. H1 presents a shear thinning
char-acter with a more uniform curve due to the small differences between the shear thinning indexes. In contrast, Lα clearly
shows the same three regimes seen in the shear stress. It is important to note that even at the lowest shear rates, the sam-ples cannot be considered to have a completely random distri-bution of orientations. The effect of the sample loading induces a slight orientation parallel to the shear plane, which cannot be avoided.
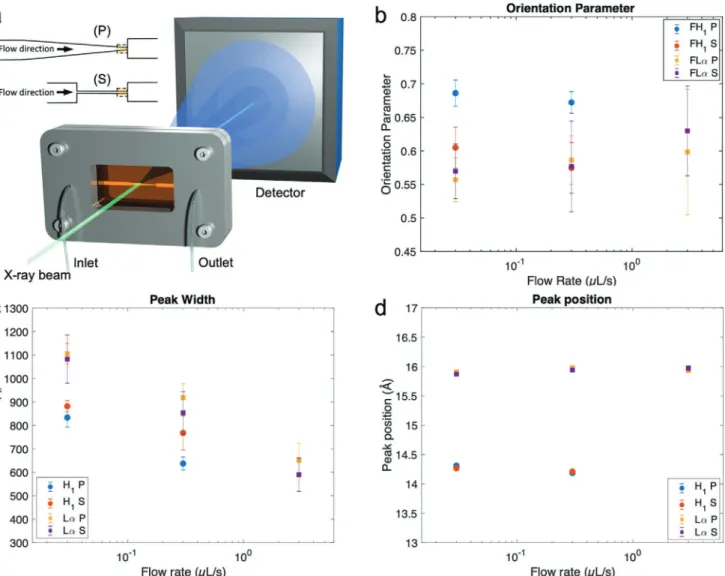
The rheology experiments indicate the effect of shear; how-ever, using microfluidics more complex flows combining shear and extension, as occurring in extrusion-based 3D printing, can be achieved. Scanning SAXS was carried out to determine the structure of the lyotropic liquid crystals with spatial resolu-tion along the microfluidic channels (see set-up schematics in
Figure 3a). Two different channels were used for both materials
with flow rates of 0.03, 0.30, and 3.00 µL s−1. The designs
mim-icked the commonly used blunt and conic 3D printing nozzles, designed to have equal contraction ratio. A channel of 1.25 mm width was followed by a progressive contraction of 5° to 100 µm, and a sharp contraction followed by a straight channel of 100 µm. For the three flow rates used, the orientation and peak parameters of the main diffraction peak (Figure 1g) were
averaged in the first 400 µm before the end of the contraction, indicated by the yellow square in Figure 3a. The liquid crystal with H1 phase has an average Hermans’ orientation parameter
of 〈fa〉 = 0.68 ± 0.01 in the progressive contraction compared
with 〈fa〉 = 0.59 ± 0.02 in the sharp one. For Lα, no difference
is seen between the channel geometries, with 〈fa〉 = 0.58 ± 0.04
and 〈fa〉 = 0.59 ± 0.03 between progressive and sharp
contrac-tions, respectively, as shown in Figure 3b. An increase in the flow does not improve the orientation in H1, which
fluctu-ates around these values and slightly increases the orientation parameter in Lα up to 0.60 in the progressive and 0.63 in the
straight microchannels. A high flow rate decreases the peak width (Figure 3c) probably caused by an increase in the con-finement and enlargement of the crystalline domains, which improves the long-range order. The peak position in Figure 3d; however, stays constant at an interspace of 14.2 and 15.9 Å in
H1 and Lα, which demonstrate the stability of those systems in
the lower hierarchical scale (Figure 1a,b,d,e) under confinement. No peak shifts were observed in the nanometer scales due to the increase in flow rate in any of the performed experiments. To further investigate the influence of flow on the nanostructure, an equivalent batch of samples was studied in equilibrium condi-tions in glass capillaries, showing the same structural features; thus the self-assembled phase and inter cylinder/lamella distance are not influenced by the flow in the microfluidic channel (see Figure S1, Supporting Information). This proves that the self-assembled structures do not deform or distort at any time.
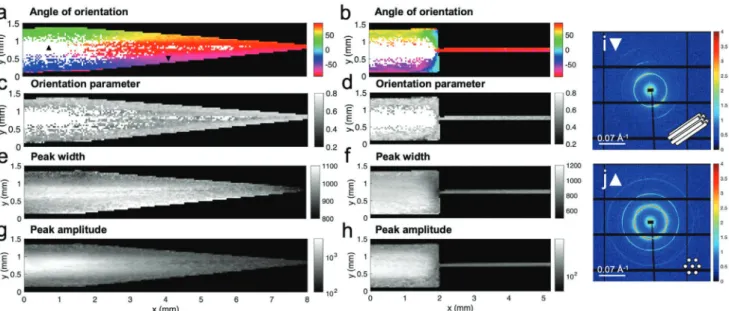
The angle of orientation and orientation parameter according to Hermans’ algorithm are shown in Figure 4a–d for H1 of the
system Pluronic F-127/water/butanol. The azimuthal intensity of the previously selected q-range (Figure 1g) was integrated for each pixel (i.e., scanning point) and the number of inten-sity maximum was quantified. Some channel regions have two intensity maxima along the rings that correspond to the asym-metric scattering of ordered cylindrical micelles aligned in the flow direction (Figure 4i). However, in the central area of the microchannel the scattering showed six intensity maxima along the ring (Figure 4j). This type of diffraction signal in H1 2D
lattices is expected only when the crystalline axes are oriented perpendicular to the beam.[43,44] Thus, the hexagonally packed
cylinders in these regions are oriented out of plane, perpendic-ular to the flow direction (i.e., parallel to the X-ray beam). The scattering pattern found in that region is not compatible with the orientation quantification by the Hermans’ algorithm used in cases of two intensity maxima. In the angle and orientation parameter plot, the corresponding pixels were masked out for the orientation analysis and are marked white in Figure 4. The angle of orientation reached in the contraction is similar for both geometries, being in the range of ±3° considering 90° as the flow direction (Figure 4a,b). The straight channel reaches a high degree of uniformity due to the sudden contraction and relatively large length thereof. The quantified orienta-tion parameter (Figure 4c,d) is similar between both channel geometries and has a highly oriented layer at the walls of the channels where the velocity is lower but the expected shear rate higher. The results in the straight channel show a slightly higher average orientation in the contraction. A sharp contrac-tion increases the extensional flow, which plays an important role in the alignment during flow. However, the perpendicular
orientation found in the central area, where the velocity is max-imum as well as the elongation component of the flow, contra-dicts the expected orientation due to flow. Such perpendicular orientation has been previously observed for nematic struc-tures in other flow-based systems including in simple shear flow,[45,46] flow assisted by interfacial forces during film
forma-tion,[47] and simple shear flow (coating) followed by drying.[48]
In the absence of other effects, the orthogonal orientation was explained in terms of the interplay between elastic-dominated and viscous-dominated flow regimes. This could be quantified in terms of the Eriksen number (Er),[49]
Er vL K η
= (1)
where η is the shear viscosity, v is a characteristic velocity, L is a characteristic flow length scale, and K is the elastic constant of the liquid crystal.[50] In simple shear flow, at high shear rates where
viscous forces dominant (large Er), the director was aligned in the flow direction, whereas at low shear rates (small Er) where elastic forces are dominant, lyotropic chromonic liquid crystals
were found oriented perpendicularly to the flow direction.[45,46]
For pressure-driven channel flows, such as the ones investigated in this work, where one characteristic velocity would determine the Er of the channel flow,[51] it is important to note that locally in
the channel cross section there is a velocity gradient and as a con-sequence the shear rate varies locally.[52] Thus, near the channel
walls, where the velocity gradients are high, viscous forces would be expected to dominate resulting in a director orientation in the flow direction. In contrast, in the center of the flow domain the local shear rates are low, liquid crystal elastic forces are dominant. We conclude that in the central region with high extensional flow, the elastic effects are still dominant, with insufficient local shear and extensional rates to orient the liquid crystals.
Figure 4e–h presents the peak parameters obtained by peak fitting of the main peak associated with the cylinder interspace (Figure 1g). H1 has a higher peak amplitude in the middle,
which is related to the fact that there are six scattering spots (Figure 4j) that are averaged along the azimuth compared to the regions in which there are two partial rings (Figure 4i). The peak width has a decreasing trend toward the contraction indicating
Figure3. a) Experimental set-up for microfluidics scanning SAXS and scheme of the microchannels used with a progressive (P) and sharp (S) contrac-tion for different flow rates. The colored dashed box (400 µm in length) indicates the area where the b) Hermans’ orientation parameter, c) peak width, and d) peak position were averaged. The microfluidic channel is scanned through the incident X-ray beam and the signal is recorded by a 2D detector.
an improved long-range order in the crystalline domains pre-sumably due to the high extensional rates in the confinement.
Figure 5 compiles the scanning SAXS analysis for the
lamellar lyotropic liquid crystal. The orientation of Lα occurs
more downstream to the contraction and is more uniform in the channel width (Figure 5a,b) compared to H1 (Figure 4a,b),
which presumably is connected to the lower viscosity of Lα
(Figure 2b). Orientation in the flow direction is reached in the contraction, being more homogeneous in the rectan-gular microchannel. Three different areas along the channel width can be identified in the orientation parameter for both
geometries, being more obvious in the channel with the pro-gressive contraction as shown in Figure 5c (areas A, B, and C). Averaging the orientation parameter in a line along the
x axis for the three areas, there is a highly oriented layer at
the walls (〈fa〉A = 0.72 ± 0.02), then the orientation decays
(〈fa〉B = 0.46 ± 0.04) and increases again (〈fa〉C = 0.59 ± 0.02) in
the middle of the microchannel, as illustrated in Figure 5i. The shear rate is maximum at the walls and then decreases to a min-imum in the middle of the channel. The regimes found with rheology in the viscosity curve (Figure 2d) can be associated to the areas found in the orientation parameter of the scanning
Figure4. Results from scanning SAXS measurements of H1 lyotropic liquid crystals within microfluidic channels showing a,b) the angle of orientation
of the scattering signal color-coded according to the color scale from −90° to 90°, c,d) the Herman’s orientation parameter, e,f) diffraction peak width and g,h) peak amplitutde. Flow rate is 0.03 µL s−1 from left to right. The angle of orientation of the scattering is color-coded according to the color
scale from −90° to 90°. Scattering pattern from a pixel where the orientation of the domain is i) perpendicular (▼) and j) parallel (▲) to the beam.
Figure5. Results from scanning SAXS measurement on the Lα phase within microfluidic channels showing a,b) the angle of orientation of the
scat-tering, color-coded according to the color scale from −90° to 90°, c,d) the Herman’s orientation parameter, e,f) the diffraction peak width and g,h) peak amplitude. The flow rate is 0.03 µL s−1 direction from left to right. The three regions found in the orientation parameter are indicated with the letters
SAXS experiment. From the calculated wall shear rates (γW),
the maximum value in the channel for Lα corresponds to the
regime III of the viscosity curves (Figure 2b). Figure 6a shows the scattering pattern of representative pixels in each area of the microchannel. The azimuthal intensity in two perpendicular directions was integrated separately (Figure 6b). Close to the channel walls, at high shear rates (area A and regime ΙΙΙ of the viscosity curve), the diffraction peak associated to the lamella interspace (D) shows a strong anisotropy. This indicates aligned lamellae in the direction perpendicular to the flow direc-tion. Those extended lamella structures are oriented parallel to the flow direction and perpendicular to the shear plane in accordance with previous literature.[32] The scattering patterns
obtained in the intermediate area (area B and regime ΙΙ of the viscosity curve) contain the diffraction peak at the same q-value but appears as ring compared to the anisotropic arcs in area A. This is an intrinsic feature of multilamellar vesicular systems, which consist of spherical bilayers with homogeneous wall thickness, which explains the low anisotropy and therefore the low degree of orientation. In the middle of the channel, we can still see the presence of multi lamellar vesicles in the diffraction pattern, indicated by the visibility of the full ring, compared to the arcs with no visible diffraction peak perpendicular to the
flow direction (Figure 6, area C), characteristic for open lamellar structures with no curvature. However, compared to the inter-mediate arc, the ring has two clear maxima perpendicular to the flow direction (Figure 6, area B vs C). In this part of the channel, the shear rate is significantly lower, but the contrac-tion induces a high extensional flow. Thus, multilamellar vesi-cles are stretched toward the contraction. Other studies using rheology and scattering on copolymer systems with self-assem-bled lamellae have shown a viscosity curve with three regimes. These three stages have been associated with defects in lamellae (generally dislocations) and vesicle formation. At low shear rates (regime Ι), the structure was described of having a high number of defects such as dislocations in it. At intermediate shear rates (regime ΙΙ), the formation of multilamellar vesicles has been discussed (Figure 1f), which are broken into lamellae at high shear rates.[53] The viscosity regime Ι is likely dominated
by local rearrangements in the microstructure without signifi-cant conformational alterations, where lamellae start to move in the flow direction. In regimes ΙΙ and ΙΙΙ, with increasing shear rate increasing structural break-up and orientation in the flow direction is expected. Multilamellar vesicles are likely to be formed due to the movement and wrapping of extended lamellae during the local reorientation, which are stretched due to the flow until they break and form well-ordered lamellae at high shear rates (regime ΙΙΙ) (Figure 1e).
The peak width corresponding to the lamellar spacing D (Figure 5e,f) is constant along the length of the progressive contraction but increases at the wall of the microchannel. Also, the channel with a sharp contraction has a higher peak width at the walls while remaining constant in the central area. However, it increases in the proximities of the con-traction and decreases in the corners. This result could be explained by the high extensional flow created by the sudden contraction in that region. The velocity of the fluid and elon-gation is expected to be significantly higher and the long-range order might be temporally distorted in that point as seen in the decrease of the orientation parameter (Figure 5d). The peak amplitude (Figure 5g,h) is higher at the walls of the channel and in the contraction, where the degree of orienta-tion also increases. This indicates a high order in regions with high shear stress.
As seen in the direction of orientation, color-coded in Figures 4a,b and 5a,b, high shear is not a necessary condi-tion to produce alignment in the liquid crystals, but a certain threshold should be reached. The material seen upstream in the scanned region has not reached complete alignment, even though it flowed through a long channel from the sample res-ervoir, which has low shear rate values. Extensional forces and a high enough shear rate are necessary to reach the alignment in the liquid crystal, which are caused by the contraction from large to small channel width.
3. Conclusions
The structure of lyotropic liquid crystals and their behavior under flow in microfluidic devices was visualized in situ. They were arranged in H1 and Lα self-assembled structure with a
gel-like rheological behavior. The H1 phase showed a strong strain
Figure6. a) Scattering signal of the lamellar structures in the three areas (A, B, and C) with different orientation parameter (see Figure 5c) and interpretation of the most likely morphologies according to the pattern. b) Radial integration in two segments with a difference of 90° plotted in solid and dashed line. The scattering seen in A correspond to an aligned lamellae structure, whereas B shows the scattering of multilamellar vesi-cles, and C shows the multilamellar vesicles stretched in the flow direc-tion. The curves have been shifted vertically for better clarity.
overshoot due to growth and aggregation of crystalline micro-domains with different orientation. In contrast, the Lα liquid
crystal displayed a weak strain overshoot related with cluster break-up and layer sliding. Both materials are shear thinning, where Lα had three different regimes in its viscosity curve.
Scanning SAXS was proven to be a useful tool to characterize and identify the different processes happening during con-fined flow as well as measuring the orientation and structure of such self-assembly systems. For H1 a shear rate threshold
had to be overcome to achieve orientation in the flow direc-tion. Below that threshold, crystalline domains were unexpect-edly found to be perpendicular to the flow even in regions with high extensional flow. Thus, the control of the flow condi-tions is important to achieve the desired degree of anisotropy in the final object. The induced alignment will strongly influ-ence the performance of the material, such as the mechanical stress distribution in a specific direction[54] or the
mineraliza-tion process when these liquid crystals are used as a template for growth of a mineral phase.[55]
For Lα, a structural transition was observed in flow from
extended lamellae to multilamellar vesicles at medium shear rates. High shear rates are necessary to stretch and break these multilamellar vesicles into extended lamellae again, which is reached at the walls and in the contraction of the microchan-nels. This means that design parameters have to be chosen carefully, since depending on the shear rate the liquid crystal can arrange in well-aligned extended lamellar phase or multi-lamellar vesicles. This is especially important when the appli-cation aims for a 2D structure such as in ceramic/polymer composites.[56] In these cases, the formation of multilamellar
vesicles should be avoided as they will affect the positioning of the particles leading to more isotropic deposition and less orientation.
The peak analysis revealed no peak shifts due to flow rate or confinement, which reflects a very stable system in terms of molecular assembly, that is, Lα or H1 spacing. However, the
scattering pattern anisotropy and peak para meters showed a structural change, which may be overlooked if a detailed study of the self-assembled materials is not performed. The knowl-edge gained in this work can improve the quality and under-standing of hierarchical materials in a variety of applications. This methodology opens a new way to study and visualize the structure of ordered materials and other colloidal systems during flow, in particular in complex flow situation as present in a nozzle of a 3D printer.
4. Experimental Section
Sample Preparation: Lyotropic liquid crystals were prepared following
the ternary system Pluronic F-127 (EO100PO70EO100), 1-butanol, and water
(Milli-Q grade). Pluronic F-127 (pharmaceutical grade) was obtained from BASF and used without further purification. Two different self-assembled structures were obtained modifying the composition of F-127:water:b utanol,[12] being H
1 35:50:15 wt% and Lα 25:47.5:27.5 wt%. The ternary
systems were vigorously stirred and left to equilibrate overnight to form the desired self-assembled structure. The liquid crystals were loaded into syringes and centrifuged to remove all air bubbles.
Microfluidics Fabrication: Microfluidic channels compatible with
synchrotron radiation were used to reproduce the 3D printing nozzles design. The microfluidic chips were prepared according to Lutz-Bueno
et al.[29] where a positive poly(dimethyl siloxane) (PDMS) stamp was
obtained from a silicon hard mold patterned by photolithography. From the PDMS stamp, a sandwich structure composed by a polyimide film with a thickness of 25 µm, a UV curable resin (Norland Optical Adhesive, NOA#81) spacer with the stamped design (i.e., the channel), and a plasma treated glass cover slip was fabricated in clean room conditions. The microfluidic channels were prepared one week before the experiment and therefore the effect of the plasma treatment on the glass surface was neglected. Two designs were prepared for the experiments, which mimic commonly used blunt and conic 3D printing nozzles. The chosen designs had the same contraction ratio from 1.25 mm to 100 µm in width. A microchannel with a sudden contraction to a straight channel of 3.25 mm in length and a microchannel composed by a progressive contraction of 5° and a total length of 6.5 mm were produced. The height of the NOA layer in all of them was 250 µm. The use of microfluidics implied 2D confinement, which should be taken into account for the results interpretation. The microfluidic chips and the necessary tubing were assembled in an aluminum holder which was fixed in the scanning SAXS set-up. Syringe pumps (Cetony, neMESYS 290N) were used to have a controlled flow of 0.03, 0.30, and 3.00 µL s−1
during the whole experiment.
Scanning Small Angle X-Ray Scattering: Scanning SAXS was performed
at the cSAXS (X12SA) beamline at the Paul Scherrer Institute (PSI, Switzerland). The X-ray beam was focused to 40 × 40 µm and was monochromated by a fixed-exit double crystal Si(111) monochromator to an energy of 11.2 keV (1.107 Å). A flight tube with a length of 2 m was placed between the sample and the detector to minimize the air scattering and absorption. The scattering signal was recorded by a Pilatus 2M detector[57] and the transmitted beam was measured with
a photodiode on a beamstop, placed inside the flight tube. For all the measured samples, the exposure time was 0.08 s at a sample-to-detector distance of 2.158 m, which was calibrated with silver behenate.
X-Ray Scattering Analysis: The radial integration of the 2D scattering
patterns was performed in the azimuthal segments with the cSAXS matlab analysis package.[58] The phase of the self-assembled liquid
crystal was identified by the relationship between the diffraction peaks.[12]
The principal diffraction peak in both samples, which corresponded to the cylinder/lamella interspace (see Figure 1) was fitted by a Gaussian from which the peak position, width, and amplitude were obtained.[59]
The azimuthal intensity along the reciprocal scattering vector q was used to calculate the angle and orientation parameter according to the Hermans’ algorithm.[60] The azimuthal intensity in the range −90° to 90°
was normalized and interpolated by a Lorentzian curve, centering the peak position at 0°. According to the Hermans’ algorithm, the Hermans’ orientation parameter 〈fa〉 was calculated using Equation 2 where I(φ)
was the intensity for each azimuthal angle (φ) after the peak recentering. The angle of the orientation was extracted by the peak position in the azimuthal intensity and it was shown in reciprocal space.[61]
3 2cos 12 sin ( ) sin ( ) 0 2 0 f I d I d a
∫
∫
φ φ φ φ φ φ φ(
)
= − π π (2)Rheology: Rheological characterization was carried out using an Anton
Paar MCR702 TwinDrive rotational rheometer in a separate motor-transducer (strain-controlled) configuration. Parallel plate geometries of 25 mm in diameter were used for all the experiments with the exception of the oscillatory tests in the hexagonal liquid crystal where parallel plates of 7 and 15 mm were used. Oscillatory and steady shear measurements were carried out for both samples. Strain sweep tests were performed at 1.0 rad s−1 for a shear strain amplitude range from 0.02% to 200%.
Frequency sweep test were performed at angular frequencies ranging from 1 to 50 rad s−1, with a constant strain amplitude of 0.01% in the linear
viscoelastic range, as determined from the strain-sweep tests. The steady shear tests were performed at a shear rate from 9.0 × 10⁻⁴ to 30 s−1.
The approximate shear rate in the microchannels was calculated using Son’s model.[62] It used the width (W), height (H), and flow rate (Q), and
not independent of the lateral dimensions (W ≈ H). This model calculated the apparent shear rate (γa) in Equation 3 and the wall shear rate (γw),
in Equation 4, where f* was a tabulated function dependent of the ratio height/width and n was the shear thinning index. This calculation gave an apparent shear rate in the order of magnitude of 101 s−1.
Q WH H W f H W a γ = 6 2 +1 ∗ (3) b f a f n w a γ =γ + ∗ ∗ ∗ ∗ 2 3 1 (4)
Supporting Information
Supporting Information is available from the Wiley Online Library or from the author.
Acknowledgements
This work was supported by the Area of Advance Material Science at Chalmers University of Technology, the Swedish Research Council (VR 2018–041449), the Wallenberg Wood Science Center (WWSC), and Kristina Stenborg’s Foundation for Scientific Research. The authors acknowledge the Paul Scherrer Institute, Villigen, Switzerland for the provision of synchrotron radiation beamtime at the beamline cSAXS of the SLS. Part of this work was carried out at the Chalmers Materials Analysis Laboratory, CMAL.
Conflict of Interest
The authors declare no conflict of interest.
Data Availability Statement
The data that support the findings of this study are available from the corresponding author upon reasonable request.
Keywords
lyotropic liquid crystals, microfluidics, nanostructures, rheology, scanning small angle X-ray scattering, self-assembly, X-ray imaging
Received: October 6, 2020 Revised: December 18, 2020 Published online:
[1] P. Tseng, B. Napier, S. Zhao, A. N. Mitropoulos, M. B. Applegate, B. Marelli, D. L. Kaplan, F. G. Omenetto, Nat. Nanotechnol. 2017,
12, 474.
[2] H.-L. Gao, S.-M. Chen, L.-B. Mao, Z.-Q. Song, H.-B. Yao, H. Cölfen, X.-S. Luo, F. Zhang, Z. Pan, Y.-F. Meng, Y. Ni, S.-H. Yu, Nat.
Commun. 2017, 8, 287.
[3] J. J. Martin, B. E. Fiore, R. M. Erb, Nat. Commun. 2015, 6, 8641. [4] L. Shang, W. Zhang, K. Xu, Y. Zhao, Mater. Horiz. 2019, 6, 945. [5] C. Hamon, S. Novikov, L. Scarabelli, L. Basabe-Desmonts,
L. M. Liz-Marzán, ACS Nano 2014, 8, 10694.
[6] H. Yusuf, W.-G. Kim, D. H. Lee, M. Aloshyna, A. G. Brolo, M. G. Moffitt, Langmuir 2007, 23, 5251.
[7] J. Ballarre, I. Manjubala, W. H. Schreiner, J. C. Orellano, P. Fratzl, S. Ceré, Acta Biomater. 2010, 6, 1601.
[8] Q. Chen, N. M. Pugno, J. Mech. Behav. Biomed. Mater. 2013, 19, 3. [9] F. Baino, S. Fiorilli, C. Vitale-Brovarone, Acta Biomater. 2016, 42, 18. [10] R. Ivanova, B. Lindman, P. Alexandridis, Langmuir 2000, 16, 9058. [11] M. Jalaal, G. Cottrell, N. Balmforth, B. Stoeber, J. Rheol. 2017,
61, 139.
[12] P. Holmqvist, P. Alexandridis, B. Lindman, J. Phys. Chem. B 1998,
102, 1149.
[13] A. M. Zaki, P. Carbone, Langmuir 2017, 33, 13284.
[14] S. Nawaz, M. Redhead, G. Mantovani, C. Alexander, C. Bosquillon, P. Carbone, Soft Matter 2012, 8, 6744.
[15] M. L. Adams, A. Lavasanifar, G. S. Kwon, J. Pharm. Sci. 2003, 92, 1343.
[16] A. V. Kabanov, E. V. Batrakova, V. Y. Alakhov, J. Controlled Release
2002, 82, 189.
[17] H. Sai, K. W. Tan, K. Hur, E. Asenath-Smith, R. Hovden, Y. Jiang, M. Riccio, D. A. Muller, V. Elser, L. A. Estroff, S. M. Gruner, U. Wiesner, Science 2013, 341, 530.
[18] S. Qavi, A. Bandegi, M. Firestone, R. Foudazi, Soft Matter 2019, 15, 8238.
[19] D. A. Chiappetta, A. Sosnik, Eur. J. Pharm. Biopharm. 2007, 66, 303. [20] Z. L. Tyrrell, Y. Shen, M. Radosz, Prog. Polym. Sci. 2010, 35, 1128.
[21] S.-Y. Qin, W.-Q. Ding, Z.-W. Jiang, X. Lei, A.-Q. Zhang, Chem.
Commun. 2019, 55, 1659.
[22] S.-Y. Qin, Y. Jiang, H. Sun, H. Liu, A.-Q. Zhang, X. Lei, Angew.
Chem., Int. Ed. 2020, 59, 17097.
[23] J. Stasiak, J. Brubert, M. Serrani, S. Nair, F. de Gaetano, M. L. Costantino, G. D. Moggridge, Soft Matter 2014, 10, 6077. [24] A. K. Rajasekharan, R. Bordes, C. Sandstrom, M. Ekh,
M. Andersson, Small 2017, 13, 1700550.
[25] A. Lotsari, A. K. Rajasekharan, M. Halvarsson, M. Andersson, Nat.
Commun. 2018, 9, 4170.
[26] L. Gentile, B. F. B. Silva, S. Balog, K. Mortensen, U. Olsson,
J. Colloid Interface Sci. 2012, 372, 32.
[27] V. Castelletto, P. Parras, I. W. Hamley, P. Bäverbäck, J. S. Pedersen, P. Panine, Langmuir 2007, 23, 6896.
[28] M. Buscema, H. Deyhle, T. Pfohl, A. Zumbuehl, B. Müller, Mater.
Today Bio 2019, 1, 100003.
[29] V. Lutz-Bueno, J. Zhao, R. Mezzenga, T. Pfohl, P. Fischer, M. Liebi,
Lab Chip 2016, 16, 4028.
[30] P. Holmqvist, P. Alexandridis, B. Lindman, Langmuir 1997, 13, 2471. [31] P. Holmqvist, P. Alexandridis, B. Lindman, Macromolecules 1997, 30,
6788.
[32] K. I. Winey, S. S. Patel, R. G. Larson, H. Watanabe, Macromolecules
1993, 26, 2542.
[33] H. H. Winter, F. Chambon, J. Rheol. 1986, 30, 367. [34] R. Kádár, M. Fazilati, T. Nypelö, Cellulose 2020, 27, 2003.
[35] K. Hyun, M. Wilhelm, C. O. Klein, K. S. Cho, J. G. Nam, K. H. Ahn, S. J. Lee, R. H. Ewoldt, G. H. McKinley, Prog. Polym. Sci. 2011, 36, 1697.
[36] K. Hyun, J. G. Nam, M. Wilhellm, K. H. Ahn, S. J. Lee, Rheol. Acta
2006, 45, 239.
[37] W. Richtering, in Optical Methods and Physics of Colloidal
Disper-sions (Eds: T. Palberg, M. Ballauff), Steinkopff, Darmstadt 1997, pp. 90–96.
[38] X. Li, E.-k. Park, K. Hyun, L. Oktavia, M. Kwak, J. Rheol. 2018, 62, 107.
[39] R. Pasquino, H. Droghetti, P. Carbone, S. Mirzaagha, N. Grizzuti, D. Marchisio, Soft Matter 2019, 15, 1396.
[40] B. Shriky, A. Kelly, M. Isreb, M. Babenko, N. Mahmoudi, S. Rogers, O. Shebanova, T. Snow, T. Gough, J. Colloid Interface Sci. 2020,
[41] A. A. C. Toledo Hijo, G. J. Maximo, M. C. Costa, R. L. Cunha, J. F. B. Pereira, K. A. Kurnia, E. A. C. Batista, A. J. A. Meirelles,
J. Phys. Chem. B 2017, 121, 3177.
[42] H. A. Barnes, J. F. Hutton, K. Walters, in An Introduction to Rheology (Ed: K. Walters), Elsevier, New York 1989, pp. v–vi.
[43] S.-H. Lim, T. Lee, Y. Oh, T. Narayanan, B. J. Sung, S.-M. Choi, Nat.
Commun. 2017, 8, 360.
[44] M. Trebbin, D. Steinhauser, J. Perlich, A. Buffet, S. V. Roth, W. Zimmermann, J. Thiele, S. Förster, Proc. Natl. Acad. Sci. USA
2013, 110, 6706.
[45] Y. J. Cha, M.-J. Gim, H. Ahn, T. J. Shin, J. Jeong, D. K. Yoon, ACS
Appl. Mater. Interfaces 2017, 9, 18355.
[46] H. Baza, T. Turiv, B.-X. Li, R. Li, B. M. Yavitt, M. Fukuto, O. D. Lavrentovich, Soft Matter 2020, 16, 8565.
[47] W.-J. Chung, J.-W. Oh, K. Kwak, B. Y. Lee, J. Meyer, E. Wang, A. Hexemer, S.-W. Lee, Nature 2011, 478, 364.
[48] K. V. Kaznatcheev, P. Dudin, O. D. Lavrentovich, A. P. Hitchcock,
Phys. Rev. 2007, 76, 061703.
[49] R. G. Larson, D. W. Mead, Liq. Cryst. 1993, 15, 151.
[50] S. Zhou, Y. A. Nastishin, M. M. Omelchenko, L. Tortora, V. G. Nazarenko, O. P. Boiko, T. Ostapenko, T. Hu, C. C. Almasan, S. N. Sprunt, J. T. Gleeson, O. D. Lavrentovich, Phys. Rev. Lett. 2012,
109, 037801.
[51] S. Čopar, Ž. Kos, T. Emeršič, U. Tkalec, Nat. Commun. 2020, 11, 59. [52] C. M. Balan, D. Broboana, C. Balan, Int. J. Heat Fluid Flow 2010, 31,
1125.
[53] O. Diat, D. Roux, F. Nallet, J. Phys. II France 1993, 3, 1427.
[54] K. Sapouna, Y. P. Xiong, R. A. Shenoi, Smart Mater. Struct. 2017, 26, 115010.
[55] A. K. Rajasekharan, M. Andersson, Cryst. Growth Des. 2015, 15, 2775.
[56] G. Du, A. Mao, J. Yu, J. Hou, N. Zhao, J. Han, Q. Zhao, W. Gao, T. Xie, H. Bai, Nat. Commun. 2019, 10, 800.
[57] P. Kraft, A. Bergamaschi, C. Broennimann, R. Dinapoli, E. F. Eikenberry, B. Henrich, I. Johnson, A. Mozzanica, C. M. Schleputz, P. R. Willmott, B. Schmitt, J. Synchrotron Radiat. 2009, 16, 368.
[58] Scanning SAXS Software Package, https://www.psi.ch/en/sls/ csaxs/software (accessed: April 2018).
[59] O. Bunk, M. Bech, T. H. Jensen, R. Feidenhans, T. Binderup, A. Menzel, F. Pfeiffer, New J. Phys. 2009, 11, 123016.
[60] M. van Gurp, Colloid Polym. Sci. 1995, 273, 607.
[61] J. Yu, F. Tian, S. Chen, X. Wang, Y. Zhang, H. Wang, J. Appl. Polym.
Sci. 2015, 132, 42343. [62] Y. Son, Polymer 2007, 48, 632.
[63] H. P. Martin, N. J. Brooks, J. M. Seddon, P. F. Luckham, N. J. Terrill, A. J. Kowalski, J. T. Cabral, Soft Matter 2016, 12, 1750.