A comprehensive assessment of the energy performance of the full
range of electricity generation technologies deployed in the United
Kingdom
Marco Raugei
a,n, Enrica Leccisi
a,baDepartment of Mechanical Engineering and Mathematical Sciences, Oxford Brookes University, UK
bEnvironment, Resources and Sustainable Development, Department of Science and Technology, Parthenope University of Naples, Italy
H I G H L I G H T S
We assess the energy performance of electricity generation technologies in the UK.
The NEA and LCA methodologies are reviewed and discussed.
Net energy gain and non-renewable cumulative energy demand are deemed key metrics.
Wind, and to a lesser extent PV, are found to be the most recommend-able technologies.
Natural gas combined cycles are also recognised as important for dispatchability.
G R A P H I C A L A B S T R A C T
a r t i c l e i n f o
Article history:Received 21 July 2015 Received in revised form 26 November 2015 Accepted 8 December 2015 Available online 18 December 2015
Keywords:
Net energy analysis EROI
EROEI
Life cycle assessment Cumulative energy demand Electricity
a b s t r a c t
We performed a comprehensive and internally consistent assessment of the energy performance of the full range of electricity production technologies in the United Kingdom, integrating the viewpoints of-fered by net energy analysis (NEA) and life cycle assessment (LCA). Specifically, the energy return on investment (EROI), net-to-gross energy output ratio (NTG) and non-renewable cumulative energy de-mand (nr-CED) indicators were calculated for coal, oil, gas, biomass, nuclear, hydro, wind and PV elec-tricity. Results point to wind, and to a lesser extent PV, as the most recommendable technologies overall in order to foster a transition towards an improved electricity grid mix in the UK, from both points of view of short-term effectiveness at providing a net energy gain to support the multiple societal energy consumption patterns, and long-term energy sustainability (the latter being inversely proportional to the reliance on non-renewable primary energy sources). The importance to maintain a sufficient installed capacity of readily-dispatchable gas-fired electricity is also recognised.
&2015 The Authors. Published by Elsevier Ltd. This is an open access article under the CC BY license (http://creativecommons.org/licenses/by/4.0/).
1. Introduction
1.1. The key role of electricity and the challenges ahead
Exponential population growth and the progressive in-dustrialisation of many developing countries have led to steadily increasing energy use, and projections indicate that global de-mand for primary energy is likely to grow by an additional 37% by
Contents lists available atScienceDirect
journal homepage:www.elsevier.com/locate/enpol
Energy Policy
http://dx.doi.org/10.1016/j.enpol.2015.12.011
0301-4215/&2015 The Authors. Published by Elsevier Ltd. This is an open access article under the CC BY license (http://creativecommons.org/licenses/by/4.0/).
nCorresponding author.
2040 (International Energy Agency (IEA), 2014a). Also, over the course of the last century, and increasingly so in recent decades, industrialised societies have become more and more reliant on
electricity as a versatile and‘clean’(at the point of use) energy
carrier (EC), and this trend is projected to accelerate even further in the foreseeable future (International Energy Agency (IEA), 2014a).
Worldwide, electricity is still largely driven (70% of total
generation) by thermal technologies feeding on non-renewable primary energy sources (PES)-namely coal, oil and natural gas-whose largest extant deposits are geographically localised, and whose combustion results in the emission of large quantities of greenhouse gases (GHGs). Critical dependence upon fossil fuels for electricity generation is therefore cause for concern in terms of both national energy security (for many non-producing countries) and global climate change. The remaining share of global
elec-tricity output is dominated by hydroelectric (15%) and nuclear
(10%)– both low-carbon technologies, but of which the latter
still relies on a non-renewable PES. All other low-carbon tech-nologies that harvest renewable primary energy, including bio-mass, wind, geothermal, solar and tidal, still collectively only
supply 5% of global electricity demand (International Energy
Agency (IEA), 2014b).
Given this state of matters, major technological and political challenges lie ahead if increasingly industrialised societies are to continue to meet the growing demand for electricity, while at the
same time reducing their dependency onfinite stocks of
non-re-newable PES, and attempting to contain global warming (e.g., at
least within a proposed þ2°C threshold (United Nations
Frame-work Convention on Climate Change (UNFCCC), 2009)-and even achieving this may in fact not be enough to prevent major
dis-ruptions to the world’s ecosystems (Lenton, 2011; Knopf et al.,
2012)).
Addressing these challenges will require a multi-pronged ap-proach that takes into account a whole gamut of constraints, ranging from economic affordability to technical feasibility and environmental sustainability. Notable issues to take into account
are the levelized cost of electricity (Ouyang and Lin, 2014;Boccard,
2014;Klein and Whalley, 2015;del Río and Cerdá, 2014;Maxim, 2014;Pickard, 2012), the feasibility of large-scale energy storage, blending of different generation technologies into a functional grid
mix, and demand-side management (Gross et al., 2006;
Nikola-kakis and Fthenakis, 2011;Denholm and Hand, 2011;Grünewald et al., 2012;Römer et al., 2012;Nyamdash and Denny, 2013; So-lomon et al., 2014;Brennan, 2010;Levine and Sonnenblick, 1994; Barton et al., 2013; Strbac, 2008; Garg et al., 2011; Bergaentzlé et al., 2014;Martínez Ceseña et al., 2015), and the impending cli-mate constraints and the technological measures devised to ad-dress them in the short, medium and long terms (Lilliestam et al., 2012;Martinsen et al., 2007;Lai et al., 2012;Scott, 2013;Levi and Pollitt, 2015).
Mindful of all this, we hereby present a balanced and internally
consistent assessment of the actual energy performance of the
range of currently available electricity production pathways in the
UK,intended as a key pre-requisiteto the consideration of all the
issues mentioned above, and aimed at providing preliminary policy recommendations on which technologies appear to be best suited to enable a transition to a more sustainable electricity mix
for the futureagain from anenergypoint of view.
1.2. Electricity production mix in the UK
The UK’s electricity generation mix in 2013-the most recent
year for which official data were available-was not dissimilar from
that of the world as a whole, in terms of the overall preponderance
of non-renewable PES (85% of total), albeit with a higher
penetration of nuclear (19% of total), as illustrated inTable 1.
Concerns over this state of matters has led the system operator for the national electricity transmission system in the UK to draft a number of stakeholder-informed scenarios for the future evolution of the grid mix over the next 20 years. The scenarios differ in their assumptions about the availability of economic resources and stability of political commitment to low-carbon options, and lead to a range of possible grid mixes in the year 2035, as illustrated in Table 2.
These scenarios will provide the backdrop to the discussion of
the policy implications of our own results inSection 5.
1.3. Net Energy Analysis (NEA)
One defining characteristic of an energy supply
chain-regard-less of whether it primarily feeds on a renewable or
non-renew-able PES, and irrespective of the final EC that it is designed to
deliver (e.g., thermal energy contained in a fuel, or electricity)-is
that it must provide the end user with a positive energy surplus
(also referred to as net energy gain or NEG). The latter may be
calculated starting with the amount of primary energy harvested from the PES, and subtracting all the energy dissipated to the environment along the supply chain (i.e., all processing,
transfor-mation and delivery steps required to turn the‘raw’primary
en-ergy into a usable EC at the point of use), as well as all the
addi-tional energy that has to be‘invested’in order to carry out the
same chain of processes. If this condition is not met, then a system may still of course play a useful societal role (e.g. by contributing
to matching supply and demand for a specific type of EC), but it no
Table 1
Electricity production technologies comprising the UK electric grid mix and relative shares of total electricity output in the year 2013 (Department of Energy & Climate Change (DECC), 2014a;National Grid, 2014a).
Technology Share of total grid output (%)
Coal 37.0
Oil 0.6
Gas 1.3
Gas combined cycle 26.7
Nuclear 19.1
Biomass 4.8
Hydro 1.4
Wind (on shore) 4.0 Wind (off-shore) 4.4
PV 0.7
Table 2
Electricity output by production technology in 2013 and projected changes in the year 2035, according to four alternative scenarios developed byNational Grid (2014a). Technology TWhel (2013) TWhel(2035) “No Progression” TWhel(2035) “Slow Progression” TWhel (2035) “Gone Green” TWhel (2035) “Low Carbon Life” Coal 124 3 3 4 4 Coal CCS 0 0 3 30 32 Oil 2 0 0 0 0 Gas 94 159 53 55 53 Gas CCS 0 0 7 30 49 Nuclear 64 31 50 68 93 Biomass 16 17 17 25 20 Hydro 5 7 10 17 16 Wind (off-shoreþ off-shore) 28 64 132 170 106 PV 3 7 10 17 16
longer behaves as an overall net supplier of energy, and becomes an energy consumer instead.
This is the basic premise of the discipline known as Net Energy Analysis (NEA), which leads to the ranking of alternative energy supply chains according to a range of related indicators, all of
which hinge on this very concept of NEG (Slesser, 1974; Leach,
1975; Chambers et al., 1979; Herendeen, 1988; Cleveland et al., 1984; Cleveland, 1992; Herendeen, 2004; Carbajales-Dale et al., 2014).
Futhermore, from the NEA perspective a merely positive NEG is
a necessary, but not sufficient, condition for an energy supply
chain to be considered recommendable. This is because the energy sector as a whole must in fact support not only itself (for which a
NEG just over zero would suffice), but in fact all other non-energy
producing sectors of society as well. In other words, this points to
the importance of maintaining asufficiently large NEG from the
energy supply sector as a whole, in order to ensure the continued support of the complex exosomatic metabolism of a modern
so-ciety (Hall et al., 2009;Lambert et al., 2014).
The adjective“exosomatic”refers to“energy converted outside
the human body, but still converted into applied power under human control, in order to facilitate the work associated with human activity, which gained special importance since the
in-dustrial revolution” (Velasco-Fernández et al., 2014). The key
concept underpinning the phrase“exosomatic metabolism”(Lotka,
1956; Georgescu-Roegen, 1975; Giampietro et al., 2009) is thus that, as a society develops and becomes further and further re-moved from a basic hunter-gatherer one, the share of its overall energy demand that is required for non-primary biological needs
(i.e., for its exo-somatic metabolism) becomes larger and larger
compared to the share thereof that is instead directly required for supporting the primary biological needs of its people (i.e., for its
endo-somatic metabolism).
The exact quantification of what may be considered a‘suffi
-cient’NEG is still the object of much speculation, and in fact
lar-gely depends on the specific demand for different kinds of ECs
dictated by the existing network of intertwined energy supply chains that characterize each individual country (International Energy Agency (IEA), 2014c). As a result, differentminimumNEGs
may be identified for each type of EC in each country.
We therefore argue that it is important to‘benchmark’, as we
do hereinafter, the net energy performance of all extant electricity production technologies in the country of interest against the current average performance of the mix of technologies (i.e., the grid mix) that at the same time provides that same country with electricity.
Adopting the cautionary principle, any future changes to the
mix of technologies that make up a country’s grid mix should at
least ensure that the grid’s current overall NEG be maintained; a
higher projected NEG would then guarantee a larger safety‘buffer’
against unforeseen changes in demand. Looking at the situation from the opposite end, if instead major large-scale changes were
made to a country’s grid mix which quickly resulted in an
in-sufficient overall NEG to satisfy the societal electricity
consump-tion patterns in the short term, then the ensuing scarcity of
dis-posable energy surplus would severely limit the country’s ultimate
ability to afford staying on the path of a long-term transition to a more sustainable electricity supply mix.
At the same time, though, NEA does not differentiate between renewable and non-renewable energy sources. Even when two systems are characterised by the same NEG, one may still lead to a faster deployment of non-renewable PES than the other, if its NEG is achieved mainly by depleting non-renewable primary energy
stocksvs. harvesting renewable primary energyflows. Thus, basing
long-term energy policy recommendations on the insight pro-vided by NEA alone risks overlooking the extent to which the
current societal energy (and, specifically, electricity) supply and
consumption patterns may actually beinherentlyunsustainable in
the long run (as all those relying heavily on non-renewable PES ultimately are).
1.4. Life Cycle Assessment (LCA)
Not unlike NEA, life cycle assessment (LCA) too is a discipline
that has its roots in a number of studies conducted in the 1960’s
and 70’s aimed at optimising energy consumption in a context
where the latter represented a restraint for the industry (e.g.Hunt
et al., 1974). Since then, LCA has been further developed and
standardised (Consoli et al., 1993;Lindfors et al., 1995;ISO, 2006a,
2006b;European Commission, 2010a,2010b), but its core aim has always remained to understand the overall environmental impacts of a product or system along its full life cycle (from the extraction of the necessary primary resources, to end-of-life disposal and,
where applicable, recycling). Accordingly, LCA’s energy demand
metrics look at thetotal primary energy that must be harvestedfrom
the environment in order to produce a given amount of usable
product or EC (Frischknecht et al., 1998,2007,2015a,2015b). LCA
also makes a clear distinction between renewable and
non-re-newable energy sources andflows, and keeps separate accounts of
the two at all times. (Besides energy, LCA also addresses a number of other environmental impact categories, such as global warming, ozone depletion, human and eco-toxicity, etc., but these will not be discussed further here as they fall outside of the intended scope of this paper).
LCA’s focus on the total primary energy harvested (also referred
to as cumulative energy demand or CED) provides a valuable
counterpoint to NEA’s emphasis on the utilitarian concept of
en-ergy surplus. In fact, it may be said that while NEA provides a
means to rank a range of alternative energy (and specifically,
electricity) production technologies in terms of theireffectiveness
at exploiting PES and upgrading stocks andflows of primary
en-ergy into a directly usable EC (thus providing the needed enen-ergy surplus to support a society's exosomatic metabolism), LCA allows the ranking of the same technologies according to their ultimate
degree ofenergy sustainability, the latter being inversely
propor-tional to their overall demand for (and therefore contribution to the depletion of) non-renewable primary energy.
1.5. Goal and scope of the present analysis
The overarching goal of the body of work presented in this paper was the comparison of the energy performance of the full range of currently employed electricity production technologies in the United Kingdom.
In order to ensure internal consistency, all the performance indicators were calculated on the basis of the same set of under-lying life cycle inventories (LCI) for the analysed technologies. The main data source was the reputable Ecoinvent database (Ecoinvent Centre for Life Cycle inventories (Ecoinvent), 2014), integrated wherever needed by other literature sources in order to adapt the information to the best possible extent to the actual conditions for the UK. No material or energy inputs were estimated indirectly by
means of economic input-output tables (Leontief, 1985; Bullard
et al., 1978) or otherwise converted from monetary units to
phy-sical units by means of‘energy-to-money’ratios.
End-of-life (EoL) management of the wind and PV power plants on decommissioning was not included in the analysis because of the heretofore dearth of reliable related information, due to the relatively recent large-scale introduction of these technologies to the energy market. However, the eventual inclusion of EoL man-agement within the respective system boundaries is not likely to negatively impact the overall energy performance of these
technologies, given the energy credits afforded by the relatively easy recycling of large quantities of valuable metals such as
cop-per, aluminium and steel, even when assuming the latter’s likely
down-cycling into the respective quality-adjusted average market mixes of primary and secondary sources (Bala Gala et al., 2015).
Finally, the decision was made not to include any form of en-ergy storage within the system boundaries for any of the analysed technologies. This is because many electricity production
tech-nologies (including renewables like PV and wind, as well as
baseload technologies such as large coal-fired1and nuclear
facil-ities) are in fact not able to single-handedly follow the dynamic pattern of societal electricity demand, and, if deployed on their
own, they would all requiresomestorage capacity in order to do
so. That being the case, it would only be meaningful to address the issue of energy storage when analysing and comparing alternative scenarios at the level of a country's grid mix, rather than at the
level of each individual technologyper se(Carbajales-Dale et al.,
2015), and while also taking into consideration the smoothing effect produced by combining PV with wind (Nikolakakis and Fthenakis, 2011), and the buffering capacity provided byflexible gas turbines.
2. Methodology
The choice was made to jointly apply NEA and LCA, so as to capture both viewpoints offered by these two disciplines, and enable a balanced discussion of the results in terms of short-term energy effectiveness and long-term energy sustainability.
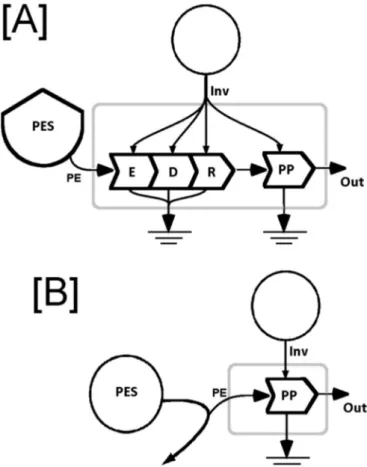
Fig. 1schematically illustrates the two main existing classes of electricity generation systems. Diagram [A] refers to a thermal system relying on a feedstock supply (of coal, oil, gas, biomass or nuclear fuel), and diagram [B] refers to a system directly
har-vesting a renewable primary energyflow (of hydro, wind, or solar
energy).
The following definitions apply:
PE¼primary energy directly harvested from the PES, which inthe case of system [A] also includes that co-extracted but then
‘lost’to the environment (Arvesen and Hertwich, 2015).
Inv¼total energy investment required to: (i) build, operate anddecommission the power plant (applies to systems [A] and [B]),
and (ii) extract, deliver and refine the feedstock (applies to
system [A] only).
Out¼total energy produced.At this point it is important to discuss the units in which these
three key energyflows are measured.
‘PE’is obviously measured in units of primary energy [MJPE],
and the most common practice in the literature is to express these on a Higher Heating Value (HHV) basis, i.e., including, when ap-plicable, the latent heat of the water vapour generated during combustion (Frischknecht et al., 2007). This convention was adopted here too.
‘Inv’is the total energydiverted from other possible societal uses,
and as such it is supplied to the system as a combination of readily-available energy carriers. However, just summing the dividual amounts of energy carriers that comprise the total
in-vestment in their respective units (i.e., [MJth] or [MJel]) would
correspond to only accounting for those energy investments that
would be characterized as‘foreground’2inputs in LCA. While
oc-casionally adopted by some authors (Weißbach et al., 2013), such reduced system boundaries would result in: (i) the inconsistent sum of a range of investments which are supplied as different and not directly comparable energy carriers such as liquid fuels and electricity (Raugei et al., 2015); and (b) the exclusion of a number
of potentially significant energy investments which take place in
the system’s‘background’. In order to avoid such inconsistencies
and maintain full life-cycle system boundaries, we adopted the widely accepted methodological convention (Arvesen and Hert-wich, 2015) to express all energy investments in terms of their
respective CED, measured in [MJPE].
‘Out’may either be accounted for in direct energy units of the
delivered energy carrier (‘Outel’measured in [MJel]), or in terms of
itsequivalentprimary energy (‘OutPE-eq’measured in [MJPE]). The
Fig. 1.Streamlined energy systems diagrams of [A] a thermal electricity production system (coal-, oil-, gas-, biomass- or nuclear-fuelled), and [B] a renewable elec-tricity production system (hydro, wind or PV). PES¼primary energy source; E¼feedstock extraction; D¼feedstock delivery; R¼feedstock refining; PP¼power plant. Symbolic conventions afterOdum, 1983.
1
While coal-fired power plants may in principle be adapted to function in a responsive (load-following) way, this often entails penalties in terms of additional cost and sometimes also reduced reliability, and as a result it is often only practical for the smaller stations. As of 2013 (Department of Energy & Climate Change (DECC), 2014a), 94% of coal power plants in the UK were large/baseload (41000 MW installed capacity) and only 6% were small/flexible (o1000 MW).
2
The LCA definition of‘foreground’refers to those processes“…that are under direct control of the producer of the good or operator of the service, or user of the good or where he has decisive influence…This coversfirstly all in-house processes of the producer or service operator of the analysed system. Secondly…also all processes and suppliers of purchased made-to-order goods and services, i.e., as far as the producer of service operator of the analysed system can influence them by choice or specification”.
By contrast, background data“…comprises those processes that are operated as part of the system, but that are not under direct control or decisive influence of the producer of the good (or operator of the service, or user of the good). The back-ground processes and systems are hence outside the direct influence or choice of the producer or service operator of the analysed system”[European Commission, 2010a, p. 97–98].
conversion from Outelto OutPE-eqis performed on the basis of a widely agreed-upon equivalency relationship, which follows a replacement logic akin to that used in LCA: one unit of electricity
produced by a specific technology is assumed to displace (and
hence be equivalent to) the same amount of electricity produced by the current grid mix (G) in the country of interest. Oper-ationally, we thus have:
η
= −
OutPE eq Out /el G
where
η
Gis the life-cycle energy efficiency of the grid mix, i.e., theratio of the grid’s yearly electricity output [MJel] to the total
pri-mary energy harvested from the environment for its operation,
allocated to the same year [MJPE-eq] (in other words,
η
G¼1/CEDG).Only when both Inv and OutPE-eqare expressed in terms of
(equivalent) primary energy, may the NEG be defined in strictly
consistent units as:
= − − v
NEG OutPE eq In
Based on the definitions above, the following NEA indicators
may be calculated:
EROIel¼Outel/Inv¼energy return on investment, in terms ofdirect electricity.
EROIPE-eq¼OutPE-eq/Inv¼ EROIel/η
G¼energy return on invest-ment, in terms of equivalent primary energy. NTG¼NEG/OutPE-eq¼net-to-gross energy output ratio, in termsof equivalent primary energy.
EROIel is an ‘absolute’ indicator of the performance of each
analysed technology; however, since“the numerator and the
denominator are not measured by the same rule, one loses the
intuitively appealing interpretation that EROI41 is the absolute
minimum requirement a resource must meet in order to
con-stitute a net energy source”(Arvesen and Hertwich, 2015).
EROIPE-eqis instead an intrinsically’relative’indicator, in that its numerical value depends not only on the actual energy perfor-mance of the system under study, but also on that of the electric grid that it is assumed to (partially) replace. Any observed
change in the EROIPE-eqof a given technology over time may
therefore depend not (or not only) on a change in electricity output per unit of energy investment, but also on a change in
the average life-cycle efficiency of the grid (
η
G)3.Based on the same set of definitions and conventions, the two
main energy demand indicators used in LCA may also be
defined as follows for electricity production systems:
CED¼(PEþInv)/Outel¼cumulative primary energy demand perunit of electricity output (Frischknecht et al., 1998;2007;2015a).
nr-CED¼ non-renewable cumulative primary energy demandper unit of electricity output (corresponding to the non-re-newable share of the CED).
Given the relevance of the demand for non-renewable energy for the long-term sustainability of an energy supply chain, we shall
focus hereinafter specifically on nr-CED.
3. Data
Sub-Sections 3.1–3.8 contain brief descriptions of the key
aspects of the analysed electricity production technologies. De-tailed calculation tables for all technologies are provided in the
Supplementary Information, available via the Internet at:http://
www.sciencedirect.com. 3.1. Coal electricity
Until the 1960s, the UK’s demand for coal was almost entirely
met by domestic production (Department of Energy & Climate Change (DECC), 2013a). The situation has since radically changed, and over the last forty years coal imports have played an ever larger role; in 2013 almost all the UK coal supply was imported, with 90% thereof coming from three countries: Russia, the USA and Colombia (Department of Energy & Climate Change (DECC), 2015a). In all three countries, and especially Russia and Colombia, a large share of the coal is extracted by surface mining (Energy Information Administration (EIA), 2013,2015a,2015b), which re-quires the removal of large amounts of overburden and entails
considerable environmental impact. Coal-fired electricity
produc-tion is a mature technology that is not expected to undergo major
changes in the coming decades, except for the possible retro-fi
t-ting of carbon capture and storage (CCS) equipment, which is however still only at the project proposal stage in the UK (Carbon Capture & Storage Association (CCSa), 2015).
3.2. Oil electricity
Approximately 20% of the UK’s demand for crude oil is met by
domestic off-shore production in the North Sea, with the rest coming mainly from Algeria, Nigeria and Norway (Department of Energy & Climate Change (DECC), 2014b). After being transported
to the UK mainland by oceanic tankers, the crude oil is refined
(mostly at 8 major refineries in England, Wales and Scotland
(O’Born, 2012)) into a number of co-products, of which the heavy fuel oil (HFO) used for electricity generation represents approxi-mately 10% by mass (Department of Energy & Climate Change (DECC), 2015a). The allocation of the overall energy investment
and CED for the refining operations to the refinery co-products
was done on the basis of their average energy content (Jungbluth, 2007). Oil-fired electricity production is also technologically ma-ture; its current share of the UK grid mix is however very small, and it is planned to be phased out almost completely in all future
scenarios drafted byNational Grid (2014a).
3.3. Gas and gas combined cycle electricity
As recently as in 2000, UK natural gas was almost entirely sourced from domestic off-shore deposits in the North Sea; from that year onwards, the level of imports has progressively increased as UK domestic supplies have declined (Whitmarsh et al., 2012; National Grid, 2014b). In 2013, less than half of the total UK supply of natural gas was domestic, while most of the rest was imported from Norwegian off-shore deposits and, in a smaller measure, from the Netherlands via the Balgzand Bacton Line (a recent pur-pose-built natural gas interconnector between the two countries,
mainly delivering gas from the on-land Groningenfield in the NL
(Whaley, 2009)). Transport of natural gas via pipeline entails in-evitable losses, which were accounted for in our analysis using
Ecoinvent’s estimates. Approximately 10% of the overall gas
im-ports to the UK in 2013 were also supplied in liquefied form (LNG),
mainly from Qatar (National Grid, 2014b); due to the unavailability of detailed inventory data for Qatari operations, this small per-centage was however disregarded in our analysis. Finally, the ex-ploitation of domestic nconventional gas deposits found in on-shore shales is planned but not yet operational (National Grid, 2014b); given the different nature of these deposits and of the 3
Incidentally, as discussed elsewhere (Raugei, 2013), the same consideration also applies to the Energy Pay-Back Time (EPBT) indicator (Fthenakis et al., 2011), which is often used when reporting on the energy performance of PVs and other renewable technologies.
technology required to exploit them, it is not possible to extra-polate information on the associated energy investment from the
existing datasets. Both conventional and combined cycle gas-fired
electricity production are mature technologies; the former is
however much more widespread, and it benefits from a higher
overall feedstock-to-electricity conversion efficiency thanks to the
secondary exploitation of the heat produced in the gas combustion process.
3.4. Biomass electricity
The term biomass encompasses a large variety of materials, including wood from various sources, agricultural residues, and animal and human waste. Three main types of biomass are used for electricity production in the UK: wood chips, wood pellets and straw (Department of Energy & Climate Change (DECC), 2014c). Both the wood chips and straw are sourced domestically, while the wood pellets are imported from North America (mainly the USA). Mass-based allocation was used for all multi-output processes in the supply chains of these feedstocks. All three biomass feedstocks are then directly combusted in thermal power plants, which are often former coal power plants converted to use biomass (De-partment of Energy & Climate Change (DECC), 2014c).
3.5. Nuclear electricity
UK national data for uranium imports are not directly available (UK parliament, 2010). The UK supply mix was therefore assumed to be the same as that for the EU as a whole, which in 2013 was mainly from Kazakhstan, Canada, Russia, Nigeria and Australia (European Commission, 2014). Canadian uranium mostly comes from underground mines (Canadian Nuclear Association, 2015), while open-pit mining and in-situ leaching (ISL) are also common elsewhere (World Nuclear Association, 2015a). No detailed process information was available for ISL, though, and as a result the
production of‘yellowcake’(the name given to the marketable U
ore concentrate) in all other countries beside Canada was mod-elled on the basis of 50% open-pit and 50% underground mining.
To produce fissile fuel, uranium oxide is converted to UF6 and
subject to an‘enrichment’process whereby the concentration of
the235U isotope is increased. Historically, U enrichment was
per-formed by diffusion, but this process has now been almost
com-pletely displaced by the more efficient centrifuge method (World
Nuclear Association, 2015b). Mixed oxide (MOX) nuclear fuel ob-tained by recycling and re-processing spent fuel is not currently used in the UK (European Commission, 2014). Of the sixteen nu-clear reactors in operation in the UK (UK government, 2015), fourteen are advanced gas-cooled reactors (AGR) built between the late 1970s and 1980s, one is a newer pressurised water reactor (PWR), and one an even older Magnox reactor (which was scheduled to be decommissioned by the end of 2014 (Berkemeier et al., 2014), but which was then given a one-year extension (BBC, 2014)). Of these three reactor types, detailed life-cycle inventory information was only available for the more common PWR, which was therefore used as the model of choice in our study. The AGR and Magnox reactors are peculiar British designs, which are si-milar to but somewhat more complex than PWRs, and their pro-duction may have entailed a larger energy investment. On the one
hand, our results may therefore be looked at as a‘best case’
esti-mate of the current performance of nuclear electricity in the UK. On the other hand, however, all but one of the AGR reactors are due for retirement within the next decade, and most future nu-clear power plants to be built in the UK are planned to be of the PWR type (Nuclear Advanced Manufacturing Research Centre (NAMRC), 2015); our results may thus still be considered quite relevant in terms of their energy policy implications.
The end-of-life treatment of the spent nuclear fuel and of the other highly and intermediate long-lived radioactive wastes was modelled according to the information available in Ecoinvent
(2007); in particular, the modelling of the final repositories is
based on a Swiss demonstration project (Nagra, 2002a,2002b),
which inevitably entails some degree of uncertainty.
From a methodological point of view, it is important to note
that the “standard”computation of the CED (and nr-CED) of
ur-anium does not include: (i) the energy content in the depleted
uranium (‘tail’) from the enrichment process, and (ii) the energy
content in the 235U remaining in the spent fuel at its final
dis-charge from the reactor (Frischknecht et al., 2007). Higher CED (and nr-CED) values for uranium which also include these
con-tributions are available, and have been referred to as “Uranium
high”(Frischknecht et al., 2015a). In this study, both alternatives
were considered, and the nr-CED results for nuclear electricity
corresponding to the use of the “Uranium high” approach have
been reported as part of the sensitivity analysis. 3.6. Hydro electricity
Three types of hydroelectric power plants are in use in the UK: large-scale conventional and pumped storage systems, where a dam impounds water in a reservoir that feeds the turbine, and
small-scale run-of-river units, where the naturalflow of a river or
stream is used to drive the turbine (Department of Energy & Cli-mate Change (DECC), 2013b). Pumped storage output is however not considered part of the electricity generation mix, since it relies
on electricity in thefirst place in order to pump the water up into
the reservoir at times of low demand.
Given that the only energy investment required for
hydro-electricity is that for the power plant, the EROIelends up being
directly proportional to its estimated lifetime. We therefore deemed it important to carry out a sensitivity analysis, whereby the lifetime of the hydroelectric power plants was allowed to vary
in aþ/‐25% range with respect to the chosen reference value of 80
years (Dones et al., 2007). Also, in order to account for the intrinsic variability of meteorological conditions and their effect on the
capacity factor (CF, defined as the ratio of the actual average power
output to the nominal installed power), we carried out a sensi-tivity analysis whereby the CF was allowed to vary between the
minimum and maximum values recorded over the 2009–2013
five-year period (Department of Energy & Climate Change (DECC),
2014a).
These same considerations in terms of lifetime and CF also apply to all other electricity production systems that harvest
re-newable energy directly (cf. Fig. 1 [B]), which were therefore
subject to a similar sensitivity analysis, resulting in corresponding
‘uncertainty bars’in all Figures inSection 4.
3.7. Wind electricity
Both on shore and off-shore wind turbines are deployed in the UK, with a 2.3:1 ratio of respective installed capacities in 2013 (Department of Energy & Climate Change (DECC), 2014a). For both types of systems, a reference 20 year lifetime was assumed as per Ecoinvent, with the only exception of a longer (40 year) lifetime
for thefixed parts of on shore installations (Dones et al., 2007). A
30 year lifetime was then considered as part of the sensitivity
analysis, as suggested by Garret and Rønde, 2013. The capacity
factor was also allowed to vary between the minimum and
max-imum values recorded over the 2009–2013five-year period
3.8. PV electricity
Approximately half of the cumulative installed PV capacity in the UK in 2013 was in the form of residential and commercial rooftop-mounted systems (European Photovoltaic Industry Asso-ciation (EPIA), 2014), partly in response to the feed-in tariff
scheme for small-scale (o5 MWp) installations of low-carbon
technologies (Department of Energy & Climate Change (DECC), 2015b). The vast majority of the installed PV systems use multi-and single- crystalline silicon (c-Si) modules (Fraunhofer, 2014);
the latter are more efficient but more energy-intensive to produce
as they require additional recrystallisation (Czochralski process). The feedstock for the production of the PV cells used to be sourced from scrap electronic-grade Si, but this has been almost
com-pletely displaced by the sector-specific supply of solar-grade Si
(Jungbluth et al., 2012), a large share of which is currently pro-duced in China (Bloomberg, 2014). A few ground-mounted CdTe
thin film PV installations are also starting to appear (Renews,
2014), and it was deemed interesting to include this relatively novel technology in the analysis as well. Given the rapid pace of change in the PV industry and the remarkable sustained
im-provements in terms of both module efficiency and energy
de-mand for production (Siemer and Knoll, 2013; International
En-ergy Agency (IEA), 2014d), we deemed it appropriate to base our analysis on the latest published data for current-generation
sys-tems in 2013 (de Wild-Scholten, 2013;Frischknecht et al., 2015b).
Specific data for ground-mounted balance of system (BOS)
com-ponents were sourced fromMason et al., 2006. A reference system
lifetime of 30 years was assumed (Fthenakis et al., 2011), with a sensitivity analysis extending the range from 25 years (the typical manufacturer-guaranteed lifetime) to a best-case projection of 40 years, which is still considered to be easily attainable by some manufacturers (SunPower, 2013). Irradiation levels were allowed to vary between the minimum and maximum for the UK (Eur-opean Commission, 2012), with a mean reference value of
1000 kWh/(m2*yr).
4. Results and discussion
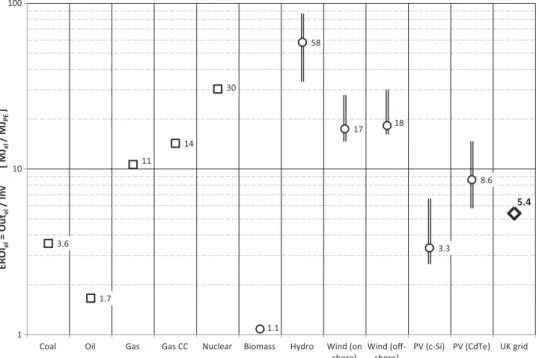
Fig. 2(note use of logarithmic vertical axis) illustrates the
re-sulting EROIelof all analysed technologies, alongside the value for
the UK electric grid as a whole. The latter was calculated as:
∑
ω= [ ( )]
EROL 1/ /EROL
i i i
el,G el,
where
ω
iis the share of total grid output supplied by technologyi,and EROIel,iis the EROIelof the same technology.
The range spanned by the EROIelresults is rather large, with the
lower end set by biomass-fired thermal electricity at a very low 1.1
(and with oil-fired electricity not far off at 1.7), and the higher end
by hydroelectricity (avg. estimate¼58). Right after hydro, a cluster
of well-performing technologies (EROIel410) may be identified,
comprising gas-fired, nuclear and wind electricity. Lagging slightly
behind then comes CdTe PV, which however still performs better
than the grid mix average, while c-Si PV joins coal-fired electricity
towards the lower end of the range.
The very low EROIelof biomass-fired electricity largely depends
on the mix of fuels used. For instance, as shown inTable S5in the
Supplementary Information, domestic wood chips have an initially
high EROI of over 50 [MJth/MJPE]. However, availability constraints
dictate that domestic wood chips only account for 40% of the
biomass used in power plants in the UK. At the other end of the scale, wood pellets imported from the USA start out with a very
low EROI of3 [MJth/MJPE] at the source. This large difference is
mostly due to the additional processing required to produce the pellets. The issue is then compounded by the additional energy investment needed to transport the pellets from the USA to the
UK. Finally, the EROIelof biomass-fired electricity is also negatively
affected by the relatively low efficiency with which the feedstock
is converted to electricity in the power plant (24%).
But perhaps the most remarkable and unexpected results are
the low values for oil- and coal-fired electricity, especially when
compared to the previously available estimates. This is due to two main reasons. Firstly, the EROI of the fossil fuels at their respective sites of extraction in the countries from which they are imported
3.6 1.7 11 14 30 1.1 58 17 18 3.3 8.6 5.4 1 10 100
Coal Oil Gas Gas CC Nuclear Biomass Hydro Wind (on
shore) Wind
(off-shore)
PV (c-Si) PV (CdTe) UK grid
ER OI el = Out el / In v [ MJ el / MJ PE ]
Fig. 2.EROIelof all non-renewable (square symbols) and renewable (round symbols) electricity generation technologies deployed in the UK, and overall value for the UK grid
as a whole (diamond symbol). Values for hydro, wind and PV technologies include sensitivity analysis to account for variability in capacity factors and uncertainty in expected lifetimes.
into the UK were found to be sometimes considerably lower than what might have been expected based on their generally accepted historical ranges. This was especially the case for African oil and
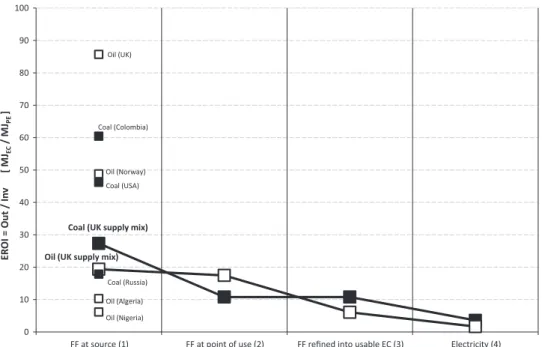
Russian coal. Secondly, as illustrated inFig. 3, it became apparent
that the energy investment for the long-distance transport re-quired to deliver the fuels to the UK mainland (especially for coal),
and those for their refining and processing (for oil4), take a
con-siderable toll on thefinal EROI of the usable feedstocks.
Previous estimates of the EROIelof thermal electricity that were
calculated starting from the average literature values for the EROI of the fossil fuels at source and only accounting for the power plant heat rate and the additional energy investment to build and operate it (including those made by one of the authors (Raugei et al., 2012)) were therefore probably too optimistic, especially in the case of countries that do not have locally exploitable reserves of those same fuels.
Fig. 3highlights the potentially misleading nature of a direct comparison of the EROI of different energy sources, unless the conditions of the analyses are very clearly and consistently
de-fined. Firstly, such wide-ranging comparisons should only be
performed for functionally equivalent ECs (e.g., either thermal fuels or electricity, but not both at the same time); and secondly, in the case of a comparison amongst fuels, the latter should be sampled at equivalent stages of their respective supply chains. Failing to do so and comparing, for instance, crude oil to PV electricity puts the latter at a double disadvantage, since (i) the crude oil needs to be transported and converted into an EC (such as HFO) before it can be used, and (ii) no fewer than approximately three units of HFO are then required to produce one unit of elec-tricity. While this fact has been recognised and discussed before
(Hall et al., 2014;Lambert, Lambert, 2013), unfortunately the
lit-erature is still populated by widely cited ‘balloon graphs' (Hall
et al., 2008;Murphy and Hall, 2010) and bar charts (Hall and Day, 2009) where results for poorly-defined systems such as“coal”or
“oil”are presented alongside those for other technologies whose
only possible output is electricity. Referring to the case of
coal-fired electricity in the UK as a practical example, our analysis has
shown that the average EROI¼27 [MJth/MJPE] of‘raw’coal at the
extraction sites in the supplying countries (cf.Fig. 3andTable S1in
the Supplementary Information) shrinks to EROIel¼3.5 [MJel/MJPE]
(i.e., almost one order of magnitude lower) by the time the fuel has
been delivered, refined and converted into electricity. Clearly, it is
the latterfigure, and not the former, which should be compared to
the EROIelof other competing electricity production technologies
in the same country.
It is then even more important to keep in mind that, from the point of view of NEA, what is ultimately important is the available
NEG, and the directly related NTG. As discussed inSection 2, NEG
and NTG may only be strictly defined when both the energy
in-vestment (Inv) and the delivered energy carrier (OutPE-eq) are
ex-pressed as (equivalent) primary energy. It is easy to verify that:
= ( − − ) −
NTG EROlPE eq 1 /EROlPE eq
This is a well-known non-linear relation which has been dis-cussed in the literature before, and the resulting sloping line has
been referred to as the‘net energy cliff’(Murphy and Hall, 2010).
However, previous mentions of it have often left it unclear whe-ther the NTG was calculated correctly (i.e., with all factors ac-counted for in consistent units of primary energy) or incorrectly (i.e., inconsistently mixing and matching units of different energy carriers and/or primary energy). As discussed above, comparing
the relative positions on the ‘cliff’of different energy sources at
different and non-equivalent stages of their respective supply
chains is ultimately meaningless. Also (cf.Section 1.3), the
gen-eralised concept of the“minimum EROI that a sustainable society
must have”(Hall et al., 2009) remains inescapably fuzzy unless it is
clearly contextualised, both in terms of the specific type of EC
under scrutiny (e.g., liquid fuels, electricity, etc.) and the specific
demand for it dictated by the exosomatic metabolism of the in-dividual society being considered.
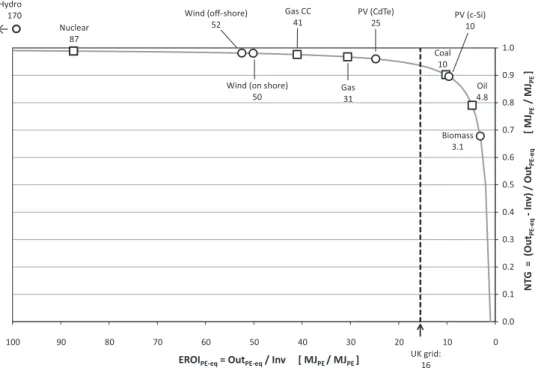
Fig. 4 illustrates the relative positions of all the electricity
generation technologies deployed in the UK on the ‘net energy
cliff’. A vertical line is also drawn to indicate the average
perfor-mance of the UK grid as a whole.
Thefirst clear consequence of the strong non-linearity of the
Coal (Russia) Coal (UK supply mix)
Oil (UK supply mix) Coal (Colombia) Coal (USA) Oil (Norway) Oil (UK) Oil (Algeria) Oil (Nigeria) 0 10 20 30 40 50 60 70 80 90 100
FF at source (1) FF at point of use (2) FF refined into usable EC (3) Electricity (4)
ER OI = Out / In v [ MJ EC / MJ PE ]
Fig. 3.EROI (direct output of energy carrier over investment of equivalent primary energy) of coal (black squares) and oil (white squares) along the successive stages of their supply chains to the UK, from extraction (1), on to delivery (2), refining (3), and conversion into electricity at the power plant (4).
4
Interestingly, our results for the energy investment required for the operation of the oil refinery are remarkably in line with those produced by a recent in-dependent study focussing on the efficiency of oil production in California (Brandt, 2011).
relation between NTG and EROIPE-eqis that differences between
individual EROIPE-eqvalues result in markedly different NTGs when
the absolute EROIPE-eqvalues are small, whereas such differences
become less and less consequential as the absolute EROIPE-eq
va-lues become larger. For instance, while the jump from EROI
PE-eq¼3.1 (biomass electricity) to EROIPE-eq¼10 (coal electricity)
re-sults in a marked improvement of the NTG (from 0.68 to 0.90), the
difference between EROIPE-eq¼52 (off-shore wind electricity) and
EROIPE-eq¼87 (nuclear electricity) only results in a comparatively
insignificant increase of the NTG (from 0.98 to 0.99).
The performance of the UK grid as a whole is characterised by
η
G¼0.35 and EROIPE-eq¼16, which corresponds to NTG¼0.94.Thislatter value may be regarded as the minimum‘necessary’NTG that
must be maintained in order to ensure the continued support of the current demand for net energy supplied to the UK society in the form
of electricity. The positions of the individual electricity generation
technologies on the curve relative to such‘threshold’may then be
understood to indicate which technologies have more (towards the upper left) or less (towards the lower right) potential for
supporting the UK society’s demand for net energy when
em-barking on a transition to a different grid mix.
As a necessary complement to the assessment of the net energy
performance of the analysed technologies,Fig. 5then presents the
results of the calculation of their respective nr-CED, indicative of their long-term energy sustainability (note use of logarithmic vertical axis).
As expected, all the technologies conventionally referred to as
‘non-renewable’ require more than one unit of non-renewable
primary energy per unit of delivered electricity. Also unsurpris-ingly, the nr-CED of the thermal technologies is largely determined
by the feedstock-to-electricity conversion efficiency of the power
plant (also referred to as heat rate), which is ultimately limited by the Carnot ratio and often lies in the vicinity of 1/3 (combined cycles fare marginally better due to the secondary exploitation of the post-combustion waste heat).
It is interesting to note that biomass-fired electricity, despite
being nominally a ‘renewable’ technology, still requires almost
0.9 units of non-renewable primary energy per unit of delivered electricity, due to the energy investments needed to harvest, process and deliver the feedstocks.
All other renewable electricity production technologies are then at least one order of magnitude less intensive in their de-mand for non-renewable primary energy, with hydroelectricity
once again in a leading position with just 0.016 MJPE-eq/MJel.
Finally,Fig. 6presents a novel, and arguably also the most
in-sightful, way to synthetically illustrate and compare the all-round energy performance of all analysed electricity generation tech-nologies. In it, the two key indicators discussed above, i.e., NTG (responding to the NEA logic) and nr-CED (responding to the LCA
logic), are used to define a two-dimensional virtual space. This
allows a clear visual depiction of any inherent trade-offs in terms
of the technologies’short-term energy effectiveness (as measured
by NTG)vs.long-term energy sustainability (as measured by
nr-CED), as well as an equally clear indication of the potential for
Pareto improvements5brought about by replacing one technology
with another.
The overall values of the two indicators for the UK grid as a whole are also plotted as two dashed lines representing thresholds
that define four quadrants. Since the horizontal nr-CED axis is
oriented from right to left (also note use of logarithmic scale), the two right quadrants contain those technologies whose demand for non-renewable primary energy per unit of delivered electricity is lower than that of the UK grid as a whole. Similarly, the two upper quadrants contain those technologies that provide a larger unit energy surplus (higher NTG) than average for the UK grid mix. As a result, only the technologies positioned in the upper right
quad-rant simultaneously fulfil both conditions, and may therefore be
regarded as delivering a ‘better’ all-round energy performance
with respect to the current UK grid mix. Coal 10 Oil 4.8 Gas 31 Gas CC 41 Nuclear 87 Biomass 3.1 Wind (on shore)
50 Wind (off-shore) 52 PV (c-Si) 10 PV (CdTe) 25 0.0 0.1 0.2 0.3 0.4 0.5 0.6 0.7 0.8 0.9 1.0 0 10 20 30 40 50 60 70 80 90 100 NT G = (Out PE-eq - In v) / Out PE-e q [ MJ PE / MJ PE ]
EROIPE-eq = OutPE-eq / Inv [ MJPE / MJPE ]
Hydro 170 ←
UK grid: 16
Fig. 4.‘Net energy cliff’illustrating non-linear relation of NTG to EROIPE-eq, with values for all non-renewable (square symbols) and renewable (round symbols) electricity
generation technologies deployed in the UK, and threshold set by overall EROIPE-eqof the UK grid as a whole (dashed line).
5A Pareto improvement is one in which a change to a system results in an
improvement in at least one of its parameters/criteria without at the same time making any of the other parameters/criteria worse.
Fig. 6makes it clear that, in the UK, coal- and oil-fired elec-tricity generation are the least desirable technologies overall, in
terms of both their inefficient use of non-renewable primary
re-sources and their comparatively low NTG ratios (the latter partly determined, as discussed before, by the necessity to import the
fuels from distant overseas suppliers). Oil-fired electricity is only a
very minor contributor to the UK grid mix already, but the share of
coal-fired electricity is instead the largest in the mix (cf.Table 1).
This gives pause for reflection, and appears to be a clear indication
that phasing out coal-fired electricity should be a top priority in all
future scenarios of grid improvement.
Another outlier in Fig. 6 is biomass-fired electricity, which,
despite a somewhat better performance in terms of renewability, is burdened by a high energy investment per unit of output, which results in a hopelessly low NTG ratio.
On the contrary, nuclear electricity performs very well in terms 3.1 4.4 2.9 2.2 3.3 0.86 0.016 0.053 0.050 0.30 0.12 2.5 0.01 0.1 1 10
Coal Oil Gas Gas CC Nuclear Biomass Hydro Wind (on
shore) Wind
(off-shore)
PV (c-Si) PV (CdTe) UK grid
nr-CED [ MJ PE / MJ el ]
Fig. 5.nr-CED of all non-renewable (square symbols) and renewable (round symbols) electricity generation technologies deployed in the UK, and overall value for the UK grid as a whole (diamond symbol). Values for nuclear, hydro, wind and PV technologies include sensitivity analysis to account for, respectively: alternative accounting methods for the CED of uranium (nuclear), and variability in capacity factors and uncertainty in expected lifetimes (hydro, wind and PV).
Coal Oil Gas Gas CC Nuclear Biomass Hydro Wind (on shore)
Wind (off-shore) PV (c-Si) PV (CdTe) 0.6 0.7 0.8 0.9 1.0 0.01 0.1 1 10 NT G = ( O ut PE-e q - In v) / Out PE-e q [ MJ PE / MJ PE ] nr-CED [ MJPE / MJel ] UK grid UK grid
Fig. 6.Positioning of all non-renewable (square symbols) and renewable (round symbols) electricity generation technologies deployed in the UK in the two-dimensional space defined by nr-CED (horizontal axis) and NTG (vertical axis). The overall values of the two indicators for the UK grid as a whole (dashed lines) define four quadrants, of which the right upper one contains those technologies whose combined performance w.r.t the two indicators is better than that of the grid itself. Values for nuclear, hydro, wind and PV technologies include sensitivity analysis to account for, respectively: alternative accounting methods for the CED of uranium (nuclear), and variability in capacity factors and uncertainty in expected lifetimes (hydro, wind and PV).
of net energy (featuring one of the highest NTGs), but it is no more
sustainable than oil- or coal-fired electricity due to its heavy
de-pendence on non-renewable primary energy. Incidentally, given that the largest part of the nr-CED is in the extracted uranium itself
(i.e., PE inFig. 1[A]), this is a rather general result which is largely
transferable to other countries too6.
Natural gas-fired electricity performs well in terms of NTG, and,
when of the modern combined cycle type, it is also marginally more sustainable (i.e., it has a lower nr-CED) than the average electricity produced by the current UK grid. It therefore appears to be the best candidate technology in order to maintain, and further expand if needed, an important reserve capacity for readily dis-patchable electricity (some of which will also be required as back-up in scenarios of large-scale deployment of renewable technol-ogies like wind and PVs).
Hydroelectricity provides far and away the best overall per-formance of all analysed technologies from both the NEA and LCA perspectives, as evidenced by its being positioned in the very top-right corner of the chart. However, the hydrography of the UK constitutes a major constraint, leaving comparatively little margin to scale this technology up beyond approximately 200% of its current installed capacity (British Hydropower Association (BHA), 2011).
PV technologies were found to hold potential for remarkable
performance, especially considering the country’s comparatively
low average irradiation. However, of the two analysed PV tech-nologies, CdTe is the only one whose NTG is higher than that of the UK grid as a whole (its nr-CED is also lower than that of mc-Si PV). It would therefore seem advisable to push for a more widespread deployment of this comparatively novel and under-utilised tech-nology in the future.
Last but not least, wind electricity, both on and off-shore, was found to hold the greatest all-round potential to contribute to a
‘better’UK grid in the future, from both points of view of a very
high NTG (higher than that of gas combined cycles, and almost as
high as that of nuclear) andof the second-lowest nr-CED of the
entire set of analysed technologies.
5. Conclusions and policy implications
The body of work presented herein represents, to the best of
our knowledge, thefirst complete and fully consistent assessment
of the actual all-round energy performance of the full range of
electricity generation technologies currently deployed in a specific
country, taking into account both their short-termeffectivenessat
providing a NEG for the benefit of the multiple societal energy
consumption patterns, and their potential long-termenergy
sus-tainability(the latter being inversely proportional to the reliance
on non-renewable primary energy sources).
Of course, while the NEA and LCA energy performance in-dicators discussed in this paper are important, they should not be the sole basis for policy decision-making. As already mentioned in the introduction, issues of economic affordability, technical in-tegration of different technologies into a single grid, energy sto-rage, demand-side management, and of course the overarching
need to significantly curb greenhouse gas emissions, all need to be
taken into account.
However, our analysis still has profound policy implications, in
that it identifies those technologies which, by virtue of their
in-trinsicenergy performance, hold the greatest potential to enable a
much-needed transition to a more sustainable national electricity mix that is less reliant on non-renewable PES, while at the same time warning against the false hopes represented by those
tech-nologies (like biomass-fired electricity) whose large-scale
de-ployment would likely result in a worrisome reduction of the
grid’s overall NTG.
In particular, our new results have shown that, when compared to other electricity generation technologies in a methodologically consistent manner, the net energy returns currently afforded by
conventional oil- and coal-fired electricity in the UK are much
lower than what might have been expected based on the general indications provided in the pre-existing literature, and in fact lower than that of the UK grid mix as a whole. This is a very
im-portantfinding that should not be lost in pursuit of other goals,
however important the latter may be.
Specifically, carbon capture and storage (CCS) is often seen as a
promising strategy to‘de-carbonize’coal-fired electricity and thus
make it more environmentally sound (World Coal Institute, 2005; International Energy Agency (IEA), 2013), and as such it features
prominently in the two most‘advanced’energy scenarios for the
UK drafted by National Grid (cf.Table 2). CCS was not explicitly
included in our analysis, since it has not been deployed anywhere yet in the UK; however, even discounting the issue of identifying
sufficient suitable storage capacity (Directive, 2009/31/EC;
Vie-bahn et al., 2012;Shogenova et al., 2014), it is clear that retrofitting CCS to existing power plants would inevitably entail an additional energy investment per unit of delivered electricity, as well as
re-duced available power output (“No magic fix for carbon”, 2014;
Sahu et al., 2014;An et al., 2015). As a result, while CCS may have a role to play in reducing GHG emissions from existing thermal power plants in the short- to medium-term, the associated in-crease in nr-CED and reduction in NTG would actually turn
coal-fired electricity into an even less desirable electricity supply option
than it is today, from the point of view of its actual energy
performance.
Also, given how close even modern gas combined cycles are to the nr-CED threshold set by the current average performance of
the UK grid mix, the benefits afforded by CCS in terms of reduced
carbon intensity of gas-fired electricity (cf.the proposed
deploy-ment of gas CCS inTable 2) should be weighed with the utmost
care against the additional demand for non-renewable energy investment.
On a more positive note, our results point to wind electricity (both on shore and off-shore) as the most recommendable option overall to enable a transition to an improved UK grid, from both points of view of a higher NTG ratio and a drastically reduced dependency on non-renewable PES. It is thus reassuring to note that all existing grid development scenarios (with the only
ex-ception of the rather pessimistic one aptly labelled“no
progres-sion” –cf.Table 2) do in fact rely on wind to provide the largest share of electricity supply by 2035. However, the rationale behind
reduced wind deployment in favour of nuclear in the“low carbon
life” scenario appears to be questionable. In fact, while both
technologies are reportedly broadly equivalent in terms of their
carbon intensities (Dolan and Heath, 2012; Warner and Heath,
2012), Fig. 6makes it apparent that wind is clearly the Pareto optimal technology amongst the two, given that its nr-CED is al-most two orders of magnitude lower than that of nuclear, whereas the respective NTGs are essentially the same.
Finally, one aspect in which renewables (such as wind and PV) and nuclear are clearly different is of course that of intermittency. However, as mentioned before, it is actually interesting to note that neither technology is in fact readily dispatchable (albeit for 6
One possible way to extend the‘renewability’of nuclear energy might be the use of ‘breeder’reactors capable of generating morefissile material than they consume by either using‘fast’(unmoderated) neutrons to breedfissile Pu (and possibly higher trans-uranic elements from 238
U), or using thermal spectrum (moderated) neutrons to breedfissile233U from Th. However, none of the extant
nuclear reactors in the UK, nor any of those planned for the foreseeable future, are of the breeder type.