4
In-situ real time measurements of
thermal comfort and comparison
with the adaptive comfort theory
in Dutch residential dwellings.
3
Abstract
Indoor thermal comfort is generally assessed using the PMV or the adaptive model. This research presents the results obtained by in-situ real time measurements of thermal comfort and thermal comfort perception in 17 residential dwellings in the Netherlands. The study demonstrates the new possibilities offered by relatively cheap, sensor-rich environments to collect data on clothing, heating, and activities related to thermal comfort, which can be used to improve and validate existing comfort models. The results are analyzed against the adaptive comfort model and its underlying assumptions. Data analysis showed that while indoor tempera-tures are within the adaptive model’s comfort bandwidth, occupants often reported comfort sensations other than neutral. Furthermore, when indoor temperatures were below the comfort bandwidth, tenants also often reported that they felt ‘neutral’. The adaptive model could overestimate as well as underestimate the occupant’s adaptive capacity towards thermal comfort. Despite the significant outdoors temperature variation, the indoor temperature of the dwellings and the clothing were observed to remain largely constant. Certain actions towards thermal comfort such as ‘turning the thermostat up’ were taking place while tenants were reporting thermal sensation ‘neutral’ or ‘a bit warm’. This indicates that either there is an indiscrimination among the various thermal sensation levels or alliesthesia plays a role and the neutral sensation is not comfortable, or many actions are happening out of habit and not in order to improve one’s thermal comfort. A chi2 analysis showed
that only six actions were correlated to thermal sensation in thermally poorly efficient dwellings, and six in thermally efficient dwellings.
Keywords
in-situ measurement, adaptive model, thermal comfort, clothing, metabolic activity, thermal sensation, occupancy behavior, energy consumption, residential dwellings, wireless monitoring
3 Published as: Ioannou, Anastasios, Laure Itard, and Tushar Agarwal. “In-situ real time measurements of thermal comfort and comparison with the adaptive comfort theory in Dutch residential dwellings.” Energy and Buildings
§ 4.1
Introduction
Reducing energy consumption in the residential sector is a major EU goal. Buildings should become more efficient but this cannot happen at the expense of thermal comfort. Indoor thermal comfort is generally assessed using the much-criticized PMV model, especially when it comes to naturally ventilated dwellings, which has led to the development of the adaptive comfort model. For both models, collection of data is a major issue. Measurements in a climate chamber do not account for the adaptation and psychological aspects of indoor comfort in homes, while in situ measurements are expensive, intrusive, and time consuming. However, recent developments in home automation and wireless sensor-rich environments, offer growing possibilities for cheaper and more extensive in-situ measurements, which could improve the existing comfort models. This paper reports the results of a study in which a wireless sensor network was placed in 17 houses to measure thermal sensations and comfort parameters. In Ioannou and Itard (2017)[1] the results were assessed against the PMV model, while the present paper focuses on the adaptive model. It is true that the adaptive model was originally developed for non-conditioned spaces and most of its experimental substantiation was realized with data from countries with a warm season. However, building simulation software often use conventional thermal comfort theories to make decisions. Therefore, Peeters et al. [26] extracted acceptable temperature ranges and comfort scales for residential dwellings based on a prior study by Van der Linden et al. [7] who developed adaptive temperature limits for the Dutch official purposes. Since the adaptive model for thermal comfort in residential dwellings is accepted as a standard in the Dutch residential sector, it is useful to be assessed with experimental data.
In section 2, a brief state of the art concerning the adaptive model is proposed, along with its limitations. Section 3 presents the research questions, the methods, and tools used for the collection and data analysis. Section 4 presents the results and Section 5 contains a discussion, the conclusions, and suggestions for future research.
§ 4.2
Brief State of the art of adaptive models
The adaptive model [2, 3] created to circumvent problems encountered in the PMV model, has gained increasing support among researchers in the field of indoor
used standards: the ASHRAE Standard 55[9] for North America and the European EN
15251[10]. The Netherlands is among the European countries that has incorporated
the adaptive model into their regulations [11, 12]. This model is able to assess the indoor thermal environment of naturally ventilated buildings in which the occupants have the freedom to open or close the windows, adjust their clothing and generally perform activities that improve their thermal comfort.
§ 4.2.1
Basic assumptions of the adaptive model
The basic assumption is that people take action to improve their thermal comfort by
utilising various adaptive opportunities[13]. The adaptive approach relies on field
studies where the thermal comfort of occupants was measured in situ[14] and relates
the indoor neutral operative temperature to a single variable, the mean monthly outdoor temperature, defined as the arithmetic mean of the daily maximum and minimum temperatures during the month considered. It does not actively deal with the effect of thermal comfort factors described by Fanger [15, 16] and used in the PMV model. According to Nicol and Humphreys, the reason for ignoring parameters such as clothing (clo value) is that they are related in various ways to the outdoor temperature [3]. However, other parameters used in the Fanger model (metabolic activity, mean radiant temperature, and air velocity) are not directly associated with outdoor temperatures[16]. According to the adaptive model, contextual factors and past thermal history modify occupants’ thermal expectations and preferences. Adaptation is defined as the gradual lessening of occupants’ response to repeated environmental stimulation and may be behavioural (clothing, windows), physiological (acclimatisation), or psychological
(expectations)[17]. Based on the expectation theory of the adaptive approach[18],
people will tend to expect and accept lower temperatures in the winter, or in cold climates, and higher temperatures in the summer, or in hot climates. Scientists supporting this model clearly state that occupants are free to adapt, primarily through clothing adjustment, to the variable indoor climate in naturally ventilated
buildings[19].
McIntyre has acknowledged the role of expectations in relation to thermal comfort, stating that an individual’s response to temperature depends on his expectations,
personality, and whatever he is doing at that time[20]. According to Fountain, changes
in expectations occur when a tenant is used to the cycles and variations of the indoor environment, which in turn may follow diurnal or seasonal outdoor climate patterns
or even longer term climatic changes. After long-term exposure to variations in environmental conditions, an individual’s expectations in relation to those conditions
may become more relaxed and even anticipatory of temporal changes[18].
§ 4.2.2
Limitations of the adaptive model
Evidence from field studies around the world has shown that thermal conditions in fully mechanically air-conditioned spaces (hotels, offices) often deviate from the comfort zone[16]. If the expectation hypothesis is true, then most people who complain about discomfort in their work environment should eventually stop doing so since this recurring discomfort should make them increasingly tolerant. Chronic discomfort should lower their expectations and help them accept the current reality. People might thus stop complaining, but there is no information if this really happens, or if they do so because they have come to terms with their discomfort, or because no one is offering a solution. Furthermore, naturally ventilated buildings offer their occupants a greater degree of thermal control compared to fully mechanically air-conditioned buildings. This enhanced control of thermal comfort leads to the relaxation of expectations and
greater tolerance of temperature excursions[17]. Intuitively, it would make sense that
when someone has greater control over his thermal environment he would exercise this control in order to achieve the best possible thermal comfort. Thus, it is possible that occupants of naturally ventilated dwellings do not develop more relaxed expectations and greater tolerance, related to thermal comfort, but make full use of the control opportunities. The fact that they have potential control and can always adjust the temperature to suit their personal needs could lead to exactly the opposite conclusion to Brager and de Dear. Rather than their expectations being lower, they expect they will be able to meet their comfort preferences by exercising more control over their thermal environment[16]. Residential tenants may have a specific thermal comfort level in mind, which is related to the quality of their dwelling, the comfort that it can provide, and various personal parameters that might affect thermal comfort. Therefore, it could be that the tenants of these dwellings are used to the performance of the dwelling with respect to the outdoor conditions and know how to gain the most from it.
Another limitation of the adaptive theory relates to the phenomenon of alliesthesia, which points out that feeling neutral does not necessarily means feeling comfortable,
people may feel comfortable while feeling cold or warm[22]. Last, and most important, it
should be noted that while the original model was made to explain seasonal and regional differences in temperature preferences, it has been used more and more as a basis for
therefore questionable if the adaptive model as it is used in national guidelines[9, 10] is able to accurately assess and predict comfort in existing dwellings.
§ 4.3
Methodology
This study, considering only 17 houses, makes no attempt to claim representativeness at the housing stock level or to conclude on the original adaptive model, in which seasonal average indoor temperatures were used. As mentioned in section 2, the adaptive model has been used often to assess the hourly values of indoor operative temperatures against the reference outdoor temperature in order to conclude on the indoor thermal comfort at individual dwelling level. This paper reports on the quality of this assessment in 17 dwellings.
This paper is a follow-up to that by Ioannou and Itard (2017)[1]. The main finding of
that analysis was that the PMV model is a good predictor of neutral temperatures for the various room types and in line with the temperatures derived from the recorded thermal sensations. However, the PMV model was found to underestimate the thermal comfort of tenants. Occupants felt comfortable while the PMV model predicted they should feel cool or a bit cool. Furthermore, no difference in clothing levels and metabolic rates between A/B and F-labelled dwellings were found, despite the latter having lower neutral temperatures.
The main objective of the present paper is to compare the results obtained with the adaptive comfort model and to further test the hypothesis underlying this model in order to get more insights into the advantages and drawbacks of the use of the adaptive comfort model for design and assessment of thermal comfort.
§ 4.3.1
Research questions
1 How successfully does the adaptive model predict occupants’ thermal sensations in the
17 residential dwellings that participated in the monitoring study?
2 To what extent do outdoor temperatures affect indoor temperature set points, clothing
3 What are the most common behavioural adaptations/actions taken by occupants to
achieve thermal comfort, and how do these relate to the tenants’ thermal sensations?
4 What is the impact of clothing level and metabolic activity on tenants’ thermal
sensations?
§ 4.3.2
Set up of the monitoring campaign
The measurements were part of the Ecommon (Energy and Comfort Monitoring) study of residential dwellings in the Netherlands. The Ecommon project was part of the
Monicair[23], SusLabNWE[24] and Installaties2020[25] projects and monitored 32
dwellings (classified by energy rating, types of heating and ventilation systems) for a six-month period from October 2014 to April 2015, which is the heating season for
north-western Europe. Quantitative data (air temperature, relative humidity, CO2 and
movement) for each room (living room, kitchen, bedroom 1 and bedroom 2 or study) were collected wirelessly at five-minute intervals. In addition, subjective data (thermal sensation, metabolic activity, clothing, actions during the previous half hour related to thermal comfort) were collected in 17 dwellings over a two-week period in March using two different methods, wirelessly and through entries in a manual log. The wireless device used to capture the thermal sensation of the tenants was time-coupled with the sensors for the quantitative data. This allowed the reported thermal sensation of the tenants, at any given time, to be coupled with the exact atmospheric conditions
(temperature, relative humidity, and CO2).
The occupants’ thermal sensation was recorded with the help of a wireless device called the ‘Comfort Dial’ (Figure 4.1) that allowed tenants to record their perceived thermal comfort at any time of the day on a seven-point scale, from -3 (cold) through 0 (neutral) to +3 (hot). Furthermore, tenants also made use of a hard copy log book (Figure 4.1). The data recorded in the log book concerned:
–
Thermal sensation on the above-mentioned seven-point scale.–
The room being occupied when filling in the logbook (kitchen, living room, bedroom, etc.).–
Clothing combination worn: a choice of six clothing ensembles from very light to very warm (Figure 4.1 and Table 4.1).–
Actions taken during the past half hour relating to comfort and energy consumption, such as opening and closing the windows, drinking a cold or hot drink, putting clothing on or taking it off, turning the thermostat up or down, and having a cold or hot shower.–
Activity level: lying/sleeping, relaxed sitting, doing light desk work, walking, jogging, and running (activities related to occupants’ metabolic rate). Both comfort dial andcomfort log book were developed by the TU Delft Industrial Design Department[23].
a b
FIGURE 4.1 Hard copy logbook for entry of subjective data (a)and Comfort Dial (b) used to capture perceived comfort levels of tenants during the Ecommon study
TABLE 4.1 Range of clothing and metabolic activities available for selection, in connection with entries in the Comfort Log Book during the Ecommon study and the values used to calculate their thermal effects
CLOTHING ENSEMBLE CLO VALUE METABOLIC ACTIVITY MET VALUE
Very light (Sleeveless T-shirt, icon in Fig. 3) 0.5 Lying/sleeping 0.7
Light (Normal T-shirt, icon in Fig. 3) 0.55 Sitting relaxed 1
Normal (Knit sport shirt, icon in Fig. 3) 0.57 Light desk work 1.1 Rather warm (Long-sleeved shirt, icon in Fig. 3) 0.61 Walking 2 Warm (Long-sleeved shirt plus jacket, icon in Fig. 3) 0.91 Jogging 3.8
Very warm (Outdoor clothing, icon Fig. 3) 1.30 Running 4.2
The quantitative data were used to calculate the comfort zone defined by the adaptive model. The subjective data were subsequently used to assess various aspects of the adaptive model and its hypothesis. For more details about the quantitative data
collection see section 3.1 and Ioannou and Itard (2017)[1].
The dwellings that participated in the measurement study were part of the Dutch social housing stock. The sample was divided into energy A/B-labelled (thermally efficient dwellings) and F-labelled dwellings (poor thermal efficiency). The final sample of the dwellings in which thermal sensations were collected is described in Table 4.2.
TABLE 4.2 Dwellings participating in the Ecommon study
NO. ENERGY
RATING
HEATING SYSTEM
VENTILATION SYSTEM NO. OF ROOMS NO. OF OCCUPANTS AVERAGE AGE OF HOUSEHOLD (sample average: 59 years) W004 A Heat pump Balanced Vent. 4 2 67 W005 A Condensing gas boiler Balanced Vent. 4 1 92 W006 A Condensing gas boiler Balanced Vent. 3 2 77 W010 A Condensing gas boiler Natural Supply, Mech. Exhaust 7 2 29 W012 F Condensing gas boiler Natural Vent. 5 4 40.5 W013 F Condensing gas boiler Natural Vent. 5 3 53 W016 B Condensing gas boiler Natural Supply, Mech. Exhaust 4 2 70 W020 F Condensing gas boiler Natural Vent. 6 2 74 W021 F Condensing gas boiler Natural Supply, Mech. Exhaust 4 2 73 W022 F Condensing gas boiler Natural Supply, Mech. Exhaust 3 2 64 W023 F Condensing gas boiler Natural Vent. 4 2 66 W024 F Condensing gas boiler Natural Supply, Mech. Exhaust 5 1 72 W025 F Gas stove Natural Vent. 5 3 43 W026 F Condensing gas boiler Natural Vent. 4 4 21 W028 F Condensing gas boiler Natural Supply, Mech. Exhaust 6 2 72 W031 F Condensing gas boiler Natural Supply, Mech. Exhaust 6 3 43 W032 B Condensing gas boiler Natural Supply, Mech. Exhaust 4 3 39 The dwellings with heat pump are equipped with a subfloor low temperature hydronic system. The system uses no gas and the total costs are translated in electricity use for the pumps that are constantly circulating the hot water in the hydronic system. The dwellings equipped with condensing boilers are having hot water radiators in each
room while the dwellings with gas stoves are heated only locally I the spaces where the gas stove is installed. Both these two systems use gas.
§ 4.3.3
Calculation of the neutral, upper and lower
temperature limits for the adaptive model
The adaptive temperature limits were calculated using the Dutch official guidelines in
which Te,ref is calculated according to Van der Linden et al. [11].
𝑇𝑇!,!"# = (𝑇𝑇!"#$%+ 0.8𝑇𝑇!"#$%!!+ 0.4𝑇𝑇2.4 !"#$%!!+ 0.2𝑇𝑇!"#$%!!) (1)
where Te,ref is the reference external temperature (oC), T
today is the average of the day’s
maximum and minimum outside temperatures (oC) and T
today-1, Ttoday-2, and Ttoday-3 are
the average of maximum and minimum outside temperatures (oC) for yesterday, two
and three days before, respectively [26].
For the calculation of the neutral temperatures in each room of each dwelling, the
equations by Peeters et al.[26], set up for different types of rooms in Belgium, very
close to the Netherlands, were used:
𝑇𝑇!= 20.4 + 0.06 ∗ 𝑇𝑇!,!"# for Te,ref < 12.5 oC (2)
𝑇𝑇!= 16.63 + 0.36 ∗ 𝑇𝑇!,!"# for Te,ref ≥ 12.5 oC (3)
The upper and lower temperature limits in the most commonly used standards are symmetrical around the neutral temperature [9,10,11]:
𝑇𝑇!± 𝛼𝛼 Where 𝛼𝛼 is a constant (oC) (4)
temperature is thus considered to have a constant width [26]. To account for both the enhanced sensitivity to cold versus heat and the non-seasonal dependence, we used
the equations recommended by Peeters et al. (2009) [26]for the upper and lower
temperature limits:
𝑇𝑇!""#$= 𝑇𝑇!+ 𝑤𝑤𝑤𝑤 (5)
𝑇𝑇!"#$%= max (𝑇𝑇!− 𝑤𝑤 1 − 𝑎𝑎 , 18) (6)
with Tupper (oC) the upper limit, T
lower (oC) the lower limit of the comfort band and w
the width of the comfort band (oC). The value of w for 90% acceptability was 5 oC and
for 80% acceptability 7 oC. Furthermore, the width of the comfort band was not split
symmetrically around the neutral temperature, rather a 70-30% split was used as
recommended by Peeters and al., which resulted in an α equal to 0.7 [11,26,27].
§ 4.3.4
Estimation of mean radiant temperature (T
mrt)
and indoor operative temperature
Unfortunately, it was not possible to measure directly the radiant temperature or the operative temperature during the measurement campaign. These temperatures were therefore estimated using simulations, following the procedure described by Ioannou and Itard (2017) [1]. For the sake of clarity, this procedure is summarized below. Dynamic simulations, performed with Energy+, showed that the difference between air and radiant temperature during March in a typical F-labelled dwelling with a
condensing boiler and radiators was about 4 oC. For a typical A/B-labelled dwelling
with heat pump and floor heating, the radiant temperature was 1.2 oC higher than air
temperature due to the radiant heating effect of the hydronic floor heating system. The
instantaneous values for the mean radiant temperature (Tmrt) of F and A/B- labelled
dwellings were thus calculated as Tair -4 oC and T
air +1.2 oC, respectively. For the
A/B-labelled dwellings with condensing boilers and radiators instead of heat pumps, the air
temperature was slightly higher (0.3 oC) than the radiant temperature and appreciably
less than the respective standard deviations. Therefore, it was assumed that the radiant temperatures for A/B-labelled dwellings with condensing boilers could be set as
equivalent to the air temperatures recorded by the sensors. The operative temperature
Top, is defined as,
Top = γ Tmrt + (1- γ) Tair (7)
Where, γ = is the radiative fraction, TMRT = is the mean radiant temperature for the
thermal zone, and Tdrybulb = is the mean zone air temperature.
For air velocities below 0.2 m/s, which is a reasonable number for indoor residential
dwellings, a typical value of γ is 0.5. For a more detailed description of the methodology
and a sensitivity study concerning the qualities of these assumptions, refer to Ioannou
and Itard (2017) [31]and Niu and Burnett (1998) [28].
§ 4.4
Results
§ 4.4.1
Evaluation of the prediction success of the adaptive
model in the sample of residential dwellings
The two weeks of measurements in March were quite cold, with an average
temperature of 6.2 oC, average minimum of 1.9 oC, and average maximum 9.6 oC. These
temperatures are representative for the average heating period in the Netherlands.
§ 4.4.1.1
Reported thermal sensations and the adaptive model
Table 4.3 presents an overview of the total number of thermal sensation scores recorded per dwelling, their percentage breakdown into scores on the colder, neutral and warm sides of the ISO 7730 [29] seven-point scale, as well as whether they were recorded before or after midday. The majority of the thermal sensation scores were recorded after 12.00 noon. In total, 465 thermal sensation points were recorded
during the two weeks and they were time-coupled to indoor comfort parameters and outdoor temperatures. However, these thermal sensations were not equally distributed between A/B and F-labelled dwellings. In the F-labelled dwellings, 322 thermal sensations were recorded by 11 respondents, while in the A/B-labelled dwellings only 143 thermal sensations were reported by 5 respondents. It should also be noted that in the A/B-labelled dwellings, 75% of the scores were given by the respondent of W032. In the F-labelled dwellings, the respondent of W031 is also over-represented, with 40% of the scores. Both of these dwellings were occupied by a middle-aged couple with one child.
TABLE 4.3 Overview of thermal sensation scores recorded for each dwelling
% TS TS < 0 TS = 0 TS > 0 No. of RTS TS < 0 TS = 0 TS > 0 % before 12.00 noon % after 12.00 noon % before 12.00 noon % after 12.00 noon % before 12.00 noon % after 12.00 noon A/B-labelled dwellings W032--B 107 6.5 34.6 59.9 42.9 57.1 32.4 67.6 38.1 61.9 W016--B 9 44.4 55.6 0 25 75 60 40 0 0 W010--A 9 33.3 0 66.6 66.7 33.3 0 0 33.3 66.7 W006--A 13 7.7 84.6 7.7 100 0 36.36 63.63 100 0 W005--A 3 0 33.3 66.7 0 0 0 100 50 50 W004--A 15 20 66.7 13.3 33.3 66.7 60 40 50 50 F-labelled dwellings W031--F 128 24.2 42.2 33.6 58.1 41.9 31.5 68.5 32.6 67.4 W028--F 59 23.7 62.7 13.6 57.1 42.9 48.6 51.4 12.5 87.5 W026--F 6 83.3 0 16.7 40 60 0 0 0 100 W025--F 5 40 60 0 50 50 66.7 33.3 0 0 W024--F 6 50 33.3 16.7 0 100 50 50 100 0 W023--F 5 20 80 0 100 0 0 100 0 0 W022--F 19 10.5 89.5 0 50 50 29.4 70.6 0 0 W021--F 10 30 70 0 100 0 57.1 42.9 0 0 W020--F 29 20.7 75.9 3.4 16.7 83.3 59.1 40.9 0 100 W013--F 46 37 39.1 23.9 58.8 41.2 50 50 9.1 90.9 W012--F 39 17.9 33.3 48.7 85.7 14.3 15.4 84.6 21.1 78.9 The adaptive model limits were plotted based on the formulas presented in Subsection 3.3, and outdoor temperature data were obtained from the Royal Dutch Meteorological Institute at a location close to the measured dwellings. The graphs display the 90% acceptability neutral bandwidth and the results presented are for the living room, as
151 In-situ real time measurements of thermal comfort and comparison with the adaptive comfort theory in Dutch residential dwellings. most measurement points were obtained for this room. The graphs are presented for
each label category by ascending order for thermal sensation, from ‘cold’ to ‘warm’ (when data were available). The tenants did not record any ‘hot’ thermal sensation scores during the measurement period. For the A/B-labelled dwellings, there were very few data points for the comfort levels ‘cold’ and ‘cool’ and, therefore, only the graphs from ‘a bit cool’ to ‘warm’ are presented.
§ 4.4.1.2
A/B-labelled dwellings
Figure 4.2 displays the neutral temperature bandwidth of the adaptive model, the indoor operative temperatures for the living rooms and the reported thermal sensations. For people who reported feeling ‘a bit cool’, 69% of the data points are in the neutral bandwidth, which means that according to the adaptive model the tenants should have taken appropriate measures to feel neutral (such as wearing a sweater). Despite this adaptive hypothesis, the tenants still reported that they felt ‘a bit cool’. Furthermore, the indoor temperatures for dwellings W004 and W016 (A/B-labelled) were adjacent to the upper limit (the warmer side) of the adaptive model.
FIGURE 4.2 Adaptive thermal comfort model and indoor operative temperatures for the thermal sensations recorded in A/B-labelled living rooms
For ‘neutral’ thermal sensation, 73% of the data points are within the adaptive model’s bandwidth, while the points that are not in the comfort band are below it. As we move further towards the warmer side of thermal sensation (‘a bit warm’ and ‘warm’), we see the same trend, with some of the data points lying between the neutral temperature line and the lower limit of the comfort bandwidth, but the majority lying below the comfort band. It is noticeable that each dwelling remains in the same area of the graphic: for instance, WO32 is always at the lower side, while WO4 is always at the upper side.
Dwelling W004, at any level of recorded thermal sensation, had an indoor temperature in the upper limit of the adaptive model. W004 is a new dwelling with floor heating coupled to a heat pump and its tenants were elderly. The indoor temperatures of
this dwelling constantly hovered around 24 oC to 25 oC for the whole day due to the
continuous operation of the low hydronic system, and logically the adaptive model assumes that these people do or should feel neutral.
The comfort scores for dwelling W032 (a B-labelled dwelling with a natural gas boiler heating localized radiators, occupied by middle-aged tenants) show the opposite pattern to that of W004. For all levels of recorder thermal sensation, the corresponding temperatures are outside the comfort zone of the adaptive model (the occupants should feel too cold), while the temperatures that are within are all concentrated at the lower end of the comfort zone. The total number of reported thermal sensations recorded in this case was 107 and 95% were either neutral (35%) or at the warmer end of the seven-point comfort scale (60%), Table 4.3. The majority of both neutral and warmer scores were recorded after midday. Operative temperatures in this dwelling
ranged between 16 oC and 21 oC.
The same trends would have been observed if an 80% acceptance level (approximately
1 oC wider at the lower and upper limits) was chosen as the comfort bandwidth, rather
than the 90% we used here. While a few more data points would be in the ‘neutral’ zone, the graphs would not look much different.
§ 4.4.1.3
F-labelled dwellings
Similar tendencies to the A/B-labelled dwellings are observed for the F-labelled dwellings, Figure 4.3. Starting from the comfort perception of ‘cool’, 66% of the data points are below the comfort bandwidth, while the rest are within it. The more we move towards warmer thermal sensations, the more data points appear in the neutral bandwidth, with most of them in the graph for ‘neutral’ comfort sensation. The data
153 In-situ real time measurements of thermal comfort and comparison with the adaptive comfort theory in Dutch residential dwellings. points that are not in the comfort bandwidth are below the lower 90% neutrality limit,
similarly to the A-labelled dwellings.
We see the same effect in dwellings W013 (46 scores) and W031 (128 scores) as in dwelling W032 (see A/B-labelled dwellings subsection). These dwellings had more evenly distributed reported thermal sensations between neutrality and the colder and warmer sides of the seven-point scale. The majority of the thermal sensations reported at the cold side were given before midday, while the majority of the neutral or warmer reported thermal sensations were given after midday.
FIGURE 4.3 Adaptive thermal comfort model and indoor operative temperatures for the thermal sensations recorded in F-labelled living rooms
As mentioned above, the most important underlying assumption of the adaptive model is that people will take action to improve their thermal comfort by utilizing various adaptive opportunities. In Figures 4.2 and 4.3 we see elements that contradict this adaptive hypothesis. In all of the non-neutral thermal sensation graphs, there are many indoor temperature data points that are inside the adaptive model’s comfort bandwidth. According to the model, these individuals have already taken the necessary action and should feel neutral. However, the participants felt ‘cool’, ‘a bit cool’, ‘a bit warm’ or ‘warm’. Not feeling neutral might lead the tenants to further actions aimed to improve their thermal sensation, which could lead to additional energy consumption. It could also be that they feel more comfortable at these thermal sensations, than at
a neutral thermal sensation, as already pointed out by de Dear [22]. When the people were asked in the initial survey how they feel in general about the indoor temperature during the winter, they characterized it as ‘good temperature’. This means that the occupants of W032 feel comfortable at temperatures that are deemed as non-neutral. Both Figures 4.2 and 4.3 show that people still differentiate in their thermal sensation regardless of the indoor and the outdoor average temperature. This differentiation of their comfort seems to be due to other parameters than temperature such as metabolic activity, clothing, air speed, and physical or psychological tiredness. It may be that people control the temperature in such a way that they feel most comfortable (leading for instance to high temperatures in W004 and to lower temperatures in W032), but it may also be that people just get used to the temperature in their house (for instance the people in W004 had little control on the temperature). However, the small number of total scores recorded (15) does not allow for concrete conclusions on this matter. Further research and larger field experiments are required.
For all reported thermal sensations, cold or warm, the data points that are not in the neutral bandwidth are on the lower side of the graphs. This indicates that the adaptive model appears to predict better the colder side of thermal sensations but strongly underestimate the thermal sensation on the warmer side (tenants feel warm while the theory predicts they should feel cool).
§ 4.4.1.4
Conclusions about predicted and reported thermal sensations
Thus, the adaptive model seems to both overestimate and underestimate the adaptive capacity of tenants in relation to their thermal comfort. On the one hand, many of the reported thermal sensations that were neutral were not in accordance with the adaptive model. On the other hand, many of the reported thermal sensations that were non-neutral also contradicted the adaptive model, which predicted they should be neutral. The subjects of the Ecommon study had all the options at their disposal to improve their thermal comfort (clothing, actions such as having a hot or cold drink, control over thermostats and windows) and probably used many (if not all) of these options. It may be that the non-neutral sensations reported are experienced as completely acceptable by the occupants, belonging to a normal range of differing sensations. Therefore, these non-neutral sensations would not require any further adaptations, as they were considered comfortable. It is equally possible that the neutral sensations reported could have been experienced as uncomfortable, necessitating some adaptation. Such phenomena have already been mentioned by De Dear [22], and in our previous paper [1], we considered the possibility of indiscrimination between the
thermal sensations of ‘a bit cool’, ‘neutral’ and ‘a bit warm’, which can also be seen in the ASHRAE RP884 database [30].
Another important finding is that if the adaptive comfort model had been used to assess whether the dwellings were comfortable, it would have led to conclusions not shared by the occupants. In response to the question, ‘How do you feel about the indoor temperature of your apartment during the winter?’ during the initial survey, almost all of the occupants of the 17 dwellings, with the exception of dwellings W012 and W013, thought it was a ‘good temperature’. As mentioned in the introduction, one point of criticism of the adaptive model is that all of the parameters used by Fanger were condensed into indoor and outdoor temperatures. In the data for the above-mentioned dwellings, we see many discrepancies between actual and predicted data, leading to the suggestion that temperature alone might not be sufficient to predict accurately the comfort levels of tenants. Furthermore, this could be an indication of an inaccurate estimation of the tenants’ adaptive capacity with respect to thermal comfort, or an overestimation of the thermal sensations occupants discriminate between, or it may relate to the fact that ‘neutral’ does not mean ‘comfortable’. It might also be that the thermal sensations of ‘a bit cool’ and ‘a bit warm’, in the eyes of the occupants, are simple observations that do not suggest any wish for improvement.
§ 4.4.2
Adaptive model and indoor temperature
It was already apparent in Figures 4.2 and 4.3 that the indoor temperatures of specific dwellings were quite constant across the different thermal sensation levels reported. Figures 4.4 and 4.5 show the hourly outdoor temperature plotted against the hourly indoor temperature of a few of the A/B and F-labelled dwellings for the two weeks of measurement in March. The results for the other dwellings are similar. For an outdoor
temperature range between -3 oC and 16 oC, the linear trend lines for the indoor
temperatures of A/B dwellings showed a slight inclination while the ones from the F-labelled group show a bigger trend line slope. In line with the findings of Peeters
[26], the slope at temperatures below 12,5 oC is very low, generally between 0.06 and
0.17. Additionally, and most important, Figures 4.4 and 4.5 show that the explanatory
power of outdoor temperature on indoor temperature is very low: the R2 values are
low, meaning that the outdoor temperature is only for a marginal part responsible for the variance in indoor temperature. This in turn means that the indoor temperatures chosen by the occupants only marginally relate to the outdoor temperature.
156 Thermal comfort and energy related occupancy behavior in Dutch residential dwellings
FIGURE 4.4 Indoor vs outdoor temperature for the A/B-labelled dwellings and corresponding regression line
FIGURE 4.5 Indoor vs outdoor temperature for the F-labelled dwellings and corresponding regression line
§ 4.4.3
Adaptive model and behavioral adaptations
As explained in Subsection 3.2, in addition to using the Comfort Dial, the tenants were also asked to note in a logbook the actions they had taken in the past half hour when registering their thermal sensation. Figure 4.6 presents an overview of the actions that could possibly influence thermal comfort, including clothing levels and the metabolic activity of the tenants. The legend of Figure 4.6 presents the total number of recorded data points per thermal sensation. It appears that tenants turned their thermostat up more often while feeling ‘a bit cool’ than when they were feeling ‘cool’ (which might be evidence of the difficulty in discriminating between ‘a bit cool’ and ‘cool’ thermal sensations). Furthermore, they turned their thermostat up when feeling ‘neutral’ and even when feeling ‘a bit warm’, which offers additional evidence of the habitual use of the thermostat. Having a hot drink was another popular action, with tenants doing so while reporting all of the four thermal sensations mentioned above, and the number of times they did this was higher for ‘a bit cool’ and ‘neutral’ than for ‘cool’.
This could be an indication that tenants undertake specific actions, wear specific clothing or maintain specific metabolic activities due to habits developed over the long term, regardless of their reported thermal sensation; for example, having a coffee in the morning to wake up or after lunch to avoid afternoon sleepiness. The results presented in Figure 4.6 come from our relatively small sample of 17 dwellings. To go further than a simple description of this sample and attempt to detect whether there are any significant differences (at population level rather than sample level) in
actions undertaken for different groups of reported thermal sensations, chi2 tests were
performed to explore possible habitual connections between actions aimed to create thermal comfort and the various levels of thermal sensation.
0 5 10 15 20 25 30 open in g win dow closin g win dow ho t d ri nk co ld d ri nk put on clothes
put off clothes thermostat up
thermostat down
warm shower cold shower Very light (sleeveless t- Light (n
ormal t-shirt)
Normal (kn
it sport
rather warm (lon
g warm (jac ke t) ver y w ar
m (jacket and lying/sleepin
g
sittin
g relaxed
light desk work
walkin g joggin g run nin g
actions related to thermal comfort clothing metabolic activity
number of cases
Living room--A/B dwellings
cool [3] a bit cool [33] neutral [97] a bit warm [18] warm [10] a 0 5 10 15 20 25 30 open in g win dow closin g win dow ho t d ri nk co ld d ri nk put on clothes
put off clothes thermostat up
thermostat down
warm shower cold shower Very light (sleeveless t- Light (n
ormal t-shirt)
Normal (kn
it sport
rather warm (lon
g warm (jac ke t) ver y w ar
m (jacket and lyin
g/sleepin
g
sittin
g relaxed
light desk work
walkin g joggin g run nin g
actions related to thermal comfort clothing metabolic activity
number of cases
Living room--F dwellings
cool [24] a bit cool [73] neutral [113] a bit warm [36] warm [4] b
FIGURE 4.6 a+b: Overview of actions towards thermal comfort, clothing worn and metabolic activity of A/B and F-labelled dwellings for various thermal sensations
To perform the chi2 analysis, categorical variables had to be converted into numerical
values. The chi2 for each action, clothing level, and metabolic activity was calculated by
creating three categories for each test. The first category concerns the number of cases for each particular situation (the combination of an action, e.g. hot drink, and the reported thermal sensation). The second category indicates whether the person performed the specific action or not (1 if they had and 0 if not), while the third indicates the RTS (1 = warm, 2 = a bit warm, 3 = neutral, 4 = a bit cool, 5 = cool; the missing thermal comfort levels hot and cold are due to a lack of data for the respective RTS). The three categories
were weighted based on the number of cases and then a chi2 test was performed. Since
many of the resulting chi2 tables had more than 20% of cells with an expected count of
less than five, Fisher’s exact test was used instead of chi2. Significance below 0.05 means
that differences in action/ clothing/ metabolic activity between different RTS do not happen by accident. Figure 4.7 shows the results of the Fisher’s tests.
Opening window Closing window Hot drink Cold drink Put on clothing Take off clothing
0,114 0,245 0,01 0,038 0,279 0,884
Thermostat up Thermostat down Hot shower Very light clothing Light clothing Normal clothing
0,068 0,23 1 0,067- 0,266
Rather warm clothing Warm clothing Lying sleeping/relaxed Sitting relaxed Light desk work Walking
0 0,209 0,012 0,001 0 0,065
Jogging
0,195
Opening window Closing window Hot drink Cold drink Put on clothing Take off clothing
0,062 1 0 0,419 0,004 0,94
Thermostat up Thermostat down Hot shower Very light clothing Light clothing Normal clothing
0 0,624 1 0,65 0,004 0,11
Rather warm clothing Warm clothing Lying sleeping/relaxed Sitting relaxed Light desk work Walking
0,224 0,511 0,013 0,297 0,072 0 Jogging 0,303 F label Ac tio ns a nd p va lue A label Ac tio ns a nd p va lue FIGURE 4.7 Chi2 tests performed to explore correlations between actions, clothing level or metabolic activity and RTS
Concerning the actions aimed towards thermal comfort, no correlations were found between the RTS and ‘opening’ or ‘closing the window’, ‘take off clothing’, ‘turn the thermostat down’ or ‘having a hot shower’ for both A/B and F label dwellings, which is a good indication that these actions are habitual and therefore not related to thermal comfort. Concerning clothing levels, no correlations were found between the RTS and wearing a very light, normal and warm combination of clothes while for metabolic activity, only jogging was unrelated to the RTS. Furthermore, the differences between labels A/B and F are conspicuous; only having a hot drink and lying sleeping/ relaxed are correlated with RTS on both labels. In A/B label dwellings, the only actions, clothing or metabolic activity that correlate to RTS are ‘having a cold drink’, wearing a ‘rather warm clothing’ ensemble (long-sleeved sweatshirt), ‘sitting relaxed’ and doing ‘light deskwork’. In F label dwellings ‘put on clothes’, ‘thermostat up’, wearing ‘light clothing’ (T-shirt) and ‘walking’ correlate to the RTS. This indicates that in the A/B dwellings the conditions during the heating season are so good (e.g. operative temperature, air velocities) that people do not feel the need to undertake any additional action. In F buildings, which generally have a poorer thermal envelope, these actions are needed to increase comfort. It may also be that in the A/B-labelled dwellings, which are well insulated and air-tight, the temperature can only be adjusted very slowly and the tenants of these dwellings know that changing the thermostat set point will have no immediate impact on their comfort.
‘Opening the window’, which is another factor that could affect the energy
consumption of a dwelling, was not related to the reported thermal sensation level for either the A/B or F-labelled dwellings. Thus, people probably open the window out of habit to ventilate the room, regardless of their thermal sensation. However, turning the thermostat up was related to the reported thermal sensation level in the F-labelled dwellings. The tenants of these dwellings used the thermostat to improve their thermal sensation, but this occurred more often when they felt ‘a bit cool’ rather than ‘cool’.
Turning the thermostat down was not related to the RTS, therefore, we can assume that tenants turned the thermostat down out of habit.
For the clothing combinations, only the wearing of rather warm (long-sleeved sweatshirt) was related to the RTS and the majority of the cases were recorded for ‘neutral’ thermal sensation, followed by ‘a bit cool’. This means that there were significantly more people wearing a long-sleeved shirt in the categories of ‘neutral’ and ‘a bit cool’ than in other categories. Finally, for the metabolic activity, ‘lying sleeping/ relaxed’, ‘sitting relaxed’ and ‘light desk work’ were found to be significantly related to the RTS. For ‘neutral’ thermal sensation, the majority of the tenants said they were just ‘sitting relaxed’, followed by ‘light desk work’.
§ 4.4.3.1
Clothing in relation to outdoor temperature
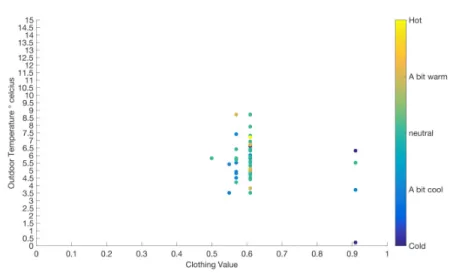
To further study whether clothing worn inside the dwelling relates to outdoor temperature, the clothing and metabolic activity levels recorded by the tenants were plotted in relation to the outdoor temperature as well as the thermal sensation for each data point. Figure 4.8 shows the plot between outdoor temperature and clothing for the F-dwellings. The results for the A-labelled dwellings are similar. The outdoor temperatures are presented on an hourly basis, as it was the smallest granularity available from the Royal Dutch Meteorological Institute. The clothing level at a given moment (for example at 2.35 p.m.) was plotted against the corresponding hourly outdoor temperature for that data point (in this case against the hourly value for outdoor temperature between 2 p.m. and 3 p.m.). During the non-sleeping hours in which tenants recorded their clothing levels (clo), the outdoor temperatures varied
between 2.5 oC and 15 oC. Indoor temperature for A/B-labelled dwellings varied
between 19 oC and 25.5 oC, while for F-labelled dwellings it was between 16 oC and
25.5 oC. The clothing level for both A/B and F-labelled dwellings was between 0.5 and
a little over 0.6 clo. The outliers (heavier clothing values) that appear further away from the major clusters probably reflect clothing people were wearing when they were outside the dwelling, having only recently returned, and not due to low indoor temperatures. This means that for this period of two weeks in March, regardless of the thermal quality of the dwelling and the indoor temperature, people had a consolidated
clothing pattern, which did not change despite the 13 oC difference in outside
temperature. This does not mean that the indoor clothing patterns do not relate to the outdoor temperature at seasonal level. However, when the adaptive model is used to assess the performance of houses, which generally can only be done using a shorter period of measurements, one cannot assume that clothing is dependent on outdoor temperature, even if the temperature range is high.
FIGURE 4.8 Clothing level versus hourly outdoor temperature for A/B and F-labelled dwellings per RTS
§ 4.5
Discussion, conclusions and recommendations
In our sample, the adaptive model predicted that tenants would have thermal sensations at the cold end, while the tenants themselves recorded sensations at the warmer end such as ‘a bit warm’ or ‘warm’. While many data points were inside the comfort band of the adaptive model, the thermal sensation scores corresponded to comfort levels other than ‘neutral’. At the same time, many tenants recorded ‘neutral’ thermal sensations when the indoor temperatures were below the lower limits of the adaptive model. The model might thus be both overestimating and underestimating tenants’ adaptive capacity in relation to achieving thermal comfort. It was also found that the explanatory power of outdoor temperature on indoor temperature was very low, and that clothing did not related to outdoor temperatures.
A limitation of this study was its short time span, by which it does not allow to refute or validate the adaptive model, as described by de Dear [2] which was aimed at modelling seasonal and regional differences. However, this model has been used since as a design and assessment guideline in which hourly values of the operative temperature are plotted against the reference outdoor temperature. The use of the adaptive model for
the dwellings of this study would lead to considering some of them as being out of the comfortable zone in March, while occupants reported feeling ‘neutral’. Although our sample, by its small size and its characteristics, cannot claim to be representative for all dwellings in the Netherlands, it has been possible, by using the Fisher’s test, to indicate which actions can be considered habitual or do relate to thermal sensation. Extending the study to more dwellings, our measurement method, by which the reported thermal sensation is measured many times a day and coupled to physical data, will allow the collection of more accurate data on actual comfort. Furthermore, the MRT and air velocities were not measured in situ. This was compensated by building simulations with Energy+ [31], but these parameters should be measured in further studies. De Dear [18,22] mentions that the adaptive model does not really provide any insight into why certain conditions will be comfortable or acceptable, other than a broad generalization that they conform to occupants’ expectations. The indoor temperatures would lead the adaptive model to assume that the tenants were comfortable, having already performed the adaptive actions aimed to create thermal comfort and a ‘neutral’ thermal sensation. Yet, this was not the case, and the tenants’ non-neutral feelings might lead them to perform additional acts, which could come at the expense of energy consumption, especially because the tenants in the monitoring study reported that economic factors played no role in their energy consumption.
The expectation aspect of the adaptive model relative to outdoor temperature lacks a solid foundation, a finding supported by several other studies [3,16]. The proposition of this study is that elements of expectations should also be explored with respect to the ideal indoor conditions and the thermal comfort level that tenants have consolidated in their minds. Furthermore, local behavioral, social and psychological aspects should be explored to create a robust expectation factor for residential dwellings, which can subsequently be validated by field experiments similar to the Ecommon study. However, one should keep in mind that the technical systems installed in residential dwellings might induce self-fulfilling prophecies. If the dwellings are equipped with constant temperature systems, the occupants will take this for granted and no adaptability to outdoor temperature will be observed, while such adaptability might exist and demonstrated by studies of dwellings that do have this adaptation possibility. The fact that in our sample (see our preceding paper [1]) the indoor temperatures in the A/B-labelled dwellings are higher than in the F-labelled dwellings and that there were not more people feeling non-neutral in the F dwellings indicates this adaptation possibility.
Finally yet importantly, a rethinking of the theoretical background of the adaptive model is required if it is to be applied to residential buildings. Despite the fact that they account for a very large share of energy consumption in the EU, residential buildings
have been treated up to now if they were similar to office buildings when it comes to thermal comfort models. The equations used are developed based on office buildings, while it is clear that the use of space, the activities undertaken, clothing worn, and actions aimed to improve thermal comfort differ in these two types of buildings. Future research must aim to develop and validate new equations that take the specific qualities of residential buildings and their inhabitants into account. References: REF. 4.01 Ioannou, Anastasios, and Laure Itard. “In-situ and real time measurements of thermal comfort and its determinants in thirty residential dwellings in the Netherlands.” Energy and Buildings 139 (2017): 487-505. REF. 4.02 De Dear, Richard J., et al. “Developing an adaptive model of thermal comfort and preference/
Discussion.” ASHRAE transactions 104 (1998): 145.
REF. 4.03 Nicol, J. Fergus, and Michael A. Humphreys. “Adaptive thermal comfort and sustainable thermal standards for buildings.” Energy and buildings 34.6 (2002): 563-572.
REF. 4.04 Karyono, Tri Harso. “Report on thermal comfort and building energy studies in Jakarta—Indonesia.” Building and environment 35.1 (2000): 77-90.
REF. 4.05 Feriadi, Henry, and Nyuk Hien Wong. “Thermal comfort for naturally ventilated houses in Indonesia.” Energy and Buildings 36.7 (2004): 614-626.
REF. 4.06 Wong, N. H., et al. “Thermal comfort evaluation of naturally ventilated public housing in Singapore.” Building and Environment 37.12 (2002): 1267-1277.
REF. 4.07 van der Linden, Kees, et al. “Thermal indoor climate building performance characterized by human comfort response.” Energy and Buildings 34.7 (2002): 737-744.
REF. 4.08 Fato, Ida, Francesco Martellotta, and Cecilia Chiancarella. “Thermal comfort in the climatic conditions of Southern Italy.” TRANSACTIONS-AMERICAN SOCIETY OF HEATING REFRIGERATING AND AIR CONDITIONING ENGINEERS 110.2 (2004): 578-593.
REF. 4.09 Standard, A. S. H. R. A. E. “Standard 55-2010.” Thermal environmental conditions for human occupancy (2010). REF. 4.10 Cen, E. N. “15251, Indoor environmental input parameters for design and assessment of energy performance of buildings addressing indoor air quality, thermal environment, lighting and acoustics.” European Committee for Standardization, Brussels, Belgium (2007).
REF. 4.11 Van der Linden, A. C., et al. “Adaptive temperature limits: A new guideline in The Netherlands: A new approach for the assessment of building performance with respect to thermal indoor climate.” Energy and buildings 38.1 (2006): 8-17.
REF. 4.12 van Hoof, Joost, and Jan LM Hensen. “Quantifying the relevance of adaptive thermal comfort models in moderate thermal climate zones.” Building and Environment 42.1 (2007): 156-170.
REF. 4.13 Baker, Nick, and Koen Steemers. Energy and environment in architecture: a technical design guide. Taylor & Francis, 2003.
REF. 4.14 De Dear, Richard. “Thermal comfort in practice.” Indoor air 14.s7 (2004): 32-39.
REF. 4.15 Fanger, P. O. “Thermal comfort. Analysis and applications in environmental engineering.” Thermal comfort. Analysis and applications in environmental engineering. (1970).
REF. 4.16 Halawa, E., and J. Van Hoof. “The adaptive approach to thermal comfort: A critical overview.” Energy and Buildings 51 (2012): 101-110.
REF. 4.17 Dear, R. de, Gail Brager, and Donna Cooper. “Developing an adaptive model of thermal comfort and preference-Final Report (ASHRAE RP-884).” Atlanta, GA: ASHRAE (1997).
REF. 4.18 Fountain, Marc, Gail Brager, and Richard de Dear. “Expectations of indoor climate control.” Energy and Buildings 24.3 (1996): 179-182.
REF. 4.19 Morgan, Craig, and Richard de Dear. “Weather, clothing and thermal adaptation to indoor climate.” Climate Research 24.3 (2003): 267-284.
REF. 4.20 McIntyre, D. A. “Design requirements for a comfortable environment.” Studies in environmental science 10 (1981): 195-220.
REF. 4.21 de Dear, Richard. “Adaptive comfort applications in Australia and impacts on building energy
consumption.” Proceedings of the 6th International Conference On Indoor Air Quality, Ventilation and Energy Conservation in Buildings (IAQVEC 2007), Sendai, Japan. 2007.
REF. 4.22 De Dear, Richard. “Revisiting an old hypothesis of human thermal perception: alliesthesia.” Building Research & Information 39.2 (2011): 108-117.
REF. 4.23 http://www.monicair.nl REF. 4.24 http://suslab.eu
REF. 4.25 http://installaties2020.weebly.com
REF. 4.26 Peeters, Leen, et al. “Thermal comfort in residential buildings: Comfort values and scales for building energy simulation.” Applied Energy 86.5 (2009): 772-780.
REF. 4.27 Oseland, Nigel A. “Predicted and reported thermal sensation in climate chambers, offices and homes.” Energy and Buildings 23.2 (1995): 105-115.
REF. 4.28 Niu, Jianlei, and John Burnett. “Integrating radiant/operative temperature controls into building energy simulations.” ASHRAE Transactions 104 (1998): 210.
REF. 4.29 ISSO, 2009. ISSO 82.3 Publication Energy Performance Certificate—Formula Structure (Publicatie 82.3 Handleiding EPA-W (Formulestructuur’), Senternovem, October 2009.
REF. 4.30 http://sydney.edu.au/architecture/staff/homepage/richard_de_dear/ashrae_rp-884.shtml
REF. 4.31 Ioannou, A., and L. C. M. Itard. “Energy performance and comfort in residential buildings: Sensitivity for building parameters and occupancy.” Energy and Buildings 92 (2015): 216-233.