Procedia Engineering 64 ( 2013 ) 1227 – 1234
Available online at www.sciencedirect.com
1877-7058 © 2013 The Authors. Published by Elsevier Ltd.
Open access under CC BY-NC-ND license.Selection and peer-review under responsibility of the organizing and review committee of IConDM 2013
doi: 10.1016/j.proeng.2013.09.202
ScienceDirect
International Conference On DESIGN AND MANUFACTURING, IConDM 2013
An experimental analysis and optimization of process parameter on
friction stir welding of AA 6061-T6 aluminum alloy using RSM
G. Elatharasan
a,V.S. Senthil Kumar
b*
aResearch Scholar, Department of Mechanical Engineering, CEG, Anna University, Chennai– 600025.Tamilnadu,India bAssociate Professor, Department of Mechanical Engineering, CEG, Anna University, Chennai – 600025.Tamilnadu,India
Abstract
Friction stir welding (FSW) process is an emerging solid state joining method in which the material that is being welded does not melt and recast. The welding parameters such as tool rotational speed, welding speed and axial force plays a major role in deciding the joint characteristics. In this investigation central composite design technique and mathematical model was developed by response surface methodology with three parameters, three levels and 20 runs, was used to develop the relationship between the FSW parameters (rotational speed, traverse speed, axial force,) and the responses (tensile strength, Yield strength (YS) and %Elongation (%E) were established.
© 2013 The Authors. Published by Elsevier Ltd.
Selection and peer-review under responsibility of the organizing and review committee of IConDM 2013. Keywords:FSW; aluminium alloy; response surface methodology;tensile strength;ANOVA
1.Introduction
Friction Stir Welding (FSW) has emerged as a new solid state joining technique. FSW was invented by The Welding Institute (TWI) in 1991 [1], especially for aluminum alloys [2,3]. The process as shown in Fig. 1, requires lower energy than conventional fusion welding processes [4,5] and no consumables such as electrodes and
* Corresponding author. Tel.: 944495248; E-mail address:[email protected]
Comment [S1]: Elsevier to update with vo and page numbers.
© 2013 The Authors. Published by Elsevier Ltd.
Open access under CC BY-NC-ND license.tensile strength of butt joints made of AA7039 aluminium alloys using Taguchi parametric design approach. Therefore in this paper to employ RSM to develop empirical relationships relating the FSW input parameters rotational speed, welding speed, axial force[12] and the three output responses ultimate tensile strength (UTS), Yield strength (YS) and %Elongation(%E) to find the optimal operating parameters.
Fig 1. The friction stir welding process.
2.Experimental work
2.1. Fabricating the joints and preparing the specimens
The material used in this investigation was AA6061-T6. The chemical composition of base metals are presented in Table 1.The rolled plates of 6 mm thickness were machined to the required size (100 mm X 50 mm) welding was carried out in butt joint configuration using friction stir welding machine. The welding direction was aligned normal to the rolling direction, the welded joints were machined to the required dimensions as shown in Fig. 2. Tensile specimens were fabricated as per the American Society for Testing of Materials (ASTM E8M-04) standards [13] to evaluate the tensile properties of the joints. As prescribed by the design matrix, totally twenty joints of each alloy were fabricated in this investigation. The photographs of some of the fabricated joints are displayed in Fig. 3.
Table 1- Nominal chemical composition of alloys used in this investigation.
Element Mg Mn Zn Fe Cu Si Cr Al
Fig 2. Dimensions of tensile specimen Fig 3. Photograph of tensile specimens
2.2 Design of experiments
Response surface methodology (RSM) [14] is an interaction of mathematical and statistical techniques for modelling and optimizing the response variable models which several independent variables influence a dependent variable or response and the goal is to optimize the response [15] Experiments have been carried out according to the experimental plan based on central composite rotatable second-order design (CCD)matrix with the star points being at the center of each face of factorial space was used,. The upper limit of a factor was coded as +1, and the lower limit was coded as –1. The “face-centered CCD” involves 20 experimental observations at three independent input variables. The experimental Friction stir welding parameters and their levels in this study in the actual form is given in Table 2
Table 2. An example of a table.
Parameter Level
-1 0 -1 A:Axial Load (kN) 6 8 10 B:Welding Speed (rpm) 800 1000 1200 C: Traverse speed (mm/min) 30 60 90
3.Results and Discussion
3.1 Developing the mathematical model
The adequacy of the developed empirical relationship for the response variables UTS, YS and %E was tested using the analysis of variance (ANOVA) technique [15]. The experimental Friction stir welding parameters and their levels in this study in the actual form is given in Table 3. The fit summary reveals that the fitted quadratic model is statistically significant to analyze the response variables. It is found that the calculated F ratios are larger than the tabulated values at a 95% confidence level; hence, the models are considered to be adequate. Another criterion that is commonly used to illustrate the adequacy of a fitted regression model is the coefficient of determination (R2). Which compares the range of the predicted value at the design point to the average prediction error, the values form of analysis of variance (ANOVA) obtained are given in the table 4.
3.1.Effect of Process Parameters on UTS
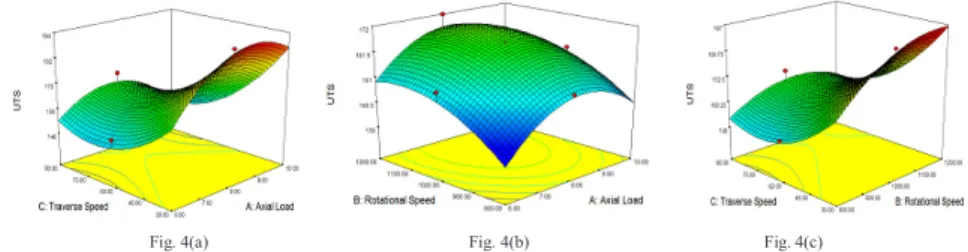
The plot for the response UTS of joint is illustrated in Fig. 4. This plot provides the response surface and shows the change of UTS while each FSW parameters moves from the reference value. Fig. 4a–c illustrates the counter plots presenting the interaction effect of any two input parameters on the UTS where the other parameters are on their center level. The increase in tool rotational speed, and tool axial force result in the increase in UTS of the FS welded joints up to a maximum value, where the decrease in welding speed result in the increase in UTS.
(kN) (rpm) (mm/min) (Mpa) (Mpa)
1 8 1000 60 138 129 6.9 2 8 1000 60 142 130 7.3 3 6 800 90 135 125 4.2 4 6 1200 90 148 136 5.8 5 10 1200 30 198 178 7.2 6 10 800 90 137 130 5.0 7 8 1000 60 153 145 6.2 8 8 1000 60 159 146 6.8 9 8 800 60 137 130 5.0 10 6 800 30 130 122 4.8 11 8 1000 90 145 132 4.5 12 10 1200 90 191 154 6.3 13 8 1200 60 190 159 6.5 14 6 1200 30 193 151 6.4 15 10 800 30 158 142 4.5 16 10 1000 60 163 151 5.5 17 8 1000 30 176 163 6.4 18 6 1000 60 190 159 6.5 19 8 1000 60 145 135 7.3 20 8 1000 60 140 130 7.0
Fig. 4(a) Fig. 4(b) Fig. 4(c) Fig. 4 (a), (b) and (c) shows the response of Rotational Speed, Welding Feed and Axial Load on UTS
3.2.Effect of Process Parameters on YS
The plot for the 3D response YS of joint is illustrated in Fig.5. Fig. 5 a–c illustrates the counter plots presenting the interaction effect of any two input parameters on the YS. The higher rotational speeds, lower welding speeds and higher axial forces result to elimination of the defects in WZ of the joints due to enough friction and plastic flow of material and so the YS is higher.
Fig.5 (a) Fig. 5(b) Fig. 5(c)
Fig. 5 (a), (b) and (c) shows the response of Rotational Speed, Welding Feed and Axial Load on YS
3.3.Effect of Process Parameters on %E
The response %E of joints is illustrated in Fig 6 As can be seen from Fig 6a–c, the increase in tool rotational speed and tool axial force result in the increase in TE of the FS welded joints continuously where the decrease in welding speed result in the increase in TE. Increasing the tool rotational speed and axial force, and decreasing the welding speed lead to elimination of the defects in WZ of the joints due to enough friction and plastic flow of material and so, the TE is higher.
Fig. 6(a) Fig. 6(b) Fig. 6(c)
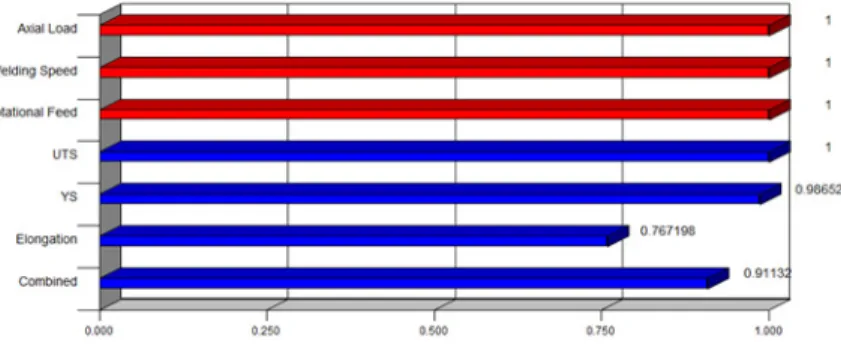
respectively. Using Design Expert software gives the combined desirability value of 0.91. Table-4ANOVA table for response surface model
Source SquaresSum of df Mean Square F Value p-value Prob > F For UTS Model 4458.52 9 495.39 44.36 < 0.0001 significant Residual 111.68 10 11.17 Lack of Fit 108.35 5 21.67 32.50 0.0008 Pure Error 3.33 5 0.67 Std. Dev. 3.34 R-Squared 0.9756
Mean 160.70 Adj R-Squared 0.9536
C.V. % 2.08 Pred R-Squared 0.8676
PRESS 605.11 Adeq Precision 23.486
For YS Model 3787.05 9 420.78 13.48 0.0002 significant Residual 312.15 10 31.22 Lack of Fit 268.82 5 53.76 6.20 0.0334 Pure Error 43.33 5 8.67 Cor Total 4099.20 19 Std. Dev. 5.59 R-Squared 0.9239
Mean 144.20 Adj R-Squared 0.8553
C.V. % 3.87 Pred R-Squared 0.4876
PRESS 2100.55 Adeq Precision 13.654
For %E Model 13.40 9 1.49 7.70 0.0019 significant Residual 1.93 10 0.19 Lack of Fit 1.30 5 0.26 2.05 0.2242 Pure Error 0.63 5 0.13 Cor Total 15.33 19 Std. Dev. 0.44 R-Squared 0.8739
Mean 6.22 Adj R-Squared 0.7603
C.V. % 7.07 Pred R-Squared 0.2462
Fig. 7 Bar graph showing the maximum desirability of 0.91 for the combined objective
4.Conclusion
In this study, the UTS, YS and TE in FSW process were modelled and analyzed through response surface methodology (RSM). A central composite design (CCD) in RSM consisting of three variables. Rotational speed, traverse speed and axial force have been employed to carry out the experimental study. Analysis of variance (ANOVA) was applied to study; the following points can be concluded:
Empirical relationship were developed to estimate the Ultimate tensile strength, Yield strength and tension Elongation of friction stir welded AA 6061-T6 aluminium alloy. The ANOVA analysis showed that the developed model can be effectively used to predict the UTS,YS and TE of the joints at 95% confidence level.
UTS and YS of the FS welded joints increased with the increase of tool rotational speed, welding speed and tool axial force up to a maximum value, and then decreased.
TE of joints increased with increase of rotational speed and axial force, but decreased by increasing of welding speed, continuously.
A maximum tensile strength of 197.50 MPa, Yield strength of 175.25MPa and % of Elongation of 6.96 was exhibited by the FSW joints fabricated with the optimized parameters of 1199 r/min rotational speed, 30 mm/min welding speed and 9.0 kN axial force.
References
[1] Thomas, W. M., Nicholas, E. D., Needham, J . C., Murch, M. G.,Templesmith P., And Dawes, C. J. 1991. Friction Stir Butt Welding, U.S. Patent No. 5 460 317.
[2] Franchim, A.S., Fernandez F.F., Travessa, D.N., 2011.Microstructural aspects and mechanical properties of friction stir welded AA2024-T3 aluminium alloy sheet. Mater Des;32 pp.4684–4688.
[3]Rajakumar, S., Muralidharan, C., Balasubramanian, V. 2011.Predicting tensile strength, hardness and corrosion rate of friction stir welded AA6061-T6 aluminium alloy joints. Mater Des; 32:pp.2878–90.
[4] Mahoney, M.W., Rhodes, C.G., Flintoff, J.G., Spurling RA., Bingel WH. 1998. Properties of friction stir welded 7075 T651 aluminium. Metall Mater Trans A 1998;29:1955–64.
[5] Colligan, K., 1999.Material flow behaviour during friction stir welding of aluminium. Weld J;7pp.229–37.
[6] Arbegast, W.J., Mishra, R.S., Mahaney,M.W. 2007. Friction Stir Welding and Processing, ASM International, Materials Park, OH, , pp. 273–308.
[7] Won Bae Lee., Yun-Mo Yeon., Seung-Boo Jung., 2004. Mechanical properties related to micro structural variation of 6061 Al alloy joints by friction stir welding. Mater Trans; 45pp, 1700–1705.
[8] Chao, YJ., Qi X., 1998.Thermal and thermo-mechanical modeling of friction stir welding of aluminium alloy 6061–T6. J Mater Proc Manf Sci;7 pp.215–33