ELECTRONIC LETTER
Comparison of fluorescent SSCP and denaturing HPLC
analysis with direct sequencing for mutation screening in
hypertrophic cardiomyopathy
J Mogensen, A Bahl, T Kubo, N Elanko, R Taylor, W J McKenna
. . . . J Med Genet 2003;40:e59(http://www.jmedgenet.com/cgi/content/full/40/5/e59)
T
he recent achievement of the human genome project hasled to the identification of many disease genes in common hereditary conditions, in which patients and their relatives would benefit from genetic diagnosis. This has increased the need for simple, sensitive, and cost effective methods of mutation analysis. However, the “gold standard” of mutation analysis, direct sequencing, is still an expensive and labour intensive method for investigation of large genes, multi-allelic diseases, and large numbers of patients. Today the most frequently used methods for prescreening disease genes for mutations are single strand conformation polymor-phism analysis (SSCP) and denaturing high performance liq-uid chromatography (DHPLC). Both methods accelerate specific diagnosis at the DNA level by limiting the need for direct sequencing to a few abnormal polymerase chain reaction (PCR) products identified in the prescreening proce-dure.
The tecnique of SSCP analysis is based on the principle that changes in nucleic acid composition affect the conformation of single stranded DNA and thereby the mobility of the frag-ment when it is subjected to electrophoresis under
non-denaturing conditions.1 2
Abnormal conformers identified in the prescreening procedure are subsequently investigated for the presence of sequence variants by direct sequencing. The tecnique was initially developed for manual gel electrophore-sis in which the mobility of amplified PCR products was visu-alised by incorporation of radiolabelled nucleotides or by silver
staining after electrophoresis.3Recently, SSCP has been
devel-oped for automated capillary electrophoresis (CE) using
buff-ered polymer solution as the sieving matrix for electrophoretic
separation and fluorescence as the method of detection.4–7
Fluorescent capillary electrophoresis SSCP (F-SSCP) has the advantage of limited “post-PCR” handling of samples, which are loaded and analysed automatically with the possibility of a high throughput. Also, the requirements for reagent and sample volumes are small. Previous studies have reported a high sensitivity and specificity of F-SSCP. However, the primary method of identifying mutations used to investigate the efficacy of mutation detection by F-SSCP is unclear in sev-eral reports. Some reports investigated the ability of F-SSCP to identify mutations initially disclosed by manual SSCP. Only a few of the previously reported test mutations were identified by direct sequencing or introduced in specific test DNA by site directed mutagenesis.7–10
The technique of DHPLC has been developed more recently and relies on different retention times of homoduplex and heteroduplex DNA on ion pair reverse phase chromatography. Partial heat denaturation of samples decreases the retention time of mismatched DNA fragments compared with their
intact double stranded counterparts.11
The method has similar advantages to F-SSCP, that is, automation, no “post-PCR” handling of samples, high throughput, and low cost, not least because PCR products are amplified with unlabelled primers. Several studies have reported high sensitivity and specificity when compared to mutations identified by various SSCP
analyses and direct sequencing.12–15
This study investigated the suitability of F-SSCP and DHPLC for detection of sequence variants in five disease genes associated with the phenotypic expression of the most common hereditary heart condition known as hypertrophic
cardiomyopathy (HCM).16–19 The disease is characterised by
unexplained thickening of the heart muscle and predomi-nantly inherited as an autosomal dominant trait with a
preva-lence of about 1:500 in a young adult population.20
Initially, the five genes were subjected to direct sequencing in 100 patients and 78 different sequence variants were identified. Subse-quently, F-SSCP analysis was developed for a 16 capillary electrophoresis machine (ABI Prism 3100 genetic analyser, Applied Biosystems) and the ability to detect abnormal conformers of sequence variants identified by direct sequenc-ing was evaluated. Similarly, the ability of DHPLC (Wave 3500HT DNA fragment analysis system, Transgenomic) to detect the same sequence variants was investigated.
Key points
• The “gold standard” for mutation analysis, direct sequencing, is expensive and labour intensive for high throughput mutation screening, emphasising the need for alternative simple, sensitive, and cost effective meth-ods for mutation analysis.
• We developed F-SSCP analysis for a 16 capillary elec-trophoresis machine and compared sensitivity, specifi-city, and reproducibility with DHPLC analysis. All 78 sequence variants (56 heterozygous, 22 homozygous) investigated by F-SSCP and DHPLC were initially identi-fied by direct sequencing.
• The sensitivity of F-SSCP and DHPLC was 95% and 100% respectively, and the specificity was 97% for F-SSCP and 100% for DHPLC. Both methods were highly reproducible.
• We conclude that both F-SSCP and DHPLC analysis are valuable tools for high throughput mutation screening with high sensitivity and specificity. Also, both methods require minimal “post-PCR” handling of samples, are easily optimised, and have low running costs.
. . . .
Abbreviations:CE, capillary electrophoresis; DHPLC, denaturing high performance liquid chromatography; F-SSCP, fluorescent capillary electrophoresis SSCP;GLA,α-galactosidase; HCM, hypertrophic cardiomyopathy; PCR, polymerase chain reaction;PRKAG2, AMP activated protein kinase; RFU, relative fluorescent units; SSCP, single strand conformation polymorphism;TNNI3, troponin I; TNNT2, troponin T;TPM1,α-tropomyosin
MATERIALS AND METHODS
Blood samples were obtained from patients with hypertrophic cardiomyopathy in accordance with guidelines from the local ethics committee. Informed consent was obtained from all participants.
The protein encoding exons of the following genes, troponin T (TNNT2),troponin I(TNNI3),α-tropomyosin(TPM1),AMP
activated protein kinase (PRKAG2), and α-galactosidase
(GLA), were amplified using intronic primers designed according to the genomic sequences of the genes. One hundred samples were sequenced in all exons (52 in total) of each of these genes. Primer sequences, PCR conditions for amplification of each of the genes, and the manual used for direct sequencing are available at our website (http:// www.sghms.ac.uk/depts/cardiology/groups/Mogensen/data).
Fluorescent SSCP analysis of heterozygous sequence variants
The PCR product (1µl) was mixed with deionised formamide
(10µl), NaOH (0.5µl of a 0.3 M NaOH solution), and size
standard (0.75µl, ROX 500, Applied Biosystems). The sample
was denatured at 95°C for five minutes and cooled on ice before loading. Capillary electrophoresis was performed on an ABI Prism 3100 genetic analyser (Applied Biosystems) through 16 capillaries with a length to detection of 36 cm using Genescan polymer (5%) with added glycerol (5%) and
1×EDTA buffer under non-denaturing conditions.
Electro-phoresis was performed at three different temperatures (18°C, 25°C, 35°C) at varying injection times and voltages for 35–52 minutes to optimise the final analysis.
The mobility of F-SSCP fragments was measured relative to ROX size standard by use of Genescan software (Applied Bio-systems). Subsequent analysis of fragments was performed with Genotyper software, version 3.7 (Applied Biosystems). A fragment was considered abnormal when shape or mobility was out of range of control fragments.
Fluorescent SSCP analysis of homozygous sequence variants
Analysis of homozygous sequence variants was essentially the same as for heterozygous variants. Fragments of control and test samples were analysed in two separate capillary electrophoreses. The concentration of each fragment was esti-mated as the peak height in relative fluorescent units (RFU) by use of Genotyper software. Subsequently, the control and the test sample were mixed in equal concentration and reana-lysed. A fragment was considered abnormal when shape or mobility was out of the range of control fragments.
DHPLC analysis of heterozygous sequence variants
Heteroduplex analysis was performed using a wave DNA frag-ment analysing system 3500HT (Transgenomic) in accordance with the manual of the manufacturer (details available on http://www.sghms.ac.uk/depts/cardiology/groups/Mogensen/ data). Melting profiles for each DNA fragment were generated with Wavemaker 4.1.40 software (Transgenomic). Any peak falling below 1 mV was reinjected in a larger volume.
DHPLC analysis of homozygous sequence variation
Analysis of homozygous sequence variants was essentially the same as for heterozygous variants. Fragments of control and test samples were analysed in two separate analyses. The con-centration of each fragment was estimated as the peak height in mV by use of Wavemaker software. Subsequently, control and test samples were mixed in equal concentration and reanalysed. A fragment was considered abnormal when shape or width of the peak was different from that of the wild type control.
Study design
A total of 23 different PCR fragments were analysed by F-SSCP and DHPLC, representing the exons of genes that contained 78 sequence variants initially identified by direct Figure 1 Diagram showing optimisation of PCR fragment (exon
16,TNNI3) for F-SSCP analysis at 18°C with varying IV/IT settings. Forward primers were labelled with FAM (blue) and reverse primers were labelled with HEX (green). The scale is in relative fluorescent units. (A) IV/IT setting (7/18) resulted in a high concentration of HEX labelled PCR product with the presence of an artificial double peak; (B) IV/IT setting (6/15) resulted in suitable resolution with
unambiguous readings; (C) IV/IT setting (4/10) resulted in low resolution acceptable readings; (D) IV/IT setting (3/8) resulted in low concentration of both FAM and HEX labelled PCR product with ambiguous readings.
Table 1 Standard electrophoresis settings for optimisation of fluorescent SSCP at three temperatures 18°C Distribution of optimal conformers 25°C Distribution of optimal conformers 35°C Distribution of optimal conformers IV IT IV IT IV IT 4 10 12 5 8 3 3 8 4 6 15 9 6 5 12 5 10 17 7 10 13 6 15 15 6 15 9 7 18 5 7 18 9 7 18 9
Total 39 Total 39 Total 39
The distribution of optimal conformers of different PCR products is shown at various injection voltages (IV) and injection times (IT). PCR products ranged in size from 190–468 bp.
sequencing. Results from the F-SSCP and DHPLC were analysed independently by three investigators. Each amplicon was scored as abnormal or normal by comparison with a wild type chromatogram
RESULTS
Direct sequencing
Samples of DNA from 100 patients with HCM were subjected to direct sequencing in five genes (52 exons) previously reported to be associated with the phenotypic expression of HCM. A total of 78 sequence variants were identified, of which 56 were heterozygous and 22 were homozygous (results are available on our website http://www.sghms.ac.uk/depts/ cardiology/groups/Mogensen/data). Twenty-nine of the 56 heterozygous sequence variants were thought to be “disease causing” mutations and the remaining 27 were polymor-phisms. Similarly, eight of the 22 homozygous sequence vari-ants were thought to be “disease causing” mutations whereas the remaining 14 were polymorphisms. Most sequence variants were single base substitutions (72/78, 92%), whereas only a few were insertions/deletions in the range of 1–5 base pairs (6/78, 8%).
Fluorescent SSCP for detection of heterozygous sequence variants
Initial optimisations were aimed at defining a set of conditions for F-SSCP by which the resolution of PCR products was suit-able for analysis. The resolution is influenced by the amount of PCR product passing through the capillaries, which can be regulated by using different injection times (IT) and injection voltages (IV). The impact of 26 different IT/IV settings on the resolution of 15 different PCR products at three temperatures was investigated (data not shown). Optimal readings of conformers were obtained when their height was in the range of 200–3000 RFU defined by Genotyper software (Applied Biosystems) (fig 1). Conformers with heights outside this range resulted in ambiguous readings and were not usable for
analysis. Four different IT/IV settings for each temperature were shown to enable optimal reading of the initial 15 PCR products investigated (table 1). Subsequent analysis of an additional 24 different PCR products confirmed that the four settings for each temperature were sufficient for optimal read-ings of all PCR products.
The PCR products of exons with sequence variants as well as their corresponding wild type sequence were amplified using forward and reverse primers labelled with the fluores-cent dyes FAM and HEX, respectively. Optimal electrophoresis conditions for each of the different exons was determined with the IT/IV settings in table 1. The PCR products were sub-jected to capillary electrophoresis at three different tempera-tures and diagrams of representative conformers are shown in fig 2. Fifty-three of 56 (95%) heterozygous sequence variants were detected as abnormal conformers by F-SSCP (results available at http://www.sghms.ac.uk/depts/cardiology/groups/ Mogensen/data). One “disease causing” mutation out of 29 was not detected by F-SSCP implying a mutation specific sen-sitivity of 97%.
It was apparent that use of two temperatures for F-SSCP analysis only (18°C, 35°C) achieved the same sensitivity as the use of all three temperatures tested (table 2). The run to run variability of F-SSCP was investigated by repeated electro-phoresis (four times) of eight different PCR products at three temperatures. No significant change in fragment mobility was detected implying a high reproducibility of F-SSCP (data not shown). The specificity of F-SSCP was 97% after analysis of 966 PCR products of which 29 were identified as abnormal but turned out to be a wild type sequence on direct sequencing.
Previous investigations using manual SSCP electrophoresis have reported reduced mutation detection rates in PCR
prod-ucts above 300 bp.21
In the current study there was no differ-ence when comparing detection rates of abnormal conformers of PCR products ranging from 100–300 bp and 301–500 bp
(results available at http://www.sghms.ac.uk/depts/
cardiology/groups/Mogensen/data). These results were in accordance with previous findings that F-SSCP can detect
sequence variants in PCR products of up to 1200 bp.7 22
Fluorescent SSCP for detection of homozygous sequence variants
Direct sequencing identified a total of 22 homozygous
sequence variants (results available at http://
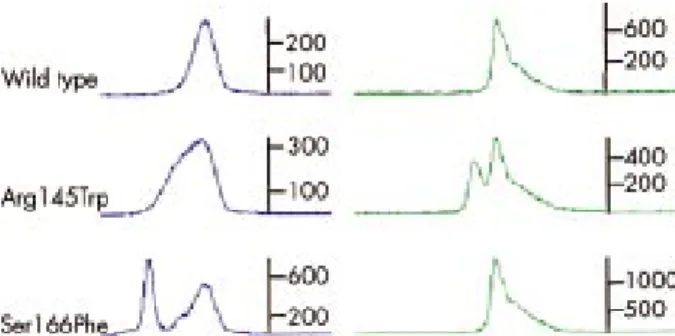
www.sghms.ac.uk/depts/cardiology/groups/Mogensen/data). When subjected to F-SSCP without mixing the test and wild type control samples it was only possible to detect 15 of the 22 variants (70%). However, on mixing of the test and wild type sample in equal concentration it was possible to detect all homozygous sequence variants by F-SSCP analysis at three different temperatures (fig 3). Both test and wild type sequences were amplified with FAM labelled forward primers and HEX labelled reverse primers. In an attempt to enhance the separation of wild type and homozygous sequence variation, a primer set labelled “opposite” with HEX labelled forward and FAM labelled reverse primer was made. However, two complete separate peaks of FAM and HEX occurred after F-SSCP analysis of the same wild type PCR product when amplified with FAM forward primer and HEX forward primer, Figure 2 Examples of abnormal conformers identified by F-SSCP
and subsequently shown to harbour heterozygous sequence variation by direct sequencing. Forward primers were labelled with FAM (blue) and reverse primers were labelled with HEX (green). The scale is in relative fluorescent units. The Ser166Phe sequence variant was identified by the FAM labelled conformer only. When compared to wild type controls most conformers with sequence variants exhibited either double peaks (40%), broadening of the peak base (40%), triple peaks or more (5%), or a different speed of migration (15%).
Table 2 Distribution of heterozygous sequence variations identified by fluorescent SSCP as a function of different analysis temperatures PCR products (No) Sequence variations (No (%))
Fluorescent SSCP analysis temperatures (No (%))
18°C 25°C 35°C 18°C, 25°C 18°C, 35°C 25°C, 35°C 18°C, 25°C, 35°C 23 56 (100) 50 (89) 45 (80) 45 (80) 50 (89) 53 (95) 51 (91) 53 (95)
respectively. This indicated a different migration time for the dyes FAM and HEX and made it impossible to use for separa-tion of wild type and homozygous sequence variasepara-tions (data not shown).
DHPLC for detection of heterozygous sequence variants
In our experience analysis of PCR fragments by DHPLC analy-sis gives optimal resolution and reproducibility when the peak height of the eluted PCR product is above 1 mV. The identifi-cation rate of false positive PCR products ranged from 10%–20% when peaks were below 1 mV and therefore these fragments were reanalysed after reinjection of a larger sample volume. When necessary, the percentage of buffer B was opti-mised to obtain an elution time of PCR fragments of about two minutes, well away from the initial injection spike (figs 4 and 5). All test mutations were identified by analysis at one oven temperature.
All 56 heterozygous sequence variants were identified by DHPLC (results available at http://www.sghms.ac.uk/depts/ cardiology/groups/Mogensen/data). The specificity of DHPLC after analysis of 384 PCR fragments was 100%.
DHPLC for detection of homozygous sequence variants
Analysis with DHPLC relies on heteroduplex detection and is therefore not suitable for detection of homozygous sequence variants unless mixed with a wild type sample in equal
concentration. After this analysis all homozygous sequence variants were detected (fig 5).
DISCUSSION
It was the aim of the current study to investigate the suitabil-ity of F-SSCP and DHPLC for mutation screening in the most common hereditary heart disease, HCM. The condition is caused by mutations in multiple disease genes and most families carry their own private mutation necessitating comprehensive genetic investigation of all protein encoding exons. The sensitivity and specificity of F-SSCP and DHPLC with respect to identification of sequence variants was compared with direct sequencing, which is often considered the “gold standard” for identification of unknown missense and small insertion or deletion mutations.
The sensitivity of F-SSCP and DHPLC was 95% and 100% respectively. However, there was no significant difference in detection rate between the two methods used (Fisher’s exact test, p=0.24). The high sensitivity of F-SSCP was achieved by labelling both forward and reverse primers with fluorescent dyes because 15% of all sequence variants were identified by the appearance of only one abnormal conformer of the ampli-fied PCR product (fig 2). It was not apparent why sequence variants in some PCR products remained unidentified by F-SSCP analysis as they did not differ from PCR products with identifiable sequence variants with respect to GC content, length of the PCR product, or position of the sequence
varia-tion relative to the 5′end of the PCR product.
The specificity of F-SSCP and DHPLC was 97% and 100% respectively. The PCR products identified by F-SSCP as false positive exhibited only minor variants from control samples. The appearance of false positive conformers in F-SSCP could be because of minor variants in electrophoresis conditions between capillaries, which might be induced by the presence of microscopic air bubbles or particles.
Both methods were highly reproducible but it was our experience that PCR products for DHPLC analysis should be stored at−20o
C to obtain reproducible results, indicating that heteroduplexes in general were not stable at room tempera-ture.
Before high throughput screening can be established PCR fragments for F-SSCP and DHPLC analysis need optimisation which is the time consuming part of both methods. However, in the current study PCR fragments on average only needed two different set of conditions for both methods before a suit-Figure 3 Example of identification of homozygous sequence
variation by F-SSCP (TNNT2, exon 9, 126T>C). Forward primers were labelled with FAM (blue) and reverse primers were labelled with HEX (green). The scale is in relative fluorescent units. (A) Wild type (WT) sequence; (B) homozygous sequence variation with WT conformer configuration and prolonged migration time; (C) wild type and homozygous mixed in equal concentration with distinct separation of peaks.
Figure 4 Examples of abnormal elution profiles identified by DHPLC analysis and subsequently shown to harbour sequence variants by direct sequencing (TNNI3, exon 7). When compared to wild type controls most elution profiles with sequence variants exhibited either double or multiple peaks (>95%), whereas a
Figure 5 Example of identification of homozygous elution profiles by DHPLC (TNNT2, exon 9, 126T>C). (A) Wild type sequence; (B) homozygous sequence variation with wild type elution configuration; (C) wild type and homozygous mixed in equal concentration with distinct separation of peaks.
appropriate running conditions have been established the time burden of processing samples is limited because of the automation of both methods. The genetic analyser ABI 3100
has an overall capacity of analysing 576 (6×96) F-SSCP
sam-ples in 24 hours implying that 288 (3×96) samples can be
processed at two different temperatures a day. Polymer needs
to be added after analysis of 1344 (14×96) samples enabling
continuous F-SSCP analysis for 56 hours without inspection of the machine. This is feasible because F-SSCP samples can be loaded automatically from two 384 well plates for repeated analysis at different temperatures. The 3500HT Wave genetic analyser has a capacity of 360 samples in 24 hours at one tem-perature and needs daily refilling of buffer reservoirs.
The fixed cost of buying a genetic analyser (ABI 3100) is about twice the price of a 3500HT Wave genetic analyser. However, the 3500HT Wave genetic analyser requires addi-tional equipment for subsequent direct sequencing of abnormal elution profiles. The cost of running the analysis of F-SSCP and DHPLC depends on the volume of samples pro-cessed. In our laboratory we aim at investigating 200 patients with HCM in nine recognised disease genes a year (about 136 PCR products for each patient) and in this setting the cost of both F-SSCP and DHPLC is less than 15% compared to direct sequencing. However, in a low throughput setting F-SSCP analysis is more expensive than DHPLC owing to the higher cost of primers labelled with fluorescent dyes.
In conclusion, F-SSCP and DHPLC analysis are valuable tools for high throughput mutation screening because both methods have high sensitivity and specificity when compared to identification of mutations by direct sequencing. In addition both methods require minimal “post-PCR” handling of samples, are easily optimised and have low running costs.
ACKNOWLEDGEMENTS
We thank Dr Juan Gimeno for statistical advice. The study was supported by grants from the British Heart Foundation, The Danish Medical Research Council, and The Danish Heart Foundation. . . . .
Authors’ affiliations
J Mogensen, A Bahl, T Kubo, N Elanko, R Taylor, W J McKenna,
Department of Cardiological Sciences and Medical Genetics, St. George’s Hospital Medical School, London, UK, and the Department of Medicine and Geriatrics, Kochi Medical School, Kochi, Japan Correspondence to: Dr J Mogensen, Department of Cardiological Sciences, St George’s Hospital Medical School, Cranmer Terrace, Tooting, SW17 0RE, London, UK; jmogense@sghms.ac.uk
REFERENCES
1Hayashi K. PCR-SSCP: a simple and sensitive method for detection of mutations in the genomic DNA.PCR Methods Appl 1991;1:34–38. 2Nataraj AJ, Olivos-Glander I, Kusukawa N, Highsmith WEJ. Single strand conformation polymorphism and heteroduplex analysis for gel based mutation detection.Electrophoresis 1999;20:1177–85.
3Nollau P, Wagener C. Methods for detection of point mutations: performance and quality assessment. IFCC Scientific Division, Committee on Molecular Biology Techniques.Clin Chem 1997;43:1114–28. 4Hebenbrock K, Williams PM, Karger BL. Single strand conformational
polymorphism using capillary electrophoresis with two dye laser induced fluorescence detection.Electrophoresis 1995;16:1429–36.
5Hayashi K. Recent enhancements in SSCP.Genet Anal 1999;14:193–6. 6Highsmith WEJ, Nataraj AJ, Jin Q, O’Connor JM, El-Nabi SH,
Kusukawa N, Garner MM. Use of DNA toolbox for the characterization of mutation scanning methods. II: evaluation of single-strand conformation polymorphism analysis.Electrophoresis 1999;20:1195–203.
7Larsen LA, Christiansen M, Vuust J, Andersen PS. High throughput single strand conformation polymorphism analysis by automated capillary electrophoresis: robust multiplex analysis and pattern based identification of allelic variants.Hum Mutat 1999;13:318–27.
8Walz T, Geisel J, Bodis M, Knapp JP, Herrmann W. Fluorescence based single strand conformation polymorphism analysis of mutations by capillary electrophoresis.Electrophoresis 2000;21:375–9. 9Ren J, Ueland PM. Temperature and pH effects on single strand
conformation polymorphism analysis by capillary electrophoresis.Hum Mutat 1999;13:458–63.
10Ellis LA, Taylor CF, Taylor GR. A comparison of fluorescent SSCP and denaturing HPLC for high throughput mutation scanning.Hum Mutat 2000;15:556–64.
11Xiao W, Oefner PJ. Denaturing high-performance liquid chromatography: A review.Hum Mutat 2001;17:439–74.
12Jones AC, Austin J, Hansen N, Hoogendoorn B, Oefner PJ, Cheadle JP, O’Donovan MC. Optimal temperature selection for mutation detection by denaturing HPLC and comparison to single-stranded conformation polymorphism and heteroduplex analysis.Clin Chem 1999;45:1133– 40.
13O’Donovan MC, Oefner PJ, Roberts SC, Austin J, Hoogendoorn B, Guy C, Speight G, Upadhyaya M, Sommer SS, McGuffin P. Blind analysis of denaturing high performance liquid chromatography as a tool for mutation detection.Genomics 1998;52:44–9.
14Matyas G, De PA, Halliday D, Boileau C, Pals G, Steinmann B. Evaluation and application of denaturing HPLC for mutation detection in Marfan syndrome: Identification of 20 novel mutations and two novel polymorphisms in the FBN1 gene.Hum Mutat 2002;19:443–56. 15Gross E, Arnold N, Goette J, Schwarz-Boeger U, Kiechle M. A
comparison of BRCA1 mutation analysis by direct sequencing, SSCP and DHPLC.Hum Genet 1999;105:72–8.
16Kimura A, Harada H, Park JE, Nishi H, Satoh M, Takahashi M, Hiroi S, Sasaoka T, Ohbuchi N, Nakamura T, Koyanagi T, Hwang TH, Choo JA, Chung KS, Hasegawa A, Nagai R, Okazaki O, Nakamura H, Matsuzaki M, Sakamoto T, Toshima H, Koga Y, Imaizumi T, Sasazuki T. Mutations in the cardiac troponin I gene associated with hypertrophic
cardiomyopathy.Nat Genet 1997;16:379–82.
17Sachdev B, Takenaka T, Teraguchi H, Tei C, Lee P, McKenna WJ, Elliott PM. Prevalence of Anderson-Fabry disease in male patients with late onset hypertrophic cardiomyopathy.Circulation 2002;105:1407–11. 18Thierfelder L, Watkins H, MacRae C, Lamas R, McKenna W, Vosberg
HP, Seidman JG, Seidman CE.α-Tropomyosin and cardiac troponin T mutations cause familial hypertrophic cardiomyopathy: a disease of the sarcomere.Cell 1994;77:701–12.
19Blair E, Redwood C, Ashrafian H, Oliveira M, Broxholme J, Kerr B, Salmon A, Ostman-Smith I, Watkins H. Mutations in theγ(2) subunit of AMP-activated protein kinase cause familial hypertrophic
cardiomyopathy: evidence for the central role of energy compromise in disease pathogenesis.Hum Mol Genet 2001;10:1215–20. 20Maron BJ, Gardin JM, Flack JM, Gidding SS, Kurosaki TT, Bild DE.
Prevalence of hypertrophic cardiomyopathy in a general population of young adults. Echocardiographic analysis of 4111 subjects in the CARDIA Study. Coronary artery risk development in (young) adults. Circulation 1995;92:785–9.
21Sheffield VC, Beck JS, Kwitek AE, Sandstrom DW, Stone EM. The sensitivity of single strand conformation polymorphism analysis for the detection of single base substitutions.Genomics 1993;16:325–32. 22Kukita Y, Tahira T, Sommer SS, Hayashi K. SSCP analysis of long DNA