NASA/TM—2011–216423
Basis Function Approximation of Transonic
Aerodynamic Influence Coefficient Matrix
Wesley W. Li and Chan-gi Pak
Dryden Flight Research Center, Edwards, California
Click here: Press F1 key (Windows) or Help key (Mac) for help
March
2011
NASA STI Program ... in Profile
Since its founding, NASA has been dedicatedto the advancement of aeronautics and space science. The NASA scientific and technical information (STI) program plays a key part in helping NASA maintain this important role. The NASA STI program operates under the auspices of the Agency Chief Information Officer. It collects, organizes, provides for archiving, and disseminates NASA’s STI. The NASA STI program provides access to the NASA Aeronautics and Space Database and its public interface, the NASA Technical Report Server, thus providing one of the largest collections of aeronautical and space science STI in the world. Results are published in both non-NASA channels and by NASA in the NASA STI Report Series, which includes the following report types:
• TECHNICAL PUBLICATION. Reports of completed research or a major significant phase of research that present the results of NASA Programs and include extensive data or theoretical analysis. Includes compila- tions of significant scientific and technical data and information deemed to be of continuing reference value. NASA counter-part of peer-reviewed formal professional papers but has less stringent limitations on manuscript length and extent of graphic presentations.
• TECHNICAL MEMORANDUM.
Scientific and technical findings that are preliminary or of specialized interest, e.g., quick release reports, working papers, and bibliographies that contain minimal annotation. Does not contain extensive analysis.
• CONTRACTOR REPORT. Scientific and technical findings by NASA-sponsored contractors and grantees.
• CONFERENCE PUBLICATION. Collected papers from scientific and technical conferences, symposia, seminars, or other meetings sponsored or co-sponsored by NASA.
• SPECIAL PUBLICATION. Scientific, technical, or historical information from NASA programs, projects, and missions, often concerned with subjects having substantial public interest.
• TECHNICAL TRANSLATION. English-language translations of foreign scientific and technical material pertinent to NASA’s mission.
Specialized services also include organizing and publishing research results, distributing specialized research announcements and feeds, providing help desk and personal search support, and enabling data exchange services. For more information about the NASA STI program, see the following:
• Access the NASA STI program home page at http://www.sti.nasa.gov
• E-mail your question via the Internet to [email protected]
• Fax your question to the NASA STI Help Desk at 443-757-5803
• Phone the NASA STI Help Desk at 443-757-5802
• Write to:
NASA STI Help Desk
NASA Center for AeroSpace Information 7115 Standard Drive
Hanover, MD 21076-1320
NASA/TM—2011–216423
Basis Function Approximation of Transonic
Aerodynamic Influence Coefficient Matrix
Wesley W. Li and Chan-gi Pak
Dryden Flight Research Center, Edwards, California
Insert conference information, if applicable; otherwise delete
Click here: Press F1 key (Windows) or Help key (Mac) for help
National Aeronautics and Space Administration
Dryden Flight Research Center Edwards, CA 93523-0273
Enter acknowledgments here, if applicable.
Click here: Press F1 key (Windows) or Help key (Mac) for help Available from:
NASA Center for AeroSpace Information 7115 Standard Drive
Hanover, MD 21076-1320 443-757-5802
1
Abstract
A technique for approximating the modal aerodynamic influence coefficients matrices by using basis functions has been developed and validated. An application of the resulting approximated modal aerodynamic influence coefficients matrix for a flutter analysis in transonic speed regime has been demonstrated. This methodology can be applied to the unsteady subsonic, transonic, and supersonic aerodynamics. The method requires the unsteady aerodynamics in frequency-domain. The flutter solution can be found by the classic methods, such as rational function approximation, k, p-k, p, root-locus et cetera. The unsteady aeroelastic analysis for design optimization using unsteady transonic aerodynamic approximation is being demonstrated using the ZAERO™ flutter solver (ZONA Technology Incorporated, Scottsdale, Arizona). The technique presented has been shown to offer consistent flutter speed prediction on an aerostructures test wing 2 configuration with negligible loss in precision in transonic speed regime. These results may have practical significance in the analysis of aircraft aeroelastic calculation and could lead to a more efficient design optimization cycle.
Nomenclature
AIC aerodynamic influence coefficients AOA angle of attack
ATW aerostructures test wing BFA basis function approximation CEM central executive module CFD computational fluid dynamics DFRC Dryden Flight Research Center FEM finite element model
FTF flight test fixture
g damping
G(x) constraints function
MDAO multidisciplinary design, analysis, and optimization NASA National Aeronautics and Space Administration TSD transonic small disturbance
i 1, 2, …, m, where m is the number of mode shapes k reduced frequency
m number of mode shapes n number of basis functions
Q modal AIC matrix
Qij i-th row and j-th column element of the modal AIC matrix Q
Q modal AIC matrix basis functions Q approximate modal AIC matrix
Qij i-th row and j-th column of the approximate modal AIC matrix Q
v velocity
XCG center of gravity in X direction
YCG center of gravity in Y direction
ZCG center of gravity in Z direction
βki modal participation factors of the k-th basis function on the i-th mode shape
2
βrj modal participation factors of the r-th basis function on the j-th mode shape
φ structural mode shapes
φi i-th mode shape
Ψ structural mode shapes basis functions
ψk k-th structural mode shapes basis functions
ω frequency
1. Introduction
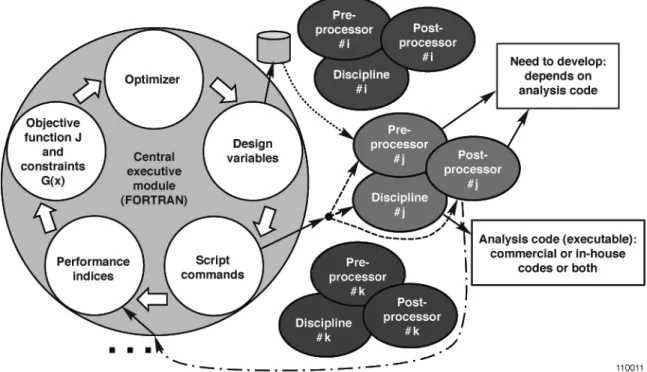
Supporting the Aeronautics Research Mission Directorate guidelines, the National Aeronautics and Space Administration (NASA) Dryden Flight Research Center (DFRC) is developing an object-oriented multidisciplinary design, analysis, and optimization (MDAO) tool (ref. 1). This tool will leverage existing tools and practices, and allow the easy integration and adoption of new state-of-the-art software. At the heart of the object-oriented MDAO tool is the central executive module (CEM) as shown in figure 1. In this module, the user will choose an optimization methodology; provide starting and side constraints for continuous as well as discrete design variables and external file names for performance indices, which communicate between the CEM and each analysis module; submit script commands to prepare input data for each analysis code; execute analyses codes; compute performance indices using post-processor codes; and compute an objective function and constraint values from performance indices. The structural analyses modules such as computations of the structural weight, stress, deflection, buckling, and flutter and divergence speeds have been developed and incorporated into the object-oriented MDAO framework.
Figure 1. Object-oriented multidisciplinary design, analysis, and optimization tool.
With the increased complexity of the configuration and the need to increase the fidelity of the nonlinear aerodynamic equations to be solved in transonic regime, the computational cost of the unsteady aeroelastic analysis required to generate aerodynamic influence coefficients (AIC) matrices for full aeroelastic response and design optimizations is very high (ref. 1). Also, these analyses are usually
3 performed repeatedly to optimize the final design. Even though the computational cost may be reduced by the use of advanced algorithms and improved computer hardware processing speeds, these full aeroelasticity analyses cannot be incorporated effectively within a preliminary design and optimization environment.
The integration of traditional unsteady computational fluid dynamics (CFD) into MDAO involving disciplines such as aeroelasticity and aeroservoelasticity is, at present, a costly and impractical venture (ref. 1). At industry, aircraft designs using nonlinear CFD codes are mainly based on the manual trial and error approach, and this will considerably slow down the whole design procedure. As a result, there is considerable motivation to be able to perform unsteady aeroelastic calculations more quickly and inexpensively. The development of a MDAO tool to automate this process is needed to reduce time required for the early conceptual and/or preliminary design stages.
The results of the rapid computation of a modal AIC matrix and aeroelastic response calculations using an approximated modal AIC matrix based on basis function approximation (BFA) has been previously validated and demonstrated successfully in subsonic speed regime to reduce the computation time. This approach reduces the modal AIC computation time using existing AIC matrices during optimization procedure by 80 percent (ref. 2). This report extends the study and validation of the application of the BFA from the subsonic speed regime to the transonic speed regime.
The transonic speed range introduces some particular flutter problems that are not commonly treated by classic linear flutter theory. Classic coupled torsion and bending wing flutter occurs when, with increase in dynamic pressure, the bending frequency increases, and the torsional frequency decreases until the separation between these two frequencies becomes sufficiently small to allow exchange of energy between the two corresponding modes of the structure. In contrast, for wings with attached flow at transonic speeds, the flutter mechanism is somewhat different. It is very important to determine the location of the shocks, which is known to have fundamental importance on the correct estimation of the unsteady aerodynamic loads, for the transonic flutter prediction. The capture of the shock is impossible using any linear code at transonic speed. The general aeroelastic problem involving the interaction between the aircraft structure and the unsteady transonic flow with the presence of shock waves can only be solved using CFD codes, based on transonic small disturbance (TSD) theory, Euler codes, or the complete Navier-Stokes equations. The order of complexity and computational costs increases from the level of the TSD theory to the Navier-Stokes theory that can accurately predict interactions between boundary layers and local shocks on typical aerodynamic surfaces. In this report, CAP-TSDv (ref. 3) code is used to capture the shock at steady state and flutter prediction.
This report presents the flutter results of the aerostructures test wing (ATW) 2 model without tip boom, in transonic speeds using BFA and traditional methods also called the direct method throughout the rest of the report. The MSC NASTRAN (MSC Software Corporation, Santa Ana, California) (ref. 4), CAP-TSDv, ZAERO ZONA6 linear code, and ZTAIC nonlinear code (ref. 5) (ZONA Technology Incorporated, Scottsdale, Arizona) are used in this study for computing the flutter boundary.
2. Basis Function Approximation
In linear algebra, a basis is a set of vectors that, in a linear combination, can represent every vector in a given vector space or free module, and such that no element of the set can be represented as a linear combination of the others (ref. 6). In other words, a basis is a linearly independent spanning set. Since mode shapes are orthogonal to each other and each mode has a natural frequency associated with the eigenvalue, structural mode shapes obtained from different mass or various stiffness configurations of the airplane can be used as the basis functions. These basis functions are comparison functions (ref. 7) since all the geometric and natural boundary conditions of the airplane are satisfied. The mode shapes of the airplane with any of the configurations in the design spaces can be used to generate the basis functions. Furthermore, each mode shape of the target configuration of the airplane can be approximated as a linear combination of a set of basis functions. This basis function approximation has been described in reference 2.
4
In general, a time-domain approach is more convenient for analysis tasks and nonlinear problems; on the other hand, a frequency-domain approach is better for design tasks and linear problems. Most modern CFD codes were developed using the time-domain approach, and therefore, the results of these CFD runs are usually the time-histories of pressure distributions, structural displacements et cetera. To use the modern CFD computation for our design optimization studies, we are interested in developing an approximate unsteady computational aeroelastic analysis in the frequency-domain to dramatically reduce the required computation time for optimization runs in the transonic speed regime. To accomplish these objectives, the BFA method in reference 2 can be extended and evaluated for approximation in transonic speeds. The BFA method requires the unsteady aerodynamics to be represented in the frequency domain. The flutter solution can be found by classic methods, such as rational function approximation, k, p-k, p, g method, and root-locus et cetera.
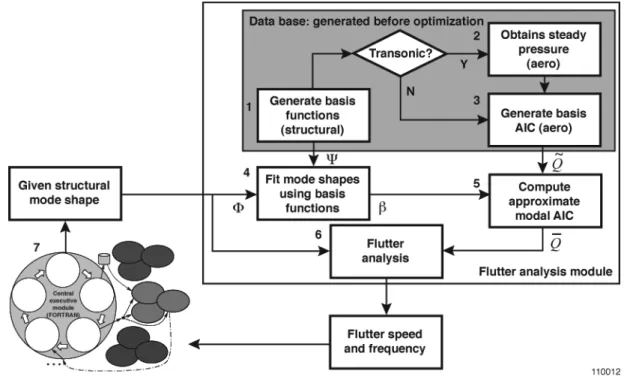
The computation of a modal AIC matrix and aeroelastic response calculations in transonic speeds will be discussed in this report, and the approximation process is outlined in the flowchart given in figure 2.
Figure 2. Flowchart of the flutter analysis module in the object-oriented MDAO tool.
In step 1, a set of representative basis functions, Ψ, is chosen with the intent to capture salient features of the modal responses the airplane is expected to encounter in the various design spaces. In step 2, the steady state pressure distributions for the transonic speed analysis can be obtained by using a CFD code or wind tunnel test.
In step 3, a set of representative basis modal AIC matrices, Q , are computed corresponding to the representative basis functions defined in step 1 and steady pressure distributions obtained in step 2 at any Mach number and reduced frequencies. These basis modal AIC matrices are used as input for approximate modal AIC matrix calculation in step 5. These basis modal AIC matrices are computed only once and stored before starting optimization.
In step 4, during optimization, for a set of given structural mode shapes, φ, each mode shape is decomposed in a linear combination of the basis functions, Ψ. The i-th mode shape, φi, (i=1, 2, …, m,
5 where m is the number of mode shapes) is approximated through the use of a least squares fitting together with the following basis functions as shown in equation (1),
φi ≈ βkiψ k k=1
n
∑
(1)where
ψ
k is the k-th basis function and a coefficient,β
ki, is the modal participation factor of the k-thbasis function on the i-th mode shape and n is the number of basis functions.
In step 5, an approximate modal AIC matrix,
Q
, is computed based on a basis modal AIC matrix,Q
, and modal participation factors in equation (2),Qij ≈Qij= βsiβrjQsr s=1 n
∑
r=1 n∑
(2)where
Q
ij is the i-th row and j-th column element of the modal AIC matrix Q.In step 6, the flutter analysis is performed using the approximate modal AIC matrix in equation (2). The flutter speed and frequency could be used for optimization.
3. Applications
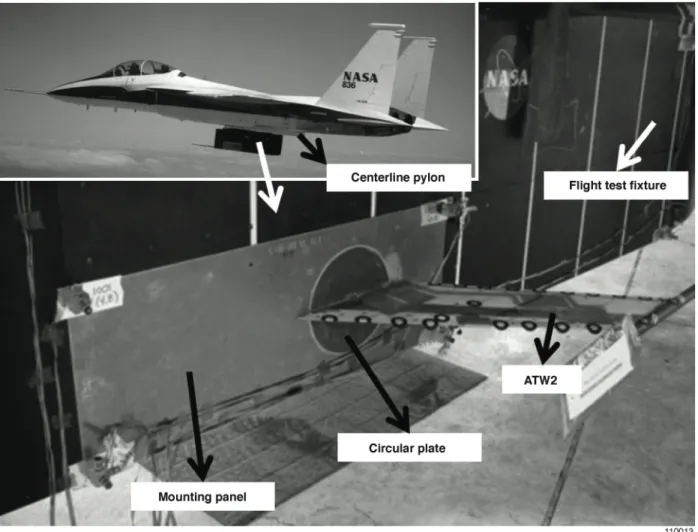
In an effort to validate the BFA in transonic speed, a modified ATW2 model was chosen and the flutter results using approximate method were compared with the direct flutter results for both subsonic and transonic speed. To simplify the problem, especially for CFD mesh generation in CAP-TSDv, the wing tip boom is removed from this application. The original ATW2 (ref. 8) with wing tip boom is the test article actually designed, built, and tested at NASA DFRC as shown in figure 3. The ATW2 was clamped onto a circular plate, which was bolted to a mounting panel. The mounting panel was attached to the flight test fixture (FTF) (ref. 9). The FTF was installed on the centerline F-15B (McDonnell Douglas, now The Boeing Company, Chicago, Illinois) pylon in flight configuration.
6
Figure 3. Aerostructures test wing 2.
For the direct method, the flutter analysis of the target design configuration is performed using the ZAERO linear subsonic method (ZONA6) and nonlinear transonic method (ZTAIC) with the first 10 structural modes and 16 reduced frequencies at 4 Mach numbers (Mach 0.80, 0.90, 0.95, and 0.98). The steady state pressure input data as the initial condition for the ZTAIC method used in the present analysis are obtained by using the CAP-TSDv code at all four Mach numbers. In order to prove the setup and the process of the ZTAIC method correctly, the flutter results from both the ZONA6 and ZTAIC methods are compared and used to verify the process at subsonic Mach numbers. At a subsonic Mach number like Mach 0.80, before any shock is formed, both the linear and nonlinear solver should predict similar flutter results. Once the process was verified, the ZTAIC method was used for the flutter prediction in the transonic speed regime.
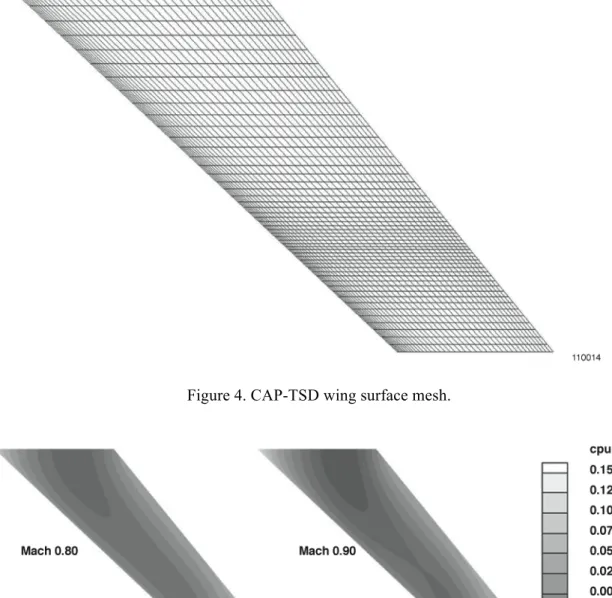
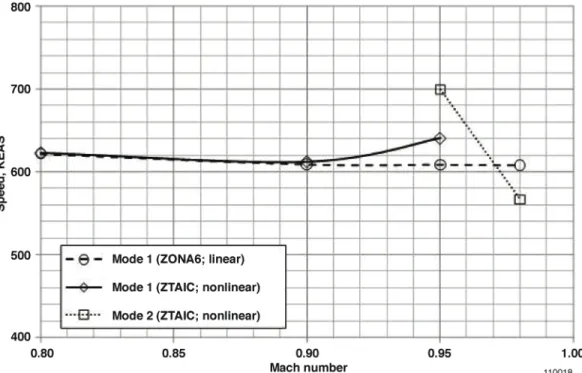
The CAP-TSDv calculations were performed on a 150×80×80 points computational grid with 41 points along each of the 57 spanwise chords on the wing as shown in figure 4. The steady pressure distributions obtained from the CAP-TSDv computations at Mach 0.80, 0.90, 0.95, and 0.98 all at 0.0 deg and 1.0 deg of angle of attack (AOA) are shown in figure 5 and 6; and the steady pressure differences between the upper and the lower surfaces under 1.0 deg AOA at the same Mach numbers are shown in figure 7. With 3-percent structural damping, the primary flutter speed and flutter frequency comparison of the ZONA6 and ZTAIC methods are summarized in figures 8(a) and (b). At the subsonic Mach number of 0.80, the ZTAIC results are in close agreement with those of the ZONA6, as expected, since a transonic shock has not formed yet.
7 Figure 4. CAP-TSD wing surface mesh.
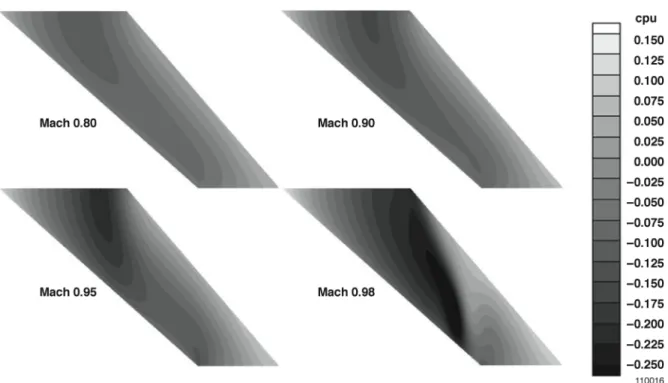
Figure 5. Steady pressure distributions on the upper surface using CAP-TSDv code (0-deg angle of attack).
8
Figure 6. Steady pressure distributions on the upper surface using CAP-TSDv code (1-deg angle of attack).
9 Figure 8a. Flutter speed.
Figure 8b. Flutter frequency.
10
The primary flutter mode is the first bending mode at Mach 0.80. However, the second bending mode becomes the primary flutter mode when the Mach number is 0.98. On the other hand, the flutter mode interchange does not happen with the ZONA6 computation. At Mach 0.98, the primary flutter mode with the ZTAIC computation is the second mode, 81 Hz, as shown in figures 8; while the primary flutter mode with the ZONA6 computation is the first mode, 55 Hz. This mode interchange may be caused by the local high-pressure zone near the center of the wing as shown in figures 5 and 6.
Based on the pressure differences in figure 7, the aerodynamic load distributions at Mach 0.80 and 0.90 are fairly similar in shape, which are basically the subsonic distributions (that is high near the leading-edge area and low near the trailing-edge area). When the Mach number became 0.95, the area of the high aerodynamic loads was extended to the aft section of the wing-root chord, and an even higher load area was formed near the leading edge of the wing mid chord. At Mach 0.98, aerodynamic load distributions are changed drastically, and compared to the Mach 0.95 case, highly concentrated aerodynamic load distributions are observed from the leading edge of the wing tip chord to the trailing edge of the wing root chord. From these observations, we may conclude that the transonic effects start to happen between Mach numbers of 0.90 and 0.95, and strong shocks are formed at Mach 0.98 as shown in figures 5 and 7. Probably the second bending mode in figure 9 can be easily excited by the concentrated aerodynamic load distributions at Mach 0.98.
Figure 9. V-g and V-ω plots for the ATW2 at Mach 0.98 using ZONA6 and ZTAIC methods. In this ATW2 example, five different design configuration points in the parameter design space are selected for generating basis functions for the approximate flutter solution. The design variations used in this study are variations in wing thickness and stiffness that are effected by variations in the number and orientation of the composite laminate plies. These design variations are intended to capture salient features of the modal responses resulting from mass and stiffness variations in the design space. The
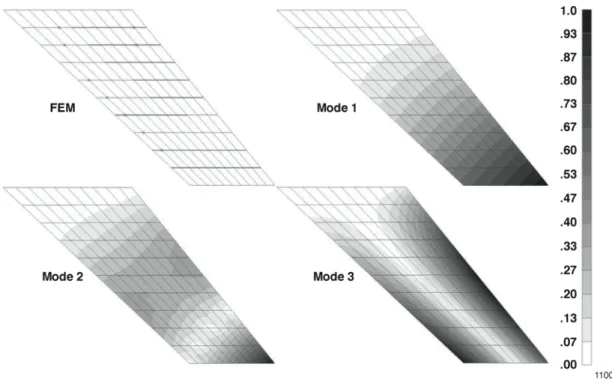
11 structural mode shapes obtained from those five design configurations are used as the basis functions. The finite element model and the first three mode shapes of the target configuration are shown in figure 10. The total weight and center of gravity of the various fictitious and target design configurations are listed in table 1. The target configuration in this report is simply an arbitrary design point within the design space and is used as a check case.
Figure 10. The aerostructures test wing 2 without tip boom mode shapes.
Table 1. Summary of total weight and center of gravity location for the ATW2 without the tip boom model with different fictitious design configurations.
Fictitious configuration Config. 1 Config. 2 Target Config. 3 Config. 4 Config. 5
Total weight, lb 2.38 2.53 2.81 2.88 3.66 4.09
XCG, in 12.56 12.70 12.93 12.98 13.41 13.58
YCG, in -7.17 -7.24 -7.35 -7.38 -7.59 -7.67
ZCG, in -3.12 -2.95 -2.66 -2.59 -2.05 -1.85
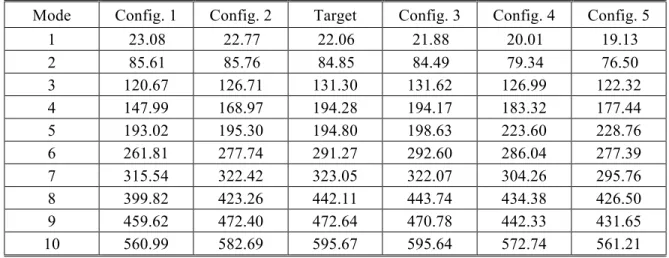
First, 10 structural mode shapes for each design configuration (a total of 50 basis functions) are generated using MSC/NASTRAN. The natural frequencies of the various fictitious and target design configurations are listed in table 2. Next, the size of 50 by 50 basis modal AIC matrix corresponding to those 50 basis functions is computed for each of the 16 reduced frequencies at Mach 0.80, 0.90, 0.95, and 0.98 using ZONA6 and ZTAIC. To solve the modal participation factors, the mode shapes of the target design configuration are fitted using the basis functions with a least squares method. Then the approximate modal AIC matrices are computed based on the modal participation factors. Finally, the approximate flutter boundaries can be solved by using any linear frequency domain flutter solution code and the approximated modal AIC matrices. It is important to point out that in order to provide meaningful comparisons of the direct method with the BFA method, the ZTAIC method is used to predict the flutter boundaries in this report. Given that the BFA approach can be used with any kind of CFD code, ZTAIC is
12
selected for CFD simulation in this report due to limited resources. The focus in this report is to demonstrate that the BFA method can be used to predict adequate flutter speed and flutter frequency at transonic speed regime regardless the level of CFD code.
Table 2. Summary of natural frequencies (Hz) of the ATW2 without the tip boom model with different design configurations.
Mode Config. 1 Config. 2 Target Config. 3 Config. 4 Config. 5
1 23.08 22.77 22.06 21.88 20.01 19.13 2 85.61 85.76 84.85 84.49 79.34 76.50 3 120.67 126.71 131.30 131.62 126.99 122.32 4 147.99 168.97 194.28 194.17 183.32 177.44 5 193.02 195.30 194.80 198.63 223.60 228.76 6 261.81 277.74 291.27 292.60 286.04 277.39 7 315.54 322.42 323.05 322.07 304.26 295.76 8 399.82 423.26 442.11 443.74 434.38 426.50 9 459.62 472.40 472.64 470.78 442.33 431.65 10 560.99 582.69 595.67 595.64 572.74 561.21
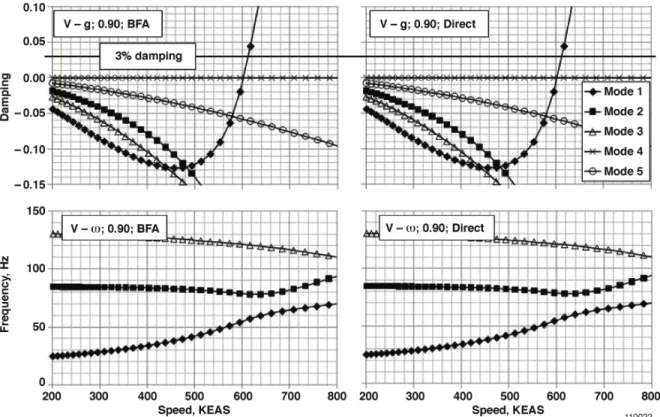
As shown in table 3, using ZTAIC, both methods predicted similar flutter speed and flutter frequency at Mach 0.80, 0.90, 0.95, and 0.98. The speed versus damping, V-g, and speed versus frequency, V-ω, curves from the direct and BFA methods at Mach 0.90, 0.95, and 0.98 are given in figures 11, 12, and 13. These figures indicate that an interchange between the first bending and the second bending flutter modes results when Mach number increased from 0.90 to 0.98. At Mach 0.90, the first bending mode, 56 Hz, is predicted as the primary flutter mode. This flutter mode became the hump mode at Mach 0.95 and stable mode at Mach 0.98. Meanwhile, the stable second mode at Mach 0.90 became unstable at Mach 0.95 and later became primary flutter mode at Mach 0.98. With 3-percent structural damping, the primary flutter speed and flutter frequency are summarized in table 3, and figures 14(a) and (b). The largest percentage error of flutter speed and frequency is 1.60 percent at Mach 0.98 and 1.27 percent at Mach 0.80 respectively. Although a different CFD code may generate different unsteady AIC and predict different flutter results, the important point is that the results of the BFA method is following the one predicted by the direct method. Overall, the resulting flutter boundaries prediction using the BFA method is well compared with the direct method in transonic speed. The flutter boundaries prediction based on the BFA method is essentially identical to those using direct solution on the target design configuration.
Table 3. Summary of the ATW2 without the tip boom model flutter results comparison for BFA and the direct method using ZTAIC.
Flutter speed, KEAS Flutter frequency, Hz Mach
BFA Direct Error BFA Direct Error
0.80 621.77 622.94 -0.19% 59.85 60.62 -1.27%
0.90 612.39 612.38 0.00% 56.56 56.56 0.00%
0.95 641.94 640.68 0.20% 53.63 54.01 -0.70%
13 Figure 11. V-g and V-ω plots for the ATW2 at Mach 0.90 using direct ZTAIC and BFA ZTAIC methods.
14
15 Figure 14a. Flutter speed.
Figure 14b. Flutter frequency.
16
Table 4 lists the computational cost of computing the modal AIC matrices with given structural mode shapes at one Mach number and 16 reduced frequencies using the direct method and the BFA method. The size of the ATW2 model is about 260 degrees of freedom. The computational cost of generating the modal AIC using the direct method and the BFA method is about 43 s and 8 s using ZONA6, and 49 s and 8 s using ZTAIC respectively in this ATW2 example. As a result, the BFA approach reduces the modal AIC computation time using existing AIC matrices by 80 percent. The comparison was done on an Intel® Core™2 2.80GHz CPU computer (Intel Corporation, Santa Clara, California). The computational cost of generating the basis functions before the parametric study is not included in the comparison.
Table 4. Computational cost comparison of BFA and the direct method.
ZONA6 ZTAIC
Direct method elapsed time 43 s 49 s
BFA method elapsed time 8 s 8 s
4. Concluding Remarks
Many of the most interesting engineering applications are very complex systems, such as aeroelastic analyses and optimization in which the analysis is achieved through the use of expensive and time consuming numerical simulations. The processing times on even the most powerful workstations may be too expensive. A technique for approximating the modal AIC matrix by using basis function approximation has been applied in transonic speed regime, and a process for using the resulting AIC matrix in aeroelastic analyses has been developed and demonstrated. The technique presented has been shown to offer consistent flutter speed prediction on an ATW2 configuration with insignificant small loss in accuracy, less than 1.6-percent error in the ATW2 test case, and the results are essentially identical to those using direct solution. The BFA approach has been demonstrated successfully in the transonic speed regime to reduce the computation time of generating modal AIC using basis functions. The BFA approach has shown an 80-percent reduction in the modal AIC computation time using existing AIC matrices. These results may have practical significance in the aeroelastic analysis of an aircraft and could lead to a more efficient design optimization cycle in a transonic speed regime. For the design optimization and parameter study, hundreds or even thousands of analyses have to be performed. Creation of an approximated modal AIC matrix using basis functions allows for analysis, and a parameter optimization cycle of the system in minutes, rather than hours of computer time on common personal computers.
17
References
1. Pak, Chan-gi, and Wesley Li, “Multidisciplinary Design, Analysis and Optimization Tool Development Using a Genetic Algorithm,” Proceedings of the 26th Congress of International Council of the Aeronautical Science, Anchorage, Alaska, September 14–18, 2008.
2. Pak, Chan-gi, and Wesley W. Li, “Application of Approximate Unsteady Aerodynamics for Flutter Analysis,” AIAA–2010–3085, Proceedings of the 51st AIAA Structures, Structural Dynamics, and Materials Conference, Orlando, Florida, April 12–15, 2010.
3. Batina, John T., David A. Seidel, Robert M. Bennett, and Samuel R. Bland, Preliminary User’s Manual for CAP–TSD (version 1.0), 1988.
4. MSC/NASTRAN Quick Reference Guide Version 69, The MacNeal Schwendler Corporation, 1996. 5. ZAERO Theoretical Manual Version 8.3, ZONA Technology, Inc., 2007.
6. Kahaner, David, Cleve Moler, and Stephen Nash, Numerical Methods and Software, Prentice–Hall, Englewood Cliffs, New Jersey, 1989.
7. Meirovitch, Leonard, Analytical Methods in Vibrations, The Macmillan Company, New York, 1967. 8. Lung, Shun-fat, and Chan-gi Pak, “Updating the Finite Element Model of the Aerostructures Test
Wing Using Ground Vibration Test Data,” AIAA–2009–2528, Proceedings of the 50th AIAA/ASME/ASCE/AHS/ASC Structures, Structural Dynamics, and Materials Conference, Palm Springs, California, May 4-7, 2009.
9. Richwine, David M., “F–15B/Flight Test Fixture II: A Test Bed for Flight Research,” NASA–TM– 4782, 1996.
REPORT DOCUMENTATION PAGE OMB No. 0704-0188Form Approved
1. REPORT DATE (DD-MM-YYYY) 01-03-2011
2. REPORT TYPE Technical Memorandum 4. TITLE AND SUBTITLE
Basis Function Approxmiation of Transonic Aerodynamic Influence Coefficient Matrix
5a. CONTRACT NUMBER
6. AUTHOR(S)
Li, Wesley W. and Pak, Chan-gi
7. PERFORMING ORGANIZATION NAME(S) AND ADDRESS(ES) NASA Dryden Flight Research Center
P.O. Box 273
Edwards, California 93523-0273
9. SPONSORING/MONITORING AGENCY NAME(S) AND ADDRESS(ES) National Aeronautics and Space Administration
Washington, DC 20546-0001 8. PERFORMING ORGANIZATION REPORT NUMBER H-3082 10. SPONSORING/MONITOR'S ACRONYM(S) NASA 13. SUPPLEMENTARY NOTES
Li and Pak, NASA Dryden Flight Research Center. Also presented as meeting paper 072 at the 27th Congress of the International Council of the Aeronautical Sciences, Nice, France, September 19-24, 2010.
12. DISTRIBUTION/AVAILABILITY STATEMENT Unclassified -- Unlimited
Subject Category 01 Availability: NASA CASI 443-757-5802 Distribution: Standard
19b. NAME OF RESPONSIBLE PERSON STI Help Desk (email: [email protected]) 14. ABSTRACT
A technique for approximating the modal aerodynamic influence coefficients matrices by using basis functions has been developed and validated. An application of the resulting approximated modal aerodynamic influence coefficients matrix for a flutter analysis in transonic speed regime has been demonstrated. This methodology can be applied to the unsteady subsonic, transonic, and supersonic aerodynamics. The method requires the unsteady aerodynamics in frequency-domain. The flutter solution can be found by the classic methods, such as rational function approximation, k, p-k, p, root-locus et cetera. The unsteady aeroelastic analysis for design optimization using unsteady transonic aerodynamic approxmination is being demonstrated using the ZAERO flutter solver (ZONA Technology Incorporated, Scottsdale, Arizona). The technique presented has been shown to offer consistent flutter speed prediction on an aerostructures test wing 2 configuration with negligible loss in precision in transonic speed regime. These results may have practical significance in the analysis of aircraft aeroelastic calculation and could lead to a more efficient design optimization cycle. 15. SUBJECT TERMS
Aerodynamic influence coefficient matrix, Basis function approximation, Flutter analysis, Least squares method, Multidisciplinary design optimization
18. NUMBER OF PAGES
22
19b. TELEPHONE NUMBER (Include area code) (443) 757-5802 a. REPORT U c. THIS PAGE U b. ABSTRACT U 17. LIMITATION OF ABSTRACT UU
Prescribed by ANSI Std. Z39-18Standard Form 298 (Rev. 8-98)
3. DATES COVERED (From - To)
5b. GRANT NUMBER
5c. PROGRAM ELEMENT NUMBER
5d. PROJECT NUMBER
5e. TASK NUMBER
5f. WORK UNIT NUMBER
11. SPONSORING/MONITORING REPORT NUMBER
NASA/TM-2011-216423
16. SECURITY CLASSIFICATION OF:
The public reporting burden for this collection of information is estimated to average 1 hour per response, including the time for reviewing instructions, searching existing data sources, gathering and maintaining the data needed, and completing and reviewing the collection of information. Send comments regarding this burden estimate or any other aspect of this collection of information, including suggestions for reducing this burden, to Department of Defense, Washington Headquarters Services, Directorate for Information Operations and Reports (0704-0188), 1215 Jefferson Davis Highway, Suite 1204, Arlington, VA 22202-4302. Respondents should be aware that notwithstanding any other provision of law, no person shall be subject to any penalty for failing to comply with a collection of information if it does not display a currently valid OMB control number.