Developing Data Quality Metrics
for a Product Master Data Model
THESIS
submitted in partial fulfillment of
the requirements for the degree of
MASTER OF SCIENCE
in
COMPUTER SCIENCE
TRACK INFORMATION ARCHITECTURE
by
Marhendra Lidiansa
4256360
Web Information Systems Research Group Faculty EECMS, Delft University of Technology Delft, The Netherlands
www.ewi.tudelft.nl
Elsevier B.V. Strategy, Global Operations Amsterdam, The Netherlands www.elsevier.com
b
Contents
List of Tables ... e List of Figures ... f Executive Summary ... g Acknowledgments ... i 1 Introduction ... 1 1.1 Background ... 1 1.2 Problems ... 11.3 Focus and Demarcation ... 1
1.4 Research Goal and Questions ... 2
1.5 Research Approach ... 3
1.6 Structure of the Thesis ... 6
2 Project Environment ... 7
2.1 Elsevier ... 7
2.2 Resource... 7
3 Conceptualization ... 9
3.1 Related Studies ... 9
3.1.1 Data Quality Methodology ... 9
3.1.2 Data Quality Metrics Requirements... 12
3.1.3 Data Quality Metrics Integration ... 13
3.1.4 Data Quality Dimensions ... 15
3.1.5 Data Quality Measurements ... 15
3.1.6 Types of Data Model in MDM ... 17
3.1.7 Methodologies Comparison and Relationship with the Studies ... 18
3.2 General Process Framework ... 21
3.2.1 Goal ... 21
3.2.2 Metamodel for the method ... 21
3.2.3 Process Model ... 22
4 Empirical Evaluation in Elsevier ... 25
c
4.2 Phase I. Identification ... 26
4.2.1 Identify Business Process and Process Metrics ... 27
4.2.2 Identify IT Systems ... 29
4.2.3 Identify Business Problems and Data Defects ... 30
4.2.4 Overall Process Model and Metamodel... 32
4.3 Phase II. Define/Specify ... 33
4.3.1 Specify Requirement for DQ Metrics ... 33
4.3.2 Specify Data Quality Metrics ... 34
4.3.3 Overall Process Model and Metamodel... 36
4.4 Phase III. Verify ... 37
4.4.1 Develop Criteria for Requirements ... 37
4.4.2 Verify Requirement Fulfillment... 38
4.4.3 Overall Process Model and Metamodel... 41
4.5 Phase IV. Data Quality Metrics Integration... 42
4.5.1 Pre-integration ... 42
4.5.2 Comparison of the Schemas ... 42
4.5.3 Conforming and Merging the Schemas... 42
4.5.4 Overall Process Model and Metamodel... 42
5 Conclusion ... 45
5.1 Lessons ... 45
5.1.1 Contributing Factors for Alternate Process Model ... 45
5.1.2 Critical Success Factors in the Process Model ... 45
5.1.3 Quality of the Process Model ... 46
5.1.4 Data Quality Process and Master Data Identification in Elsevier ... 47
5.2 Thesis Contribution ... 48
5.3 Research Questions ... 49
5.4 Main Research Goal ... 50
5.5 Reflection and Future Works ... 50
Appendix 1 Data Quality Process ... i
Appendix 2 Data Quality Dimensions ... ii
Appendix 3 Data Quality Measurements ... iv
d
Appendix 5 Requirement for Data Quality Metrics ... ix
Appendix 6 eCommerce Metrics ... xii
Appendix 7 Phase I: Business Problems and Poor Data in Elsevier eCommerce ...xiii
Appendix 8 Data Quality Metrics Attributes ... xiv
Appendix 9 Measurement Methods for eCommerce ... xvi
Appendix 10 Initial Metrics Specification for each DQ Dimension for Elsevier ... xix
Appendix 11 Data Quality Metrics Specification for eCommerce ... xxv
Appendix 12 Data Quality Metrics Assessment on eCommerce Database for Phase III ... xxx
Appendix 13 Phase IV: Data Quality Metrics Integration... xxxi
e
List of Tables
Table 1 Summary of DQ Measurement, Sebastian-Coleman [23] ... 17
Table 2 DQ Methodologies ... 19
Table 3 Metamodel component description, Otto et al. [19] ... 21
Table 4 DQ Dimension Mapping ... 26
Table 5 Selected Metrics for E-commerce, Tsai et al. [26] ... 29
Table 6 Business Problems – E-commerce KPI Mapping ... 31
Table 7 E-commerce Performance Assessment ... 31
Table 8 DQ Metrics Requirements ... 34
Table 9 An Example of DQ Metrics in Phase I ... 35
Table 10 An example of DQ Metrics in Phase II ... 36
Table 11 DQ Metrics Requirements Criteria ... 37
Table 12 DQ Metrics Assessment Result Summary ... 39
Table 13 DQ Metrics Assessment Result ... 40
Table 14 Process - Information Matrix, Otto et al. [19] ... i
Table 15 Data Quality Dimension, Sebastian-Coleman [23] ... ii
Table 16 Data Quality Dimension, Morbey [17] ... ii
Table 17 Data Quality Dimensions by Batini et al. [2] ... iii
Table 18 Data Quality Dimensions by Zang ... iii
Table 19 Data Quality Measurements by Batini et al. [3] ... iv
Table 20 Examples of Data Quality Measurements, Sebastian-Coleman [23] ... v
Table 21 Causal Relation: Business Problem and Data Defect ... vii
Table 22 Preventive and Reactive Measures ... viii
Table 23 DQ Metrics Requirements, DAMA ... ix
Table 24 DQ Metric Requirements, Heinrich [11] ... ix
Table 25 Characteristics of Effective Measurement, Sebastian-Coleman [23] ... ix
Table 26 DQ Metrics Requirements, Huner [12] ... x
Table 27 Data Quality Requirements, Loshin [15] ... x
Table 28 eCommerce KPI, Tsai et al. [26]... xii
Table 29 Simple Assessment Result on Marketing Data ...xiii
Table 30 Data Quality Metrics Attributes, Huner [12] ... xiv
Table 31 Data Quality Metrics Attributes, Sebastian-Coleman [23] ... xiv
Table 32 Developed DQ Metrics Attributes, Hüner et al. [12] and Sebastian-Coleman [23] ... xv
Table 33 Data Quality Measurement Definition ... xvi
Table 34 Metrics Specification for Business Problems ... xxv
f
List of Figures
Figure 1 Research Approach ... 3
Figure 2 E-commerce in Elsevier ... 7
Figure 3 TIQM Process, English ... 10
Figure 4 DQ-P Activities, Morbey [17] ... 10
Figure 5 Entities and Relations of a Business-Oriented Data Quality Metric, Otto et al. [19] ... 11
Figure 6 Process Model for DQ Metrics Identification, Otto et al. [19] ... 12
Figure 7 Data Model with Quality (Attribute Level), Wang et al. [29] ... 13
Figure 8 Steps of Identifying Quality Attributes, Wang et al. [29] ... 14
Figure 9 MDM Data Exchange, Loshin [14] ... 17
Figure 10 Data Model for MDM ... 18
Figure 11 Literature Studies ... 20
Figure 12 Metamodel for the Method, Otto et al. [19] ... 22
Figure 13 Schema Integration, Batini et al. [4] ... 24
Figure 14 DQ Metrics Development Process for MDM ... 25
Figure 15 Business Processes and Product Entity Repository ... 26
Figure 16 E-commerce Use Case ... 27
Figure 17 BSC Framework ... 28
Figure 18 BSC Component Relationship, Perlman [20] ... 28
Figure 19 E-commerce System Context Diagram ... 29
Figure 20 Journal Data Model in E-store Website ... 30
Figure 21 Book Data Model in E-store Website ... 30
Figure 22 Information Quality and E-commerce, Molla and Licker [16], Flanagin et al. [7], Clavis ... 31
Figure 23 Phase I. Identification Process Model ... 32
Figure 24 Metrics Relationships ... 35
Figure 25 Phase II. Define/Specify Process Model ... 36
Figure 26 DQ Metrics Score ... 40
Figure 27 An alternative for Phase III. Verify Process Model... 41
g
Executive Summary
Master data management (MDM) is implemented to increase the quality of core business data by having a single managed repository. Like any other IT projects, there are failures in the implementation of MDM. Several main causes of failures in MDM implementation are related to a missing data quality process, for example, a lack of proactive data quality surveillance (Sivola et al. [24]) and a lack of data quality measurements (Haug [10]). An important phase in the data quality process is the measurement phase that exercises the data quality metrics. In accordance with Elsevier’s plan to implement product master data, the main objective of this study is to identify, collect, analyze, and evaluate the quality metrics for a product master data; to allow quantifying and improve their value.
In order to meet the main objective, this study needs to address these three questions: (1) What is the type of methodology that should be used to develop business-oriented data quality metrics? (2) How appropriate is the methodology for a practical case? (3) What are the data quality metric specifications for a case study in Elsevier? There are four phases in this thesis work to develop and answer those questions. In the first phase, the introduction phase, the main objective and research questions are formulated with several considerations, particularly the scientific and practical benefit of the study, and the boundaries of the projects.
In the second phase, the conceptualization, we need to select or construct the general process framework (GPF) to develop business-oriented data quality metrics as the answer to the first question. This study selects methodology developed by Otto [19] as the GPF to develop the data quality metrics. The selection process is conducted by comparing the methodology with other methodologies—like AIMQ, TIQM, DQ-P, and ORME-DQ—on several features, for example, the process model, metamodel, business needs consideration in its data quality criteria, and the focus of the method. Other studies in data quality (DQ) requirements, DQ metrics specification, DQ metrics requirements integration, data modelling, and process modelling are also used to ensure that the process model and metamodel in the selected GPF are adjustable for the case study.
The background of this thesis is related to the MDM system which function is to provide numerous enterprise applications with high quality critical business objects. Thus, we need to make sure that the developed data quality metrics meet the requirements of several business applications (Loshin [14]). This thesis uses the process model developed by Wang et al. [29] and Batini et al. [4] as the GPF to integrate data quality metrics from several applications into the product MDM repository. The activities include developing the appropriate data models, making the schemas conformed, and conflict resolution using qualitative criteria—completeness and correctness, minimality, and understandability. The result is a list of feasible data quality metrics that meet the needs of several applications
Here the thesis work uses the GPF as the first version of the developed solution to address the main objective. The main processes in the GPF are identifying the business problems and data defects, specifying the data quality requirement and metrics, verification of the result, and integrating the data quality metrics.
The thesis work addresses the third phase, the validation, by executing the
GPF
for a case study in Elsevier. Each process is adjusted with the case and analyzed for the required alterations. The activitiesh in this process consist of literature study and workshop/interview with the domain experts. The result of this activity is the altered GPF as the developed solution to address the main goal. The changes consist of an alternate configuration for the process model and the tangible objects for the components in the metamodel, for example, interview questionnaires, data quality requirements, data quality attributes, business problems–data defects matrix, and the data quality metrics. These results are used in formulating the answers to the second question. This thesis also conducts the testing activity by assessing the developed metrics with the criteria in the data quality metrics requirements.
The developed and filtered data quality metrics are feasible for the study case in Elsevier and include several data quality dimensions, namely completeness, syntactical correctness, absence of repetition, absence of contradiction, and accuracy. Those data quality metrics are the answers for the third question.
This thesis addresses its main objective by having two main results, namely a list of data quality metrics for eCommerce and product MDM system in Elsevier, and a process model to develop data quality metrics for a product MDM. The process model is developed on the basis of the works by Otto [19], Wang et al. [29] and Batini et al. [4], and considered practical, valid, complete, and resilience. This study also provides several lessons, for example, the critical success factors for each phase in the process model, recommendations for data quality process in Elsevier, and updates for product MDM data model. Furthermore, studies on the same issue with several other data/process domains are needed to get other possible configurations of the process model.
Thesis Committee:
Chair : Prof. Dr. Ir. G. J. P. M. Houben, Faculty EEMCS, Delft University of Technology Supervisor : Dr. M. V. Dignum, Faculty TBM, Delft University of Technology
i
Acknowledgments
This document has been produced for the master thesis project as part of the Master of Science program in Information Architecture at TU Delft. The thesis work took place at Elsevier in Amsterdam from October 2013 until April 2014.
This thesis has been completed with the guidance, assistance, and support a number of people that I would like to thank.
First of all, my thesis supervisor at TU Delft, Dr. M. V. Dignum, with whom I’ve always discussed the thesis methodology, the thesis progress, the theoretical contents, and the practical approaches. Professor Dr. Ir. G. J. P. M. Houben, my professor, who provided necessary and critical comments at the initial phase of the project and during the midterm presentation. His inputs were important to develop the thesis goal and to make sure that the work was in the right direction.
My supervisors at Elsevier, Olga Tchivikova and James Carne, who were very open toward my thesis work and provided an association to their internal project. They also arranged all the resources I needed to complete my work and made sure other personnel provided the information I required. I would also like to thank the personnel in Elsevier for answering my countless questions, providing me with much-needed information and inputs, and helping me to develop the data quality metrics. Those people are the domain experts at Elsevier in e-commerce, marketing, book and journal data, data quality, IT operation, and IT infrastructure.
Elsevier provided a stimulating working environment, and it also has interesting problems closely related with the information architecture track, for example, data and text analytics, information retrieval, and recommender systems. I can recommend to anyone who is interested to conduct a thesis work at Elsevier.
1 [51]
1
Introduction
1.1 Background
Master data management (MDM) is a collection of the best data management practices that orchestrate key stakeholders, participants, and business clients in incorporating business applications, information management methods, and data management tools to implement policies, procedures, services, and infrastructures to support the capture, integration, and subsequent shared use of accurate, timely, consistent, and complete master data (Loshin [14]). According to DAMA International (DAMA [5]), the MDM has three goals: providing an authoritative source of high-quality master data (“golden record”), lowering cost and complexity through standards, and supporting business intelligence and information integration.
The importance of implementing MDM is gaining more prominence in companies. The Information Difference1 reported that MDM projects are growing around 24% in 2012 (USD1.08 billion in the software market). This figure was also predicted by Gartner in 2011.
1.2 Problems
Companies incur cost when cleaning and ensuring high-quality master data (direct) and from faulty managerial decision making (indirect) caused by poor-quality master data (Haug [10]). The process failure costs due to bad-quality data comes from information scrap and reworking costs to improve the data quality (English [7]). Another cost caused by bad-quality data is missed opportunity costs.
While MDM is expected to lower those costs, the implementation of MDM could still provide master data with low data quality. Some barriers in achieving high-quality master data are lacking data quality measurements and lacking clear roles in the data life-cycle process (Haug [10]). The preconditions for a company in implementing MDM to answer the challenge of poor-quality data are (Sivola et al. [24]) a common definition of the data model to be used across the organization (data model), a proactive data quality surveillance (data quality), and a unified data model (information system).
Thus, data quality management is an important concern in MDM to provide high-quality master data (Loshin [14]), and the inclusion of data quality assessment and improvement activities is a key success factor to have a successful MDM project.
1.3 Focus and Demarcation
Data quality and MDM are broad subjects to study. There are several concerns that should be addressed in implementing an MDM, for example, stakeholders and participants' involvement, metadata management, architecture styles, functional services, data governance, data modeling, data consolidation and integration, management guidance, data quality management, master data identification, and master data synchronization (Batini et al. [4]; Loshin [14]). There are also several data domains in MDM, for example, customer, product, supplier, material, and asset (Otto [18]), where each can serve several business processes in an organization.
1
2 [51] The phases within the data quality assessment and improvement activities (Batini et al. [3]) that can also be used within an MDM are the following:
i. State Reconstruction
The aim of this phase is to get information about business processes and services, data collection, quality issues, and corresponding costs.
ii. Assessment/Measurement
The aim of this phase is to measure the quality of data collection along relevant quality dimensions. The results from the measurement activity are further compared with certain reference values to determine the state of quality and to assess the causes of poor data. Defining the qualities, dimensions, and metrics to assess data is a critical activity.
iii. Improvement
The aim of this phase is to select the steps, strategies, and techniques that meet the new data quality targets.
To limit the scope, in order to achieve a good and reasonable goal within a limited given time and resource, this thesis will focus on these parts:
i. Data Quality Phase
The first phase, state reconstruction, is considered optional, and some methodologies only use existing documentation to develop information of the business process and information system (Batini et al. [3]). The data quality metrics and dimensions are important entities in the second phase of data quality improvement methods. Those entities are discussed in all 13 methods assessed by Batini et al. [3]. The improvement phase is found in 9 of 13 methods, and it covers 10 activities. The third phase is considered more extensive than the second phase because it also covers the business process (e.g., process redesign) and organizational aspects (e.g., assignment of data stewardship responsibilities and data quality improvement management).
Thus, this study will focus on the assessment/measurement phases, especially on the development of qualities, dimensions, and metrics. Another reason is because the assessment phase result determines the courses of action in the improvement phase.
ii. Data Domain
Dreibelbis et al. [6] classify the master data domain into three categories, namely party, product, and account. Most of the MDM software products serve the customer (party) and the product domains for the same reasons, for example, those entities are important for the business, and those entities are used to identify them from their competitors. Elsevier has developed a customer (party) MDM, and it is initiating the product MDM implementation.
This study will focus on product data so the results can be used as design artifacts for the product MDM implementation, particularly in Elsevier.
1.4 Research Goal and Questions
The main research goal of this study is to identify, collect, analyze, and evaluate the quality metrics for a product master data; to allow quantifying and improve their value. The identification of data quality metrics should be for the ones that provide business impacts for the organization. This requirement is relevant for an MDM system, a repository for important business objects. According to
3 [51] English [6], pragmatic information quality is the value that accurate data has in supporting the work of the enterprise i.e., data that does not help enable the enterprise accomplish its mission has no quality.
In order to address the main objective, several research questions are constructed, which are as follows:
i. What is the type of methodology that should be used to develop business-oriented data quality metrics?
Strategy: Study the literatures on several data quality assessment and improvement methods. Analyze the main goal, the process model, and the metamodel defined in each study.
Objective: Select an appropriate metamodel/process model that best fits the main research goal. The selected metamodel/process model will be the base reference for the thesis work’s activity.
ii. How appropriate is the methodology for a practical case? What processes or components should be altered?
Strategy: Conduct the activities to identify, collect, analyze, and evaluate the quality metrics for a product data in the Elsevier environment using the selected metamodel/process model. Analyze the process, result, and findings to assess the compatibility of the methodology with the study case in Elsevier.
Objective: This is a theory-testing strategy, and its aim is to improve or adjust the selected metamodel/process model on the basis of the findings (if any) to fill in the missing factors that were not determined within the scientific area of this topic (Vershcuren [27]).
iii. What are the data quality metrics specifications for a study case in Elsevier?
Strategy: Conduct the activities to identify, collect, analyze, and evaluate the quality metrics for a product data in the Elsevier environment using the selected metamodel/process model. Assess the acceptability of each metrics for each requirement; for example, conduct a data quality and performance assessment for each metrics in the data repository to assess its feasibility.
Objective: Provide a list of relevant and acceptable DQ metrics for the case study in Elsevier. 1.5 Research Approach
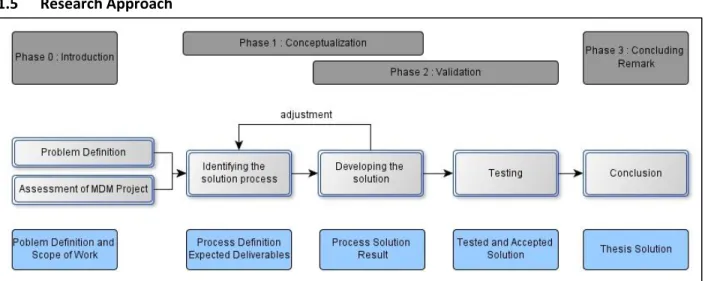
4 [51] This study will have several activities in Figure 1 to answer the research goal. The research is composed of four main phases, namely the introduction, conceptualization, validation, and concluding remarks. The descriptions of the activities within those phases are as follows:
i. Problem Definition and Assessment of the Product MDM Project
The activities within this phase have a goal to define a specific problem in the MDM implementation, the scope of the thesis work, the goal for the thesis. The activities consist of literature study of the MDM and data quality in general to understand the components and critical information needed in the MDM project. That information is used to assess the product MDM project in Elsevier, which was conducted in March–August 2013, in order to identify this information: the goal of the project and the activities that have been conducted, the critical components that are expected to develop but have not been delivered, and the schedule for the project plan.
Important results of this activity are the research goal in section 1.4, the cases in Elsevier that are relevant to the thesis goal and the deliverables of the study.
The results of the assessment are
a. The results of his thesis, —that is, the data quality metrics and the process model—, could be used in the Elsevier’s MDM project.
b. There are two cases that will be used in this thesis work:
Elsevier e-commerce
This case is selected because e-commerce is one of the main product data consumers and its end customers are the web users who buy the book or journal. The web users use product information for their buying decisions. The data quality specification for the product data should be developed to be useful and usable for the information consumers (Lee [13]) and consistently meet customers’ expectations (English [7]).
Elsevier Customer System (CS)
This case is selected because this system provides the books and journals metadata for a system in Elsevier that also functions as an e-commerce. The customers use the metadata provided by this system to purchase a book or a journal.
c. To align with Elsevier project, this thesis selects product master data for the master data object with a specific domain in book and journal data.
ii. Identifying the Solution Process
There are two main activities in this phase, which main strategy is using available literature studies. First, this thesis selects the study that provides a process model and metamodel to address the main objective. Second, this thesis studies other studies to enrich the components in the selected metamodel.
a. Literature study to define the general process framework (GPF)
A study on several methodologies to develop data quality metrics that consider the business impacts of having poor data quality is conducted to select one as the base process framework. This activity is needed to provide a structured and proven method for the research and conducted before developing the solution for a study case in Elsevier.
5 [51] The selected general framework could also provide tangible objects for each component that will be used within its activities, for example, the definition of data quality and the metrics. This study will consider other studies results to provide options for the activities and selected components for these reasons:
There could be more updated studies on the components from other studies that can be attached in the process framework.
To be more flexible in developing the solution for the case studies in Elsevier because of their unique situation, for example, the degree of document completeness and the degree of process complexity.
This activity is conducted before and during the development of the solution in Elsevier’s case. The result of this activity will provide the answer for the first research question: what is the type of methodology that should be used to develop business-oriented data quality metrics?
iii. Developing the Solution
Here, the thesis conducts the theory testing research where the aim is to test and make adjustments if necessary (Verschuren et al. [27]) to the
GPF
defined in the previous step. The process solution proposed in previous stage is then implemented in Elsevier’s environment once theGPF
is selected. Some details of previous projects are also used in this step with user’s validation to avoid recurring activities.This step will be conducted simultaneously with step II because the situation in Elsevier needs to be identified at an earlier phase. This enables us to make necessary adjustments for the
GPF
. An example is the required adjustment if the process metrics (e.g., KPIs) for Elsevier’s business process are not available.Interaction with the Elsevier system and experts is required to assess the business process and information system, to identify the quality metrics for the product MDM data, and to validate the results. The adjustments for the process framework and the assumptions used to select a component will be documented as the research’s result.
iv. Testing the Result
The test is needed to ensure that the quality metrics are related and useful to business performance. The qualitative reasoning that describes the relationship between the data quality metrics and business performance has been developed in the previous step. However, we also need to assess its compliance with other data quality metrics requirements. An example is we need to conduct a data quality assessment process to some applications to assess the degree of feasibility and reproducible. The result of activity III and IV will provide the answers for the second and third research questions as follows:
How appropriate is the methodology for a practical case? What processes or components should be altered?
What are the data quality metrics specifications for a study case in Elsevier? v. Concluding Remark
This final phase is not a project execution. It describes the conclusions, lessons learned, and the future recommendation on the basis of the findings in phase2 validation.
6 [51] 1.6 Structure of the Thesis
The process, results, and findings during the project will be described in the thesis document with the following outline:
i. Introduction
There are two chapters in this section as follows: a) Chapter 1 - Introduction
This chapter introduces the background and the problems in the MDM environment that require the data quality assessment and improvement activity. Some limitations are introduced to develop the boundaries of the thesis and to make sure that the work is within a master thesis project’s load. The research’s goal and questions are set on the basis of the defined background, problems, and boundaries.
The research approach is developed as a guide to conduct the thesis work. The activities in the research approach reflect the structure of the thesis, which includes introduction, conceptualization, empirical evaluation/ validation, and conclusion.
b) Chapter 2 - Project Environment
This chapter describes the working environment when conducting the thesis work in Elsevier with some explanations of the organization, information system, and resources.
ii. Conceptualization
There is one chapter with two subchapters in this section as follows: a) Chapter 3.1 - Related Studies
This chapter describes several studies that are related to the thesis project and needed to answer some of the research questions to attain the research goal. The studies are mostly for subjects in data quality and MDM, the main topic of this thesis project.
b) Chapter 3.2 - General Process Framework
To answer the research questions, this study needs to have a more concrete and scientifically sound process model and metamodel. The process model and metamodel is selected from other studies, and it will be used as a base reference method for the validation phase.
iii. Validation
The chapter in this section, Chapter 4 – “Empirical Evaluation in Elsevier,” describes the process and results when conducting the GPF in the case study environment. It also describes the findings when conducting the GPF in the case study environment. The findings are the alteration for the process model to be feasible for the case study.
iv. Concluding Remarks
The chapter in this section, Chapter 5 – “Conclusion,” provides the summary of the thesis works and the expected future works.
7 [51]
2
Project Environment
2.1 Elsevier
Elsevier is the world’s leading provider of scientific, technical, and medical (STM) information and serves more than 30 million scientists, students, and health and information professionals worldwide. It has over 11 million articles and over 11,000 full-text e-books in one of its platforms, ScienceDirect. According to its 2012 financial report, Elsevier provided more electronic products. A total of 64% of the revenue is from electronic format (21% is print/other), and 85% of titles in STM are available in electronic format.
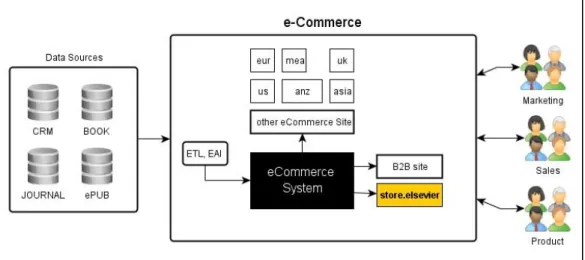
As described in section 1.3 and 1.5, the focus of the study is on book/journal product data in the e-commerce environment. However, we need to reduce the business domain in Elsevier because it has several Web commerce platforms to sell the products. Each platform could have different responsible units, e-commerce systems, target customers, and product types. Thus, we limit business domain for the direct marketing under the e-Business division. This provides the description of e-commerce as follows: a. Organization
Product, Marketing, and Sales unit under the e-Business division b. E-commerce platform
The e-commerce platform (Figure 2) is using the e-commerce system as the main platform, and it is limited to several websites, namely store (store.elsevier.com; B2C), B2B site, and other e-commerce websites.
Figure 2 E-commerce in Elsevier 2.2 Resource
During the thesis work, Elsevier provides the graduate the opportunity to use several physical and nonphysical resources as follows:
i. A mentor to guide the thesis project, providing the right resources and people to interview, and to distribute the information requirements.
ii. Domain experts who provide important information for the study through interview and document sharing.
8 [51] iii. An access to ScienceDirect.com from the office to get required electronic research papers,
journals, and books.
iv. Notebook, e-mail, and access to internal network. These resources allow me to access the internal application useful for the research and to contact internal staff to ask information related to the study.
v. Knowledge repository to access related documents, for example, project documents, operational documents, and architecture documents. There are two main resources used for this study, namely CBS Wiki and MOSS document management system.
9 [51]
3
Conceptualization
To answer the first research question, -what is the type of methodology that should be used to develop business-oriented data quality metrics?-, we need to review existing studies in data quality. There are two components that this study needs to establish, namely the process model and the metamodel. The process model is required to provide the activities, description and method of the activities, goal of each activity, and their sequence to develop the data quality metrics. The metamodel model is needed to provide the components, definition, relationship among the components, and how it is used by the activity in the process model. Those two main components provide the general process framework (GPF) that will be used as the base reference for this study.
3.1 Related Studies
3.1.1 Data Quality Methodology 3.1.1.1 AIMQ
AIMQ (Lee et al. [13]) is a methodology for information quality (IQ) assessment and benchmarking. The methodology is developed on the basis of other academic studies (e.g., Wang & Strong, Goodhue, Jarke & Vassiliou) and several practitioners’ view (e.g., Department of Defense, HSBC, and AT&T), and is validated using cases from three large health organizations. The methodology consists of a model of IQ, a questionnaire to measure IQ, and analysis techniques in interpreting IQ.
The important components in AIMQ are the IQ model and IQ dimensions, which are critical for the information consumers. The IQ model in AIMQ, PSP/IQ model, has four quadrants that are relevant to an IQ improvement decision. Those four quadrants are sound information, useful information, dependable information, and usable information.
This model is used to assess how well an organization develops sound and useful information products and delivers dependable and usable information services to the consumers.
3.1.1.2 Total Information Quality Management (TIQM)
English [7] defined quality as consistently meeting customers’ expectations. TIQM (Figure 3) is developed on the basis of quality management principles, techniques, and processes from the leaders of the quality management revolution and has the following processes related to data quality assessment: a. P1 Assess Data Definition and Information Quality Architecture
This process defines how to measure the quality of data definition to meet the knowledge workers’ requirements, current information architecture and database design quality, and customer satisfaction with data definition.
b. P2 Assess Information Quality
This process defines how to measure the quality of information to meet the various quality characteristics, such as accuracy and completeness. Activities related to this process are identifying information quality objectives and measure, identifying data and reference data, measuring the information quality, and reporting information quality.
10 [51] Figure 3 TIQM Process, English
3.1.1.3 DQ-P
Morbey [17] defined data quality as the degree of fulfillment of all those requirements defined for data, which is needed for specific process. His study provides 7+2 data quality dimensions and examples of measurements. It also provides a general data quality process (DQ-P) with the following activities (Figure 4):
a. Define the data quality requirements, including the business rules, quality dimensions, and metrics b. Measure the data in repository against the data quality requirement
c. Analyze the measurement result to identify the defects and the target for improvement
d. Improve the data quality by fixing the data or implementing new plausible checks at data input for future prevention
e. Monitor
Figure 4 DQ-P Activities, Morbey [17]
3.1.1.4 ORME-DQ
Batini et al. [2] provided several dimensions that can be used in data quality assessment, and they also provided a classification of costs and benefits that can be used to support decision in engaging data quality improvement campaigns. In general, they classified the costs into three categories, namely (i) the costs of current poor data quality, (ii) the costs of DQ initiatives to improve it, and (iii) the benefits that are gained from such initiatives. The benefits are also classified into three categories, namely (i)
1. Define
2. Measure
3. Analyse
4. Improve
11 [51] monetizable, (ii) quantifiable, and (iii) intangible. They provided a data quality method, the ORME-DQ, which has these core steps:
a. Phase I: DQ Risk Prioritization
Assessing and modelling relevant databases, business processes, potential loss of poor data, and correlation matrix
b. Phase II: DQ Risk Identification
Evaluating economic loss to select critical processes, datasets, and data flow c. Phase III: DQ Risk Measurement
Conducting qualitative and quantitative assessment of data quality in current data repositories d. Phase IV: DQ Risk Monitoring
Evaluating the DQ dimension values periodically and sending alert when less than predefined values
3.1.1.5 Hybrid Approach
Woodal et al. [29] defined data quality as fit for use. They studied eight data quality assessment and improvement methodologies to provide a hybrid approach with recommended activities as follows: (a) select data items, (b) select a place where data is to be measured, (c) identify reference data, (d) identify DQ dimensions, (e) identify DQ metrics, (f) conduct measurement, and (g) conduct analysis of the results. The assessed methodologies include AIMQ (Lee et al. [13]), TQDM (English, 1999), cost-effect of low data quality (Loshin, 2004), and subjective-objective data quality assessment (McGilvray, 2008).
The conduct measurement activity (f) obtains values for the dimensions (d) and metrics (e) for a given set of data items (a). The measurement process applies the metrics to the data in a certain data repository (b). The process could be using reference data (c) depending on the type of datasets.
The methodology is validated using cases in a UK car manufacturer organization and the London Underground. An important result of this study is that the process model is configurable, and we could develop an alternate configuration of the process model for a certain domain or case study.
3.1.1.6 Business Oriented Data Quality Metrics
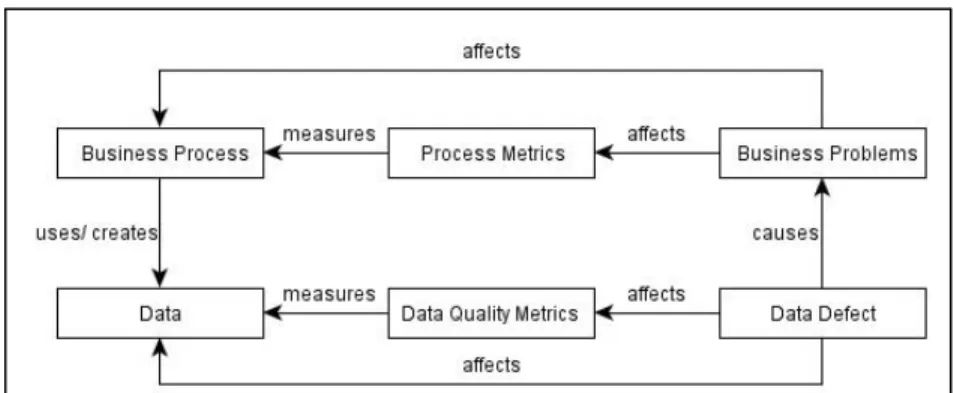
Figure 5 Entities and Relations of a Business-Oriented Data Quality Metric, Otto et al. [19] Otto et al. [19] developed a methodology to identify business-oriented data quality metrics on the basis of 26 previous studies, among them are the studies by Batini (2006, 2007, 2009), Lee et al. (2002, 2006), English (1999), DAMA (2009), Loshin (2001), and Wang (1996). The methodology is developed
12 [51] with the assumption that data defects could cause business problems (Figure 5) and that the identification of data quality metrics should be based on how the poor data impacts process metrics.
Figure 6 Process Model for DQ Metrics Identification, Otto et al. [19]
This study compared the methodologies to develop a process model with these considerations:
i. The structure of the method that consists of activities (Figure 6), results, metamodel, role, and techniques.
The process model provides the activities consisting of three phases—namely, the identification phase to identify business problems and data defects, the specification phase to develop the data quality requirements and data quality metrics, and the verification phase to ensure the data quality metrics meet the requirements.
The metamodel provides the components that should be developed within each activity in the process model. It also defines the relationships among the components in Figure 5.
ii. Pragmatic definition and representation. iii. Relationship with business performance. iv. Implementation capability.
This methodology is validated using cases in a telecommunication provider company (customer service processes), a watch movement producer company (manufacturing processes), and a machine manufacturer/automotive industry supplier company (maintenance processes).
3.1.2 Data Quality Metrics Requirements
There are studies in data quality that provide a number of data quality dimensions, measurement methods, and scales for the output value. Data quality metrics requirements are needed as a guide to define the data quality metric where a possible activity is to select for available lists. Data Management International provides several data quality dimensions—namely, accuracy, completeness, consistency, currency, precision, privacy, reasonableness, referential integrity, timeliness, uniqueness, and validity within its Data Management Body of Knowledge (DMBOK). DMBOK, which is authored by data quality practitioners, provides general requirements for the DQ metrics as in Table 23. There are also several studies that provide more specific requirements for DQ metrics:
a. Heinrich et al. [11] provided requirements on metrics value and scale (comparable, aggregation, interval) and methods (aggregation) to use in Table 24. Those requirements are developed from the study by Even and Shankaranarayanan (2007).
13 [51] c. Hüner et al. [12] provided generic and specific requirements for DQ metrics in Table 30. This study developed the requirements using the study by DAMA [5] and Heinrich et al. [11]. The study also added some requirements—namely, understandability and complete information and relation with other components.
d. Loshin [15] provided generic and specific requirements for DQ metrics in Table 27. Some of the requirements are used by DAMA [5].
3.1.3 Data Quality Metrics Integration
Figure 7 Data Model with Quality (Attribute Level), Wang et al. [29]
Wang
et al.
[29] provided the representation of quality as additional information within a data model (Figure 7). They also acknowledged the possibility of developing the data model with its quality requirements from several different applications, such as finance and human resource. The steps to acquire the data model with quality attributes by Wang et al. [29] are as follows (Figure 8):1. Determine the application view of the data.
The architect should develop a conceptual data model (ER diagram or class diagram) that is derived from existing application or business requirements. The result of this activity is the application view, an ER diagram of an application (Figure 7, blue shapes).
2. Determine (subjective) quality parameters for the application.
The business users should determine the quality parameters to make the information accurate; for example, the CEO name should be believable or share price should by interpretable to be usable. The result of this activity is the parameter view, an application view with data quality dimensions for each attribute (Figure 7, yellow shapes).
3. Determine (objective) quality indicators for the application.
Together with data architect, business users could define the objective quality, for example, the unit for share price and the trusted data sources. The result of this activity is the quality view, a parameter view with data quality indicators for each dimension (Figure 7, black shapes).
4. Conduct quality view integration.
A data/information could be used by several applications, and each application could have different representations or requirements. This step should integrate from several views and be agreed by the business users, and this step is required to make sure that a variety of data quality requirements can be met. The consolidation process is considered similar to schema integration identified by Batini et al. [4].
14 [51] Figure 8 Steps of Identifying Quality Attributes, Wang et al. [29]
Batini et al. [4] provided several activities to integrate the schemas as follows: a. Pre-integration
An analysis of schemas is carried out to provide the information needed to make these decisions: the number of schemas to be integrated, the amount of designer interaction, the order of integration, and a possible assignment of preferences to entire schemas or portions of schemas.
b. Comparison of the Schema
The schemas are compared to determine the correspondence among concepts and possible conflicts.
c. Conforming the Schema
The goal of this activity is to resolve the schema conflicts with the designers and users before merging them.
d. Merging and Structuring
The consideration for merging activity is using these qualitative criteria: i. Completeness and Correctness
The integrated schema must contain all concepts present in any component schema correctly.
ii. Minimality
A concept must be represented once in the integrated schema if it is represented in more than one component schema.
iii. Understandability
Among several possible results, the one that is (qualitatively) the most understandable should be chosen.
1. Determine the application view of
data
Application view, an ER diagram
2. Determine (subjective) quality parameters for the
application
Parameter view, an application view with DQ dimensions for each attribute
3. Determine (objective) quality
indicators for the application
Quality view (i) , i = 1 . . . n, a parameter View with quality indicators for each DQ
dimension
4. Conduct quality
15 [51] 3.1.4 Data Quality Dimensions
“The quality of data depends on the design and production processes involved in generating the data. To design for better quality, it is necessary first to understand what quality means and how it is measured” [28].
3.1.4.1 Quality dimensions by Sebastian-Coleman
Sebastian-Coleman [23] developed the data quality dimension as a component of DQAF measurement method. The quality dimensions in Table 15 are developed using these considerations: DQAF is used to define objective measures; DQAF is used for overall data management including basic controls that confirm receipt of data, measure the efficiency of technical processes in the data chain, and measure the quality of data content; and DQAF is used for in-line measurements. The study included several dimensions, such as completeness, validity, consistency, and integrity.
3.1.4.2 Quality dimensions by Morbey
Morbey [17] provided only 7+2 dimensions (7 automatically measurable and 2 documentary) for data quality with assumptions that other quality dimensions should already be checked by other teams in the company, namely expert approval, surveys, IT security/business monitoring, automatic measuring, visual inspection or document check, and audits/follow-up examinations. The essential dimensions of data quality are as in Table 16 which consists of completeness per row, syntactical correctness, absence of contradiction/ consistency, business referential integrity, absence of repetition/ uniqueness, and accuracy.
3.1.4.3 Quality dimensions by Batini et al.
Batini et al. [3] studied 13 methodologies of data quality assessment and improvement in 2009 and provided several basic sets of data quality dimensions, including accuracy, completeness, consistency, and timeliness. However, a general agreement on which set of dimensions defines the quality of data or on the exact definition of each dimension is not available. Batini et al. [3] defined quality dimensions as in Table 17. Several findings on data quality by Batini et al. [1] are as follows:
Data quality is a multifaceted concept, as in whose definition different dimensions concur.
The quality dimensions, such as accuracy, can be easily detected in some cases (e.g., misspellings) but are more difficult to detect in other cases (e.g., where admissible but not correct values are provided).
A simple example of a completeness error has been shown, but as to accuracy, completeness can also be very difficult to evaluate, for example, if a tuple representing a movie is entirely missing from the relation movie.
Consistency detection does not always localize the errors.
3.1.5 Data Quality Measurements
Data quality is a multidimensional concept, and companies must deal with both the subjective perceptions and the objective measurements on the basis of the dataset in question (Pipino et al. [22]).
16 [51] 3.1.5.1 Pipino et al.
Pipino et al. [22] did not develop a specific measurement method for each dimension, but they provided several generic operations that could be used within an objective measurement as follows: a. Simple Ratio
The simple ratio measures the ratio of desired outcomes to total outcomes. Several dimensions could use this form like free of error, completeness, and consistency free of error, completeness, and consistency.
b. Min or Max Operation
The minimum operation can be used for believability, and the appropriate amount and the maximum operation can be used for timeliness and accessibility. The minimum operator is used when the indicators have value in the permissible range. The maximum operation is used when a liberal interpretation is warranted, but we want to make sure that the value is within a permissible range.
c. Weighted Average
A weighted average is an alternative to the minimum operator. This study indicates the use of this form only when the company understands the importance of each indicator to the overall evaluation of a dimension.
3.1.5.2 Batini et al.
Batini et al. [3] found that there are several measurements/metrics on a single dimension on the basis of assessment to 13 methodologies of data quality improvement as in Table 19. The study provided the subjective and objective measurement methods as defined in the researched methodologies. An example of subjective measurement is by having a survey to the data consumers to assess the data quality level or their level of satisfaction. While the example for the objective measurement is by defining the criteria for a certain data quality attribute and developing the appropriate mathematical function for assessment.
3.1.5.3 Peralta
Peralta [21] studied only the accuracy and the freshness data quality dimension. The study provided three types of metrics that are used for the accuracy dimension, as follows:
a. Boolean metric: It is a Boolean value (1=true, 0=false) that indicates whether a data item is accurate (correct, precise) or not.
b. Degree metric: It is a degree that captures the impression or confidence of how accurate the data is. Such degree is commonly represented in the [0–1] range.
c. Value-deviation metric: It is a numeric value that captures the distance between a system data item and a reference one (e.g., its real-world correspondent entity). Such distance is generally normalized to the [0–1] range.
3.1.5.4 Sebastian-Coleman
Sebastian-Coleman [23] provided measurement methods for several dimensions as in Table 20. The study defines the measurement for a number of data quality attributes, namely completeness, validity, consistency, integrity, and timeliness. It also determines when to execute the measurement on the basis
17 [51] of the data criticality. The in-line measurements are conducted when the data enters the system, and they are for critical data, whereas the periodic measurements could be performed weekly or monthly, and they are for less critical data.
Table 1 Summary of DQ Measurement, Sebastian-Coleman [23]
DQ Attributes In-Line Periodic Process Control
Completeness v v v
Validity v v -
Consistency v v v
Cross-table integrity v v -
Timeliness v - -
3.1.6 Types of Data Model in MDM
MDM is a cycle of consolidation, integration, and synchronization, and there could be a specific data model at each phase in the cycle (Figure 9).
Figure 9 MDM Data Exchange, Loshin [14]
There are three data models that need to be defined in MDM, where one model is optional [14], as follows (Figure 10):
1. Exchange model for the exchange view
This model is used to exchange the data between master repository and participant applications. The model captures the structure and data type of all participants’ data that will form the master data object.
2. Consolidation model
This data model is optional and acts as an intermediate model to consolidate the data sources into a master repository. Because the function is for consolidation, the object identifier definition is important in this model.
3. Repository model for the persistent view
This model is used in the master repository as the model for master data object. This is the model that is viewed as the master data model by participant/target applications. Identity resolution is the challenge in this model because the object should be unique.
Application
Data Sets
Consolidation
Platform
Master
Repository
Data
Sharing
18 [51] Figure 10 Data Model for MDM
3.1.7 Methodologies Comparison and Relationship with the Studies
As described earlier in 1.5, several studies on data quality methodology are needed to define the general framework. The goal is to find a methodology that provides clear procedures and required components in developing business-oriented data quality metrics. Studies in data quality methodology in 3.1.1 could be summarized in Table 2. This study compares the methodologies with the following criteria:
i. Process model
The initial phase of this research is to develop the general process framework (GPF) that provides complete and clear definition of its components. The existence of a process model and metamodel in the methodology is important because it will be used as a reference for the project to address the goal.
ii. Criteria for DQ
The goal of this thesis is to identify, collect, analyze, and evaluate the quality metrics for a product master data; to allow quantifying and improve their value. The objects in the master data are the high value ones and have business impacts for the company. Thus, it is important to understand how they define the criteria for data quality and whether they provide a correlation with the business needs.
iii. Scope of the Study
This thesis needs to focus on the measurement phase of the data quality assessment and improvement process. Each methodology could discuss a different set of phases and focus on certain parts/components in the metamodel.
19 [51] Table 2 DQ Methodologies
Methodology Process Model Criteria for DQ Scope
AIMQ (Lee et al. [13])
Yes. It provides only DQ assessment on the basis of questionnaires and statistical function.
The identification of task needs and standards is unavailable. The identification is more on how much data meet the standard or expectation by filling a value within a range.
DQ meets the standards and information consumer task needs. Assessment/ measurement
TIQM (English) Yes. It is an ongoing process of reducing data defects.
There is an identification of data definition quality and task requirements (completeness, accuracy, currency), but they are not related with possible business problems.
DQ meets the knowledge workers’ requirements and standards. Assessment/ measurement, improvement DQ-P (Morbey [17])
Yes. It has a generic process, like to define, measure, and analyze.
Identification of task requirement is assumed done prior to the process. The DQ team starts its process after accepting the request for a DQ check. DQ meets task requirements. Assessment/ measurement, improvement ORME-DQ (Batini et al. [2])
Yes. It has a generic process and provides details on costs and benefits.
Risk identification is important and conducted by assessing the cost-benefit.
Provide relation with potential loss of poor data. Assessment/ measurement, improvement Hybrid (Woodal et al. [30])
Yes. Generic process with flexible activities and flow.
Identification of task requirement is assumed done prior to the process.
Fit for use, i.e., meets task requirements.
Assessment/ measurement
Otto et al. [19] Yes. Only focus on metrics development and provide more details on activities.
Identification of business problems and the cause of data defects is part of the process.
Provide relation to business problems, i.e., minimizes business problems. Assessment/ measurement
The assessment of several methodologies shows that this study could use ORME-DQ (Batini et al. [2]) and Otto et al. [19] as the general process framework (GPF). Both studies explicitly provide identification of business problems within their process and the process model that can be used for this study.
The
GPF
to develop data quality metrics that will be used within this thesis is the methodology developed by Otto et al. [19]. The selection of this methodology is using these considerations:i. The methodology is specific for identifying business-oriented data quality metrics.
ii. The components in the process model and metamodel are developed on the basis of several other studies:
a. The structure of the methodology that consists of activities, results, metamodel, role, and techniques
20 [51] b. Pragmatic definition and representation, such as the definition of quality dimensions, roles, and
measurement methods
c. Relationship with business performance
iii. The methodology provides tangible artifacts to use, for example, data quality requirements, questionnaire, and data quality dimensions.
iv. The methodology provides a metamodel for the process. It is possible to develop the components that suit a certain case study, for example, the data quality requirements, data quality dimensions, or performance assessment.
As explained in 1.5, this thesis will conduct theory testing research to answer the second research question and will need to provide the list of data quality metrics for Elsevier’s case to answer the third research question.
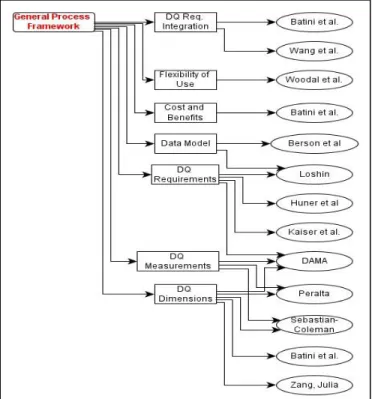
Figure 11 Literature Studies
To make sure that the selected process model is adaptive enough for Elsevier’s case, we need to incorporate several other studies that are related to MDM, the components in the process model, and process flexibility. Thus, we still use the results of other studies and correlate them with the selected
GPF
(Figure 11), as follows:a. DQ Metrics Requirements (Hüner et al. [12], DAMA [5], and Loshin [15])
A data quality metrics requirement is the component that is used to develop and test the data quality metrics; that is, the data quality metrics should conform to the requirements. We could develop the list of requirements that meet the need of Elsevier as a publishing company using several studies’ results.
b. DQ Dimensions (Zang, Batini et al. [2], Peralta [21], Sebastian-Coleman [23], Morbey [17], and DAMA [5]).
21 [51] DQ dimensions and DQ measurements are two main objects in the assessment and measurement phase (Batini et al. [3]). We need to use the results of several studies to get a complete set because each research usually focuses on several dimensions or measurement methods. It is also possible that they use a different approach or definition for the same dimensions.
d. DQ Methodology Process’s Flexibility (Woodal et al. [29])
This research provided that we could have a variation of process model in the data quality assessment and improvement methodology to adapt for a certain case. It is a useful finding for this study because it is possible that the case study requires some adjustments to the GPF.
e. Data Model in MDM (Berson et al. [4] and Loshin [14])
f. DQ Requirement Integration (Wang et al. [29] and Batini et al. [4])
The goal of this project is to develop the data quality metrics for the MDM. The data model or requirement integration research provides a solution to ensure the result will be feasible for the MDM system/environment.
3.2 General Process Framework 3.2.1 Goal
The goal of the method is to identify the business-oriented data quality metrics for a product MDM.
3.2.2 Metamodel for the method
The methodology has several important components/entities that need to be identified or developed. The metamodel that covers the required components is as depicted in Figure 12. The activities within the process model have a goal to develop those components. Table 3 provides a more detailed description of the metamodel.
Table 3 Metamodel component description, Otto et al. [19] No Component Description
1 Data Data is a representation of objects and relationships between objects. The paper considers corporate master data with a focus on values assigned to data elements.
2 Data Defect Data defect represents the condition where the data does not meet the technical requirement or consumer’s need. It is a result of incidents, such as input error, and it poses a risk to data.
3 Data Quality Metrics A quantitative measure of the degree to which data possesses given quality attributes. In a data quality metric, there are descriptions for related dimension, where to measure and what data to measure, the measurement method, and the scale used for measurement.
4 Business Process/ Process Activity
Sequence of chronologically and typologically linked tasks is intended to generate a clearly defined output, bringing about customer benefit.
5 Process Metrics A quantitative measure of the degree to which a business process possesses given quality attributes. It provides information about a process’s state, indicating weak points and allowing immediate reaction.
6 Business Problem State or incident leading to decreased business process performance. It poses a risk to a business process and could affect the business goal.
22 [51] No Component Description
7 Preventive Measure Activities that are conducted to avoid or lower the probability of data defects. 8 Reactive Measure Activities that are conducted with the data when a defect occurs.
Figure 12 Metamodel for the Method, Otto et al. [19] 3.2.3 Process Model
The process model for this method is as described in section 3.1.1.6 and 3.1.3. The activities that are conducted within each phase will identify or develop the component/entity in the metamodel (Figure 12). The matrix that provides the relationship between the process and the entity is in Table 14. The detailed information about the process is as follows:
i. Phase I
This phase consists of three activities—namely, identify business process and process metrics, identify IT systems, and identify business problems and data defects. The aims of this phase are selecting the business process and metrics to focus and to identify the business experts, identifying the relevant IT systems (e.g., applications, database) and the IT experts, and identifying cause-effect chains between business problems and data defects.
23 [51] The important result of this phase is an informal documentation of cause-effect chains (i.e., business problems and data defects) and likely affected business processes, process metrics, and data classes. a. Activity I.1 Identify Business Process and Process Metrics
This activity aims at identifying business process and process metrics to focus on during the remaining identification process. There should be criteria for the selection of a particular business process; for example, it is important to for the company’s business success and the availability of metrics and measurement values. Also, it results a list of contacts that might be interviewed for activity I.3.
b. Activity I.2 Identify IT Systems
This activity aims at identifying IT systems (e.g., ERP systems, CRM systems, or databases) that are supporting the identified business processes. It also results a list of IT experts that might be interviewed for activity I.3.
c. Activity I.3 Identify Business Problems and Data Defects
It is the main activity of phase I, and it aims at identifying cause-effect chains between business problems and data defects. There are two methods to identify the cause-effect chains: (i) Identifying causing data defects from identified critical business problems and (ii) identifying potential business problems for already-known data defects. Otto et al. [19] provided interview guidelines and exemplary cause-effect chains to support this activity.
ii. Phase II
This phase consists of two activities—namely, defines and ranks requirements for data quality metrics and specifies data quality metrics. The aims of this phase are to select requirements for the DQ metrics, which consist of generic and company specific requirement, and metric specification (data item, measurement method, measurement point, and measurement scale).
a. Activity II.1 Define and Rank Requirements
This activity aims to define the requirements for data quality metric specification. It will be used as a guide to define data quality metrics in activity II.2, for example, the scale to be used or the selection of method. The list of requirements will also be used for verification activity (III.1). The list of requirements should comprise both generic (e.g., a specified measurement device and measurement points) and company specific requirements (e.g., facility to visualize metric measurements in a specific manner).
b. Activity II.2 Specify Data Quality Metrics
It aims to at least specify one data quality metric. This activity comprises the specification of a (subset of a) data class that is measured by the metric, the specification of a measurement device and a measurement point where the measurement takes place, the specification of the measurement scale, the specification of measurement procedures and its frequency. Those sub activities provide information needed for a data quality metric. It is part of data quality metric requirements that have been defined in this study.
iii. Phase III
This phase exists to verify whether the DQ metrics meet the requirements in phase II. a. Activity III.1 Verify Requirement Fulfillment

![Figure 6 Process Model for DQ Metrics Identification, Otto et al. [19]](https://thumb-us.123doks.com/thumbv2/123dok_us/1836868.2766057/21.918.200.726.161.343/figure-process-model-for-dq-metrics-identification-otto.webp)
![Figure 7 Data Model with Quality (Attribute Level), Wang et al. [29]](https://thumb-us.123doks.com/thumbv2/123dok_us/1836868.2766057/22.918.157.748.286.499/figure-data-model-quality-attribute-level-wang-et.webp)
![Figure 8 Steps of Identifying Quality Attributes, Wang et al. [29]](https://thumb-us.123doks.com/thumbv2/123dok_us/1836868.2766057/23.918.203.714.133.446/figure-steps-identifying-quality-attributes-wang-et-al.webp)

![Figure 12 Metamodel for the Method, Otto et al. [19]](https://thumb-us.123doks.com/thumbv2/123dok_us/1836868.2766057/31.918.102.805.107.748/figure-metamodel-method-otto-et-al.webp)