DOI: 10.12928/TELKOMNIKA.v16i5.10508 2458
Optimum Image Filters for Various Types of Noise
Zayed M. Ramadan*
Department of Electronics and Communications Engineering, Faculty of Engineering, Al-Ahliyya Amman University, Amman, Jordan
*Corresponding author, e-mail: zramadan@ammanu.edu.jo
Abstract
In this paper, the quality performance of several filters in restoration of images corrupted with various types of noise has been examined extensively. In particular, Wiener filter, Gaussian filter, median filter and averaging (mean) filter have been used to reduce Gaussian noise, speckle noise, salt and pepper noise and Poisson noise. Many images have been tested, two of which are shown in this paper. Several percentages of noise corrupting the images have been examined in the simulations. The size of the sliding window is the same in the four filters used, namely 5x5 for all the indicated noise percentages. For image quality measurement, two performance measuring indices are used: peak signal-to-noise ratio (PSNR) and structural similarity (SSIM). The simulation results show that the performance of some specific filters in reducing some types of noise are much better than others. It has been illustrated that median filter is more appropriate for eliminating salt and pepper noise. Averaging filter still works well for such type of noise, but of less performance quality than the median filter. Gaussian and Wiener filters outperform other filters in restoring mages corrupted with Poisson and speckle noise.
Keywords: gaussian noise, speckle noise, poisson noise, salt & pepper noise, image filtering
Copyright © 2018 Universitas Ahmad Dahlan. All rights reserved.
1. Introduction
Image processing is concerned of changing characteristics of images to improve their qualities. This includes various areas such as noise reduction, image enhancement and object recognition. In image restoration in particular, images are usually corrupted by noise during image acquisition and transmission. For example, images captured by today's cameras typically include some kind of noise or blur. There are several types of noise such as Poisson noise (also known as photon noise), salt and pepper noise (also known as impulse noise or spike noise), Gaussian noise (also known as electronic noise) and speckle noise (also known as multiplicative noise). In reducing these types of noise, numerous filters have been proposed by researchers such as Wiener filter, Gaussian filter, median filter and averaging filter.
In [1], the proposed model to recover images corrupted by Poisson noise is based on sparse representations of images where an alternating minimization scheme together with variable splitting have been used to solve the resulted optimization problem. In [2], properties of variance stabilization have been used in images to estimate unknown Poisson noise parameters.
The proposed algorithm in [3] for Poisson noise reduction is based on alternating direction optimization method. A fast and effective method is proposed in [4] to solve a Poisson-modified total variation model in which a large time step is used in discretizing the gradient descent flow. In [5], the Poisson-distributed measurement noise components are included in the proposed filter that is based on minimum-variance. In [6], the proposed work for recovering images corrupted by Poisson noise is based on confocal microscopy typically used for 3-D imaging of biological living specimens which produce images with high resolution. The Poisson noise is reduced through the method proposed in [7] using the Anscombe variance stabilizing transform.
A new quaternion filter for restoring color images corrupted with Gaussian noise is introduced in [8] based on a tight bound optimization of the quaternion mean square error (MSE) between the resultant (restored) image and the noise-free one. A fuzzy method based on weighted averaging is proposed in [9] to reduce mixed impulsive and Gaussian noise in color images. The method introduced in [10] is based on singular values to estimate the noise level of
images corrupted with Gaussian noise. In [11], the proposed method for restoring images corrupted with Gaussian-impulse mixed noise is based on minimizing an objective function that includes a content-dependent fidelity term. In [12], a method is proposed to reduce Poisson-Gaussian noise mixture based on optimization of a linear expansion of thresholds. The introduced method in [13] works for mages corrupted with impulse noise as well as for those corrupted by impulse-Gaussian mixed noise. This method is based on both a modified total variation minimization scheme and median filtering.
In [14], the proposed method is based on image subspaces to reduce speckle noise from synthetic aperture radar (SAR) images. Various multiscale nonlinear thresholding methods for elimination of ultrasound speckle noise is proposed in [15]. The method introduced in [16] uses an adaptive data-driven exponential operator that is based on wavelet coefficients of the ultra sound images to reduce the effects of speckle noise. A generalized framework based on Bayesian nonlocal means is proposed in [17] to reduce speckle noise from synthetic aperture radar images corrupted with multiplicative speckle noise. The proposed scheme in [18] is based on Gamma distribution to improve quality of ultrasound images corrupted with speckle noise.
An iterative algorithm in which two decisions are required in each iteration to detect impulsive noisy pixels is proposed in [19]. Many two-stage algorithms for filtering of images corrupted particularly with impulse noise are proposed [20-25] where detection of noisy pixels is carried out in the first stage and reduction of this noise is accomplished in the second. A comprehensive overview of image filtering schemes and algorithms is introduced in [26]. This paper is mainly concerned with measuring the quality of performance of these filters in removing some types of noise, and finding the most optimum imaging filter, in terms of eliminating each type of such noises, using two performance measuring indices.
2. Research Method
The typical two dimensional (2-D) filters that are commonly used in image filtering techniques are the median filter, averaging (mean) filter, Gaussian filter and Wiener filter. In the median filter, the processed pixel is replaced by the median value of its x neighborhood ( x is the size of the sliding window or kernel). In contrast, the averaging filter replaces each pixel at the center of the sliding window by the average (mean) value of its x neighborhood.
On the other hand, the Gaussian filter replaces each processed pixel at the center of the kernel by another value based on the Gaussian (normal) distribution with more weights for pixels close to the center of the kernel and less weights in the outward direction from the center of the sliding window. The Wiener filter is an adaptive filter that replaces each processed pixel at the center of the kernel by a computed value based on statistical approach (estimates of local mean and variance around).
2.1. Image Quality Metrics
Numerous performance measuring indices are typically used by researchers to evaluate the quality of the image filtering techniques, i.e., the similarity or closeness between the filtered (de-noised) image and the original uncorrupted image, and the capability of preserving image edges and details. In this paper, peak signal to noise ratio ( ) and the structural similarity (SSIM) are used. These performance measuring quality metrics are defined as follows.
∑ ∑ ( ) (1)
( ( )
) (2)
where is the mean squared error between the restored resultant image (R) and the original image(G), and is the bit depth or the number of bits in each pixel (for -bit images, for example, =8 and =256), M and N are the total number of pixels in the horizontal and vertical dimensions of the image (rows and columns of the matrix representing the image), and and are the pixel values in the ( ) locations of the filtered image and the original clean image,
The structural similarity (SSIM) index is a full reference metric that is commonly used to measure the similarity between two images. In other words, it is used for measuring the quality of the restored image with the original clean image used as a reference. Unlike peak signal-to-noise ratio (PSNR), the SSIM metric is based on visible structures in the image. It is claimed to be an improvement over other traditional metrics such as PSNR and MSE, which might not be consistent with human eye perception. It combines the luminance, contrast, and structure of the images into one single performance metric. In particular, the SSIM quality metric between two image signals and is a function of three components: luminance (l), contrast (c), and structure (s), where the luminance is a function of the mean intensities of these two images, the contrast is a function of their standard deviations, and the structure is a function of their covariance. The SSIM quality index can be defined as follows [27].
( ) [ ( )] [ ( )] [ ( )]
where; ( ) is the luminance comparison function defined as
( )
(4)
and are the mean values of the and images, respectively, and is a constant included to avoid instability when ( ) is very close to zero.
( ) is the contrast comparison function defined as ( )
(5)
and are the standard deviation values of the and images, respectively, and is a constant included to avoid instability when ( ) is very close to zero.
( ) is the structure comparison function defined as ( )
(6)
is the covariance of the and images, and is a constant included to avoid instability
when the product ( ) is very close to zero. The parameters are chosen to adjust the relative importance of the three components indicated above. If we choose , and
, the SSIM is simplified to ( ) ( )( )
( )( ) (7)
3. Results and Analysis
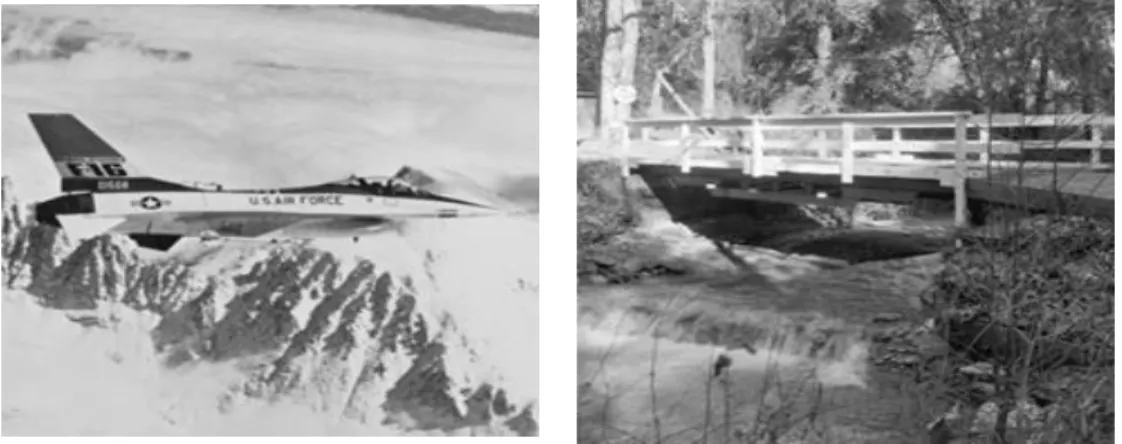
Simulations in this paper were performed in MATLAB using many images two of which are shown in the results in this section, namely Jet Plane image (512x512) and Walk Bridge image (512x512) as shown in Figure 1 and Figure 2, respectively. Wiener, Gaussian, median and averaging filters have been used to reduce Gaussian, Poisson, speckle and impulse noise. PSNR in decibels (dB) and SSIM were used to measure the quality of the filtered image after being corrupted by numerous types of noise with different densities (percentages). The size of the sliding window was chosen to be 5x5 for all filters being used. This size in particular has been chosen because it results in better performance for the maximum level of noise used in this paper (better performance with minimum blur).
In Tables 1 and 2, the Jet Plane and Walk Bridge images, respectively, are corrupted with Gaussian noise of zero mean and different noise variances that range from 0.05 to 0.25. The two tables show that the four filters have comparable results in removing Gaussian noise with a little better performance quality of the averaging filter.
Figure 1. Jet plane image Figure 2. Walk bridge image
Table 1. PSNR in dB and SSIM of restored Jet Plane Image after being Corrupted with Gaussian Noise of Zero Mean and different values of variances Using Several Filters
(V=noise variance) Jet Plane image corrupted
with Gaussian noise
Wiener Filter (5x5) Gaussian Filter (5x5) Median Filter (5x5) Averaging Filter (5x5) V PSNR SSIM PSNR SSIM PSNR SSIM PSNR SSIM PSNR SSIM 0.05 14.15 0.1194 23.41 0.5310 23.71 0.4736 23.05 0.4541 23.38 0.5674 0.10 11.78 0.0778 20.77 0.4120 20.84 0.3642 20.67 0.3383 21.21 0.4671 0.15 10.53 0.0596 19.30 0.3558 19.18 0.3067 19.29 0.2780 19.76 0.4102 0.20 9.75 0.0499 18.32 0.3235 18.07 0.2740 18.26 0.2428 18.69 0.3741 0.25 9.22 0.0442 17.63 0.3026 17.31 0.2516 17.52 0.2195 17.96 0.3484
Table 2.PSNR in dB and SSIM of restored Walk Bridge Image after being corrupted with Gaussian Noise of Zero Mean and different values of Variances Using Several Filters (V=noise
variance) Walk Bridge image
corrupted with Gaussian noise
Wiener Filter (5x5) Gaussian Filter
(5x5) Median Filter (5x5)
Averaging Filter (5x5) V PSNR SSIM PSNR SSIM PSNR SSIM PSNR SSIM PSNR SSIM 0.05 13.80 0.2082 21.77 0.4754 22.17 0.5259 21.13 0.4120 21.72 0.4554 0.10 11.44 0.1309 20.08 0.3877 20.13 0.4195 19.56 0.3353 20.46 0.3910 0.15 10.31 0.0996 19.06 0.3409 18.90 0.3617 18.42 0.2880 19.52 0.3513 0.20 9.60 0.0826 18.47 0.3159 18.09 0.3218 17.59 0.2533 18.82 0.3196 0.25 9.08 0.0697 17.85 0.2880 17.45 0.2947 16.85 0.2246 18.20 0.2987
In Tables 3 and 4, the Jet Plane and Walk Bridge images, respectively, are corrupted with speckle noise of zero mean and different noise variances ranging from 0.05 to 0.25. As shown in these two tables, the Gaussian and Wiener filters, in order, have the best performance in removing the speckle noise while the median filter has the worst results in removing such type of noise. It is worth mentioning that the Wiener filter adaptively restores the original image based on the local image variance by performing little smoothing when the variance is large and more smoothing when the variance is small. On the other hand, the Gaussian filter works by convolving the 2-D Gaussian distribution function with the noisy image. It is somewhat similar to the averaging filter, however, central pixels in the Gaussian filter have a higher weighting than those on the periphery.
In Tables 5 and 6, the Jet Plane and Walk Bridge images, respectively, are corrupted with Poisson noise of different scales ranging from 1 to 1 . These two tables show that
for lower quantities of noise, the Wiener and Gaussian filters have the best performance. For higher values of this noise, the median filter has the worst performance and the other filters have almost comparable results.
Table 3.PSNR in dB and SSIM of restored Jet Plane Image After being Corrupted with Speckle Noise of Zero Mean and Different Values of Noise Variance Using Several Filters (V=noise
variance) Jet Plane image
corrupted with speckle noise
Wiener Filter (5x5) Gaussian Filter
(5x5) Median Filter (5x5)
Averaging Filter (5x5) V PSNR SSIM PSNR SSIM PSNR SSIM PSNR SSIM PSNR SSIM 0 .05 16.53 0.2068 25.75 0.6177 25.92 0.5715 23.40 0.4692 24.49 0.6318 0.10 14.10 0.1465 23.13 0.4996 23.16 0.4670 21.14 0.3688 22.84 0.5505 0 .15 12.65 0.1167 21.29 0.4302 21.29 0.4081 19.71 0.3151 21.46 0.4975 0.20 11.60 0.0966 19.92 0.3879 19.91 0.3644 18.71 0.2788 20.22 0.4566 0.25 10.77 0.0835 18.81 0.3528 18.75 0.3322 17.91 0.2521 19.21 0.4203
Table 4. PSNR in dB and SSIM of Restored Walk Bridge Image after being Corrupted with Speckle Noise of Zero Mean and Different Values of Noise Variance Using Several Filters
(V=noise variance) Walk Bridge image
corrupted with speckle noise
Wiener Filter (5x5) Gaussian Filter (5x5)
Median Filter (5x5)
Averaging Filter (5x5) V PSNR SSIM PSNR SSIM PSNR SSIM PSNR SSIM PSNR SSIM 0.05 19.53 0.5231 23.72 0.5829 25.03 0.7025 22.65 0.5075 22.85 0.5370 0.10 16.70 0.3910 22.06 0.5128 23.65 0.6395 21.53 0.4543 22.28 0.5068 0.15 15.07 0.3176 20.93 0.4684 22.57 0.5944 20.76 0.4156 21.72 0.4829 0.20 13.92 0.2691 20.05 0.4379 21.72 0.5587 20.10 0.3893 21.22 0.4621 0.25 13.05 0.2325 19.43 0.4138 20.98 0.5257 19.53 0.3674 20.72 0.4439
Table 5.PSNR in dB and SSIM of Restored Jet Plane Image after being Corrupted with Poisson Noise of Different Scales Using Several Filters
Jet Plane image corrupted with
Poisson noise Wiener Filter (5x5) Gaussian Filter (5x5) Median Filter (5x5)
Averaging Filter (5x5) Scale PSNR SSIM PSNR SSIM PSNR SSIM PSNR SSIM PSNR SSIM 1 31.55 0.7330 33.03 0.8949 32.21 0.9185 29.31 0.8663 26.13 0.8281 5 24.58 0.4473 30.84 0.8432 30.78 0.8336 28.45 0.8002 25.94 0.7929 1 21.57 0.3379 29.33 0.7945 29.51 0.7572 27.61 0.7367 25.71 0.7548
5 14.57 0.1520 24.05 0.5123 24.61 0.4963 23.81 0.4867 24.18 0.5762
1 11.54 0.1000 21.32 0.3824 21.96 0.3816 21.21 0.3562 22.85 0.4669
Table 6.PSNR in dB and SSIM of Restored Walk Bridge Image after being corrupted with Poisson noise of Different Scales Using Several Filters
Walk Bridge image corrupted with
Poisson noise Wiener Filter (5x5) Gaussian Filter (5x5) Median Filter (3x3)
Averaging Filter (3x3) Scale PSNR SSIM PSNR SSIM PSNR SSIM PSNR SSIM PSNR SSIM 1 33.48 0.8537 29.58 0.8537 26.90 0.7956 27.07 0.8016 26.31 0.7801 5 26.51 0.7755 28.23 0.8164 26.59 0.7762 26.26 0.7534 25.962 0.7547 1 23.52 0.6643 27.00 0.7747 26.23 0.7543 25.49 0.7099 25.55 0.7279
5 16.51 0.3508 21.97 0.5676 24.14 0.6408 22.01 0.5262 23.22 0.5909
1 13.50 0.2329 19.25 0.4516 22.44 0.5531 19.62 0.4033 21.45 0.4976
In Tables 7 and 8, the Jet Plane and Walk Bridge images, respectively, are corrupted with salt and pepper noise of different percentages varying from 5% to 40%. As depicted in these two tables, the median filter has the superior performance over the other filters in removing this type of noise. It should be noted that the median filter has a better performance in removing salt and pepper noise than the averaging filter since the median value, in general, is much less sensitive to outliers than the average (mean) value.
Table 7. PSNR in dB and SSIM of Restored Jet Plane Image After being Corrupted with Salt & Pepper Noise of Different Densities Using Several Filters (D=noise density)
Jet Plane image corrupted with salt &
pepper noise Wiener Filter (5x5) Gaussian Filter (5x5) Median Filter (5x5) Averaging Filter (5x5) D PSNR SSIM PSNR SSIM PSNR SSIM PSNR SSIM PSNR SSIM 5% 17.94 0.3479 23.33 0.5711 26.72 0.6712 29.31 0.8864 24.66 0.6868 10% 14.93 0.1887 21.41 0.4720 23.96 0.5285 28.51 0.8807 23.30 0.5895 15% 13.13 0.1286 20.36 0.4140 22.09 0.4412 27.73 0.8734 21.99 0.5240 20% 11.91 0.0973 19.51 0.3709 20.55 0.3772 26.58 0.8643 20.84 0.4716 25% 10.95 0.0771 18.73 0.3392 19.37 0.3317 25.44 0.8549 19.77 0.4249 30% 10.17 0.0640 17.98 0.3117 18.28 0.2950 24.63 0.8448 18.82 0.3898 35% 9.45 0.0522 17.21 0.2898 17.41 0.2668 23.83 0.8334 17.99 0.3561 40% 8.90 0.0430 16.61 0.2674 16.53 0.2371 23.08 0.8165 17.11 0.3289
Table 8.PSNR in dB and SSIM of restored Walk Bridge Image After being Corrupted with salt and Pepper Noise of Different Densities Using Several Filters (D=noise density)
Walk Bridge image corrupted with salt &
pepper noise Wiener Filter (5x5) Gaussian Filter (5x5) Median Filter (5x5) Averaging Filter (5x5) D PSNR SSIM PSNR SSIM PSNR SSIM PSNR SSIM PSNR SSIM 5% 18.26 0.5118 22.26 0.5329 24.59 0.6755 24.22 0.6212 22.73 0.5222 10% 15.25 0.3216 20.91 0.4603 22.90 0.5834 24.04 0.6161 22.00 0.4799 15% 13.55 0.2300 20.11 0.4121 21.59 0.5132 23.70 0.6088 21.19 0.4364 20% 12.27 0.1731 19.38 0.3733 20.42 0.4519 23.51 0.6034 20.46 0.4013 25% 11.27 0.1341 18.78 0.3410 19.43 0.4011 23.15 0.5945 19.76 0.3713 30% 10.48 0.1082 18.28 0.3199 18.59 0.3587 22.79 0.5854 19.09 0.3447 35% 9.81 0.0897 17.70 0.2910 17.83 0.3215 22.38 0.5737 18.44 0.3189 40% 9.23 0.0738 17.22 0.2649 17.12 0.2906 21.88 0.5581 17.79 0.2915 4. Conclusion
This paper is mainly focused on measuring the quality of some filters in removing some types of noise and which filter better suits eliminating each type of such noises using some common performance measuring indices. Several filters have been used to restore images corrupted with various types of noise. In particular, Wiener, Gaussian, median and averaging filters have been used to eliminate Gaussian noise, speckle noise, salt and pepper noise and Poisson noise. Simulation results for images corrupted with a wide range of noise quantities have been examined using both peak signal to noise ratio and structure similarity as performance measuring indices using the same size of sliding window. The results show that the four filters have almost comparable performance in eliminating Gaussian noise. The median filter has a superior performance in comparison with other filters in reducing salt and pepper noise, and has the worst performance for other types of noise. Wiener and Gaussian filters show good performance in restoring images corrupted with speckle and Poisson noise.
References
[1] Ma L, Moisan L, Yu J, A Dictionary Learning Approach for Poisson Image Deblurring, IEEE Transactions on Medical Imaging. 2013; 32(7): 1277-1289.
[2] Jin X, Xu Z, Hirakawa K, Noise Parameter Estimation for Poisson Corrupted Images Using Variance Stabilization Transforms, IEEE Transactions on Image Processing. 2014; 23(3):1329-1339.
[3] Figueiredo MA, Bioucas-Dias JM, Restoration of Poissonian Images Using Alternating Direction Optimization, IEEE Transactions on Image Processing. 2010; 19(12): 3133-3145.
[4] Wang W, He C. A Fast and Effective Algorithm for a Poisson Denoising Model With Total Variation,
IEEE Signal Processing Letters. 2017; 24(3): 269-273.
[5] Einicke GA, Iterative filtering and smoothing of measurements possessing Poisson noise, IEEE Transactions on Aerospace and Electronic Systems. 2015; 51(3): 2205-2011.
[6] Carlavan M, Blanc-Feraud L, Sparse Poisson Noisy Image Deblurring, IEEE Transactions on Image Processing. 2012; 21(4): 1834-1846.
[7] Dupe F, Fadili JM, Starck J, A Proximal Iteration for Deconvolving Poisson Noisy Images Using Sparse Representations, IEEE Transactions on Image Processing. 2009; 18(2): 310-321.
[8] Chen B, Liu Q, Sun X, Xu L, Shu H, Removing Gaussian noise for colour images by quaternion representation and optimisation of weights in non-local means filter, IET Image Processing. 2014; 8(10): 591-600.
[9] Camarena J, Gregori V, Morillas S, Sapena A, A Simple Fuzzy Method to Remove Mixed Gaussian-Impulsive Noise From Color Images, IEEE Transactions on Fuzzy Systems. 2013; 21(5): 971-978. [10] Liu W, Lin W, Additive White Gaussian Noise Level Estimation in SVD Domain for Images, IEEE
Transactions on Image Processing. 2013; 22(3): 872-883.
[11] Li Y, Shen L, Dai D, Suter BW, Framelet Algorithms for De-Blurring Images Corrupted by Impulse Plus Gaussian Noise, IEEE Transactions on Image Processing. 2011; 20(7): 1822-1837.
[12] Luisier F, Blu T, Unser M, Image Denoising in Mixed Poisson–Gaussian Noise, IEEE Transactions on Image Processing. 2011; 20(3): 696-708.
[13] Huang Y, Ng MK, Wen Y, Fast Image Restoration Methods for Impulse and Gaussian Noises Removal, IEEE Signal Processing Letters. 2009; 16(6): 457-460.
[14] Yahya N, Kamel NS, Malik AS, Subspace-Based Technique for speckle Noise Reduction in SAR Images, IEEE Transactions on Geoscience and Remote Sensing. 2014; 52(10): 6257-6271.
[15] Rabbani H, Vafadust M, Abolmaesumi P, Gazor S, Speckle Noise Reduction of Medical Ultrasound Images in Complex Wavelet Domain Using Mixture Priors, IEEE Transactions on Biomedical Engineering. 2008; 55(9): 2152-2160.
[16] Andria G, Attivissimo F, Lanzolla AM, Savino M, A Suitable Threshold for Speckle Reduction in Ultrasound Images, IEEE Transactions on Instrumentation and Measurement. 2013; 62(8): 2270-2279.
[17] Ni W, Gao X, Despeckling of SAR Image Using Generalized Guided Filter With Bayesian Nonlocal Means, IEEE Transactions on Geoscience and Remote Sensing. 2016; 54(1): 567-579.
[18] Koundal D, Gupta S, Singh S, Speckle reduction method for thyroid ultrasound images in neutrosophic domain, IET Image Processing. 2016; 10(2): 167-175.
[19] Duan F, Zhang Y, A highly effective impulse noise detection algorithm for switching median filters,
IEEE Signal Processing Letters. 2010; 17(7): 647-650.
[20] Ibrahim H, Kong NS, Ng TF, Simple adaptive median filter for the removal of impulse noise from highly corrupted images, IEEE Transactions on Consumer Electronics. 2008; 54(4): 1920-1927.
[21] Ramadan ZM, Efficient Restoration Method for Images Corrupted with Impulse Noise, Circuits, Systems, and Signal Processing. 2012; 31(4): 1397-1406.
[22] Ramadan ZM, Monochromatic-Based Method for Impulse Noise Detection and Suppression in Color Images, Circuits, Systems, and Signal Processing. 2013; 32(4): 1859-1874.
[23] Ramadan ZM, A New Method for Impulse Noise Elimination and Edge Preservation, Canadian Journal of Electrical and Computer Engineering. 2014; 37(1): 2-10.
[24] Veerakumar T, Jagannath RP, Subudhi BN, Esakkirajan S, Impulse Noise Removal Using Adaptive Radial Basis Function Interpolation, Circuits, Systems, and Signal Processing. 2017; 36(3): 1192-1223.
[25] Ramadan ZM, Salt-and-Pepper Noise Removal and Detail Preservation Using Convolution Kernels and Pixel Neighborhood, American Journal of Signal Processing. 2014; 4(1): 16-23.
[26] Milanfar P, A Tour of Modern Image Filtering: New Insights and Methods, Both Practical and Theoretical, IEEE Signal Processing Magazine. 2013; 30(1): 106-128.
[27] Wang Z, Bovik AC, Sheikh HR, Simoncelli EP, Image Quality Assessment: From Error Visibility to Structural Similarity, IEEE Transactions on Image Processing. 2004; 13(4): 600-612.