Agglomeration externalities and technical efficiency in
French pig production
Solène LARUE, Laure LATRUFFE
Working Paper SMART – LERECO N°09-10
May 2009
UMR INRA-Agrocampus Ouest SMART (Structures et Marchés Agricoles, Ressources et Territoires) UR INRA LERECO (Laboratoires d’Etudes et de Recherches Economiques)
Agglomeration externalities and technical efficiency in French pig
production
Solène LARUE
INRA, UMR1041 CESAER, F-21000 Dijon, France ENESAD, UMR1041, F-21000 Dijon, France
Laure LATRUFFE
INRA, UMR1302, F-35000 Rennes, France Agrocampus Ouest, UMR1302, F-35000 Rennes, France
Acknowledgements
This research was supported by the French National Agency of the Research (ANR) program “Systems of Animal Production and Sustainable Development” (SPADD). The authors thank the French Institute of Pork Sector (IFIP), notably Michel Rieu, for data and comments and Carl Gaigné for helpful ideas.
Auteur pour la correspondance / Corresponding author Solène LARUE
UMR CESAER, INRA
26 Bd Docteur Petitjean, BP 87999 21079 Dijon cedex, France
Email: Solene.Larue@enesad.inra.fr
Téléphone / Phone: +33 (0)3 80 77 24 42 Fax: +33 (0)3 80 77 25 71
Agglomeration externalities and technical efficiency in French pig production
Abstract
The objective of the paper is to assess the effects of spatial agglomeration on the technical efficiency of French pig farms. We use a two-stage method with the first stage consisting of calculating the efficiency scores of pig activity with the non-parametric Data Envelopment Analysis (DEA) method, and the second stage being a regression of these scores on agglomeration variables. Data consist of 936 French pig producers in 2004. Results suggest that these farms were as much affected by positive agglomeration externalities (in the form of knowledge spillovers due to the density of farms, and arising from their closeness to downstream markets) as any other businesses. Our analysis also sheds light on the specificity of the sector, namely that environment pressures can force pig farmers to be more efficient, an effect that may be counteracted when legal dispositions relating to manure spreading are too stringent.
Keywords: technical efficiency, Data Envelopment Analysis, agglomeration, environmental regulation, hog production, France
Externalités d’agglomération et efficacité technique dans la production porcine française
Résumé
L’objectif est d’évaluer les effets de l’agglomération spatiale sur l’efficacité technique des exploitations porcines françaises. Nous utilisons une approche en deux étapes. Dans la première étape, nous calculons les scores d’efficacité de l’activité porcine avec la méthode non-paramétrique “Data Envelopment Analysis” (DEA; Analyse d’Enveloppement des Données). La deuxième étape consiste en une régression de ces scores sur des variables d’agglomération. Les données utilisées sont celles de 936 producteurs porcins en 2004. Les résultats suggèrent que ces exploitations ont été autant affectées par des externalités positives d’agglomération (provenant de la diffusion des connaissances facilitée par la densité d’exploitations, ou de la proximité des exploitations avec les marchés d’aval) que n’importe quel autre type d’entreprise. Notre analyse montre, de plus, qu’il y a une spécificité du secteur porcin : les pressions environnementales peuvent inciter les exploitants à être plus efficaces ; néanmoins, si les règlementations environnementales liées à l’épandage de lisier sont trop contraignantes, cet effet est neutralisé.
Mots-clefs : efficacité technique, Analyse d’Enveloppement des Données, agglomération, règlementations environnementales, production porcine, France
Agglomeration Externalities and Technical Efficiency in French Pig Production
1. Introduction
Agglomeration economies are an increasing function of the number of firms and a decreasing function of distance between them. The presence of specialized local markets for labor and the links with upstream and downstream sectors, amongst other things, can cause some concentration phenomena. The most frequently cited sources of positive agglomeration externalities are knowledge spillovers, specialized labor supply, demand matching, and input sharing (Duranton and Puga, 2004). These mechanisms can create some increasing external economies of scale producing agglomeration, and can be divided into pecuniary and technical externalities. On the one hand, pecuniary externalities operate through prices because of industrial and spatial inter-dependencies. On the other hand, technical externalities can result from the spatially bounded diffusion of information and knowledge through contacts between producers and labor turnover. Thus, these pecuniary or technical externalities can affect location and production decisions. Although previous literature provides evidence of how agglomeration economies can have positive effects on the technical efficiency of an industry, the specific issue of agglomeration effects on technical efficiency in agriculture has rarely been investigated. Cohen and Morrison Paul (2005) have provided evidence of cost economies associated with localization and agglomeration for food manufacturing firms in the United States (US). However, the effects of agglomeration on technical efficiency itself in agriculture have only been investigated by Tveteras and Battese (2006) for aquaculture. Our paper will contribute to this thin literature and focuses on pig production, an interesting sector to study as it might be subject to both positive and negative externalities implied by spatial concentration.
The organization of pig production has evolved considerably since the 1960s in different countries such as Canada, Denmark, France, Germany, and the US. The productivity of pig producers has substantially increased and, in parallel, pig production has become more and more spatially concentrated. Our study focuses on French production, where the dynamism of the sector, as in other countries such as Denmark for example, was driven by producer groups, marketing and technical cooperatives among producers. French producer groups marketed as much as 90 percent of the production in 2000 against only 31 percent in 1972. Following the creation of these producer groups facilitation commercialization, pig production in France increased from 1.1 million tons in 1962 to 1.5 in 1985 and 2.3 in 2000, and from the 1980s
onwards the farms steadily expanded their size. Small farms are disappearing gradually: there were 250,000 in 1969 against 65,000 in 2000. Pig farms of more than 100 sows, which were not numerous in the 1960s, represented one third of all pig farms in 1988 and more than 70 percent in 2000. At the same time, there was a geographical concentration of the production, mostly in the West. Today the Western regions (Brittany, Pays de la Loire, and Basse-Normandie) represent three quarters of the workforce in pig production. Brittany, in particular, accounted for 55 percent of this workforce in 2000, against 30 percent in 1969. French pork production has expanded during the last decades, while at the same time both structural and geographical changes have occurred. Today, pig farms have become more specialized and larger, and have become more and more concentrated in specific areas in order to benefit from a more favorable technical and economic environment and increased productivity. However, more recently concentration seems to have had harmful consequences. The manure from intensive pig production causes pollution, and environmental regulations in France now require that pig producers spread their manure on a minimum area of land. The negative externality of pollution caused by larger farm agglomeration now implies increasing competition for land in pig production. Environmental pressures weigh more and more on the development and decisions of pig producers, and need to be taken into account in the analysis of the impact of agglomeration on pig farm technical efficiency.
The objective of our paper is to assess the effects of agglomeration on the technical efficiency of French pig farms. For this, we employ the non-parametric Data Envelopment Analysis (DEA) to calculate farm efficiency scores in the first stage, and in a second-stage regression we investigate the impact of agglomeration based on theoretical expectations. Using data about pig activity for 936 French farms in 2004, our results show that farm technical efficiency is as much increased by agglomeration as it is the case for other businesses. Reasons may be knowledge spillovers, labor force matching and proximity to upstream and downstream markets. By contrast, the analysis did not reveal any clear-cut conclusion regarding the sign of the agglomeration effects due to environmental pressures.
The paper is structured as follows. The next section provides some background and explains our theoretical expectations. Section 3 describes the methodology, while section 4 presents the data used. Section 5 discusses the results and Section 6 summarizes them.
2. Background
2.1. Agglomeration and productivity gains
Productivity gains induced by the geographical concentration of firms are a standard result in the economic geography literature, which details the nature and sources of these positive externalities. Explanations are derived from Marshall’s externalities concept in the 1920s, and suggest that producers within the same industry agglomerate to gain advantages that arise from localized knowledge spillovers, labor market pooling, and availability of specialized input and services (Fujita and Thisse, 2002). The underlying microeconomic mechanisms of agglomeration are sharing, matching, and learning processes (Duranton and Puga, 2004), which generate increasing external economies of scale that cause agglomeration. Positive spatial externalities in pig production may arise from: access to inputs (e.g. feed processing plants and veterinary services); diffusion of information and knowledge through producer organizations and farming extension services; and the pooling of skilled workers for the pig production activity. During the last decades, although a profusion of theoretical analyses (from Henderson, 1974, to Fujita and Thisse, 2002) have considered agglomeration externalities as an explanation of productivity gains, empirical studies have only lately appeared to confirm these expectations. The existing empirical literature about the link between firm agglomeration and firm productivity has been comprehensively reviewed in previous surveys by Rosenthal and Strange (2004) or Henderson et al. (2001) among others. Econometric studies of the effects of agglomeration on productivity have been conducted almost exclusively for manufacturing industries and have relied on production function estimation on aggregate data. Findings include, for example: that the clustering of similar firms may improve labor market matches due to larger and higher quality pool of workers (“labor pooling” described by Henderson, 2003); that the positive spatial spillovers from labor imply more efficient production when it is spatially concentrated (e.g. Ciccone and Hall, 1996); and that the proximity to input suppliers and to output purchases induced productivity gains (e.g. Morrison Paul and Siegel, 1999).
Within this empirical literature, the specific issue of agglomeration effects on technical efficiency in the pig sector has never been investigated. The main references relating to agriculture up till the present time are the paper by Cohen and Morrison Paul (2005), about food manufacturing, and the study by Tveteras and Battese (2006), which deals with aquaculture.
Cohen and Morrison Paul (2005) evaluate the cost economies arising from agglomeration and examine their impact on the location decisions in the food manufacturing sector. Estimating cost and input demand equations using data of food processing industries in 48 contiguous states in the US, the authors measure agglomeration economies. In order to evaluate the benefits (or cost) of proximity, the authors integrate, as proxies for agglomeration (spatial and industrial) externalities, the food processing industry output in neighboring states, the own-state output, and the accessibility to agricultural input. The authors find that diverse cost economies across the food manufacturing processors in the US states are substantive but differ across the regions and give motivations on the margin of location decisions.
This article is the first one to study the issue of agglomeration related to the agricultural sector, but uses aggregated data. However, as underlined by Rosenthal and Strange (2004), the main challenge in spatial economics is to go beyond the analysis of economic agglomeration based on data that are geographically aggregated, and to estimate the benefits of agglomeration in terms of economic performance at the plant level.
In this respect, the study by Tveteras and Battese (2006) is a cornerstone paper for the agricultural sector. The authors examine the influence of agglomeration externalities at the regional level on the productivity of Norwegian salmon farming. Estimating a stochastic frontier production function on an unbalanced sample of 577 salmon farms during the period 1985-1995, the authors distinguish between the effects on the production possibility frontier (the hypothesis being that information spillovers lead to technological progress) and those on the technical inefficiency (the hypothesis being that knowledge spillovers enable farms to reduce their optimization errors). In their econometric model, the authors integrate two explanatory variables, namely regional size of industry and regional density of farms, in order to investigate how agglomeration externalities influence technological change as well as technical efficiency. They find that an increase in industry regional size leads to technological progress, and that farms located in regions with larger industry are more technically efficient. On the other hand, farm regional density has a negative effect on the shift of the frontier, but a positive effect on technical efficiency. The authors conclude that there are positive externalities due to the transfers of knowledge and to an increased supply of specialized production factors, but negative externalities of congestion through fish diseases.
In this paper, as in the study by Tveteras and Battese (2006), we use farm-level data to investigate the link between agglomeration and farm technical efficiency. Our contributions are twofold. Firstly, we use a different method from Tveteras and Battese, namely DEA, in
order to calculate scale efficiency in addition to technical efficiency. Secondly, we account for the effect of environmental regulations on efficiency.
2.2. Environmental regulations and pig production
The agglomeration of livestock production induces negative environmental externalities in the form of water, soil, and air pollution. In France in particular, increased pollution created by the agglomeration of livestock farms has prompted the government to issue environmental regulations requiring that manure must be spread on cropland with a specific threshold per hectare (ha). Other regulations relate to farm expansion limits and time limits to spread the manure, with the intention of reducing negative externalities on the local population, related to odors and other ambient effects. Such regulations may have two opposite effects on pig producers’ performance.
On the one hand, regulations create incentives for livestock producers to reduce their production and rationalize their input use, in order to decrease the amount of manure produced. This has been firstly formulated by the Porter’s hypothesis, which argues that environmental regulations might lead to improved competitiveness (Porter and Van der Linde, 1995). Indeed, if farms face no constraint, they may not feel the pressure to change their input choice decisions or input-output combination and may thus remain inefficient. Evidence of this effect is given by Piot-Lepetit and Le Moing (2007), who analyze the relationship between technical efficiency and environmental regulation in the French pig sector over a 5-year period (1996-2001). The authors find that the relationship is positive, highlighting the absorption of inefficiency due to changes in the production process. In Taiwan, Yang et al. (2008) also investigate the impact of environmental regulations for 31 swine farms in 2003-2004, following the 1987 governmental law that limits the level of pollutants in wastewater from pig farms. Results show, however, no clear conclusions regarding the impact of this law on pig farms’ technical efficiency.
On the other hand, regulations may decrease pig farms’ performance. One reason is that regulations may imply increasing competition for land: since the quantity of manure produced increases with increased pig production, farmers must spread larger levels of manure while land is a limited resource. Le Goffe and Salanie (2005) give evidence of this increased competition for land, as they show, theoretically and empirically in Brittany, that land prices increase with pig density. They explain these results by the capitalization in land prices of the manure quota, that is to say the authorized limit of nitrogen. The local population may also
add to environmental pressures on pig farms, as urbanization creates an additional competition for land. Another reason for reduced performance on pig farms is that producers may have to spread the manure on more and more distant land if the land availability around them is limited. This may result in sub-optimal input allocation, in terms of conflicting labor tasks or machinery uses, and therefore in lower efficiency. This effect would be more and more pronounced with more and more stringent regulation. On this matter, Metcalfe (2001) analyzes the effect of state water quality regulatory stringency on pig production in the US. The author points out that environmental compliance costs are significant for small pig farms, while production on large farms does not appear to be influenced by the level of environmental stringency.
Based on existing literature and the background of the pig sector in France, we formulate three theoretical expectations.
1) The agglomeration of farms has a positive influence on their technical efficiency, in the way that farmers’ spatial proximity facilitates their relationships, and may create knowledge spillovers (information, social capital, etc.) and matching labor force possibilities.
2) The closeness of farms to upstream and downstream sectors has a positive influence on technical efficiency. Concentration of the pig sector is largely due to integrations which are as much horizontal as vertical. While horizontal integration refers to spatial agglomeration of farms, vertical integration means that several processes (from production to commercialization) may be realized in the same place: producer groups often have their own slaughterhouses and many spatial linkages with input suppliers. We expect that better market access increases technical efficiency because of input sharing (upstream sector: industrial or non-industrial pig feed) and demand matching (downstream sector: capacity of slaughterhouses).
3) The first two expectations deal with positive externalities from agglomeration. Agglomeration may also give rise to negative externalities, in the form of pollution, to which the French government has responded with environmental regulations. As explained above, the effect of such regulations on technical efficiency may be positive (Porter’s hypothesis) or negative. Therefore, we do not have a priori expectation of the effect. We can only acknowledge that agglomeration, while it may have a positive (direct) effect on farm efficiency (expectations 1 and 2), may also have a negative (indirect, through regulations) effect.
3. Methodology
The concept of efficiency relates to the distance of a firm from the production frontier. Technical efficiency refers to a physical notion, independent of input and output prices as well as the availability of inputs1. It indicates whether a firm is able to attain the maximum outputs from a given set of inputs. Clearly, the closer to the frontier a firm operates, the more technically efficient it is. Thus measuring efficiency implies measuring the potential input reduction or potential output increase, relative to a reference. A crucial issue is therefore to define this reference, that is to say, to construct the efficient frontier. For this, parametric and non-parametric methods are available to researchers. Both methods have advantages and shortcomings (see Murillo-Zamorano, 2004, for a review of both methods). In this paper, we use a non-parametric approach to define the frontier. Rather than specifying a production function with parametric methods, we construct the frontier in the output-input space by enveloping all observations of our sample. This choice is partly based on the fact that existing literature on agglomeration effects in agriculture (Cohen and Morrison Paul, 2005; Tveteras and Battese, 2006) has used parametric (stochastic) methods only; our non-parametric analysis will thus help confirm or infirm results of this literature. Another reason is that non-parametric methods allow technical inefficiency per se (the so-called “pure” technical efficiency) to be disentangled from scale inefficiency, that is to say inefficiency arising from sub-optimal production scale. Our intention is to assess whether agglomeration externalities influence both types of efficiency. In order to investigate the impact of agglomeration externalities on the technical (and scale) efficiency of pig farms, our analysis is carried out in two stages. In the first stage we calculate efficiency scores for each farm, while in the second stage we analyze the determinants of these scores.
3.1. First stage: calculation of technical efficiency
In the first stage, the non-parametric method DEA is used to calculate farm technical efficiency. Based on the distance concept of Farrell (1957), DEA constructs with linear programming a piece-wise frontier with the sample’s best performing data points, so that all observations of the sample lie on or below this efficient frontier (Charnes et al., 1978). The distance from a firm to the frontier enables its efficiency score to be calculated, which lies between zero and one. The higher the score, the higher the efficiency, while a firm located on
1 By contrast, a firm is allocatively efficient if its outputs and inputs maximize its profit (or minimize its cost) at given prices.
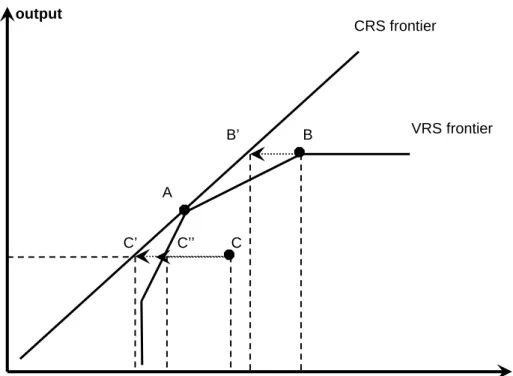
the frontier is identified as totally efficient and is attributed an efficiency score of one. As mentioned above, DEA allows the partition of technical efficiency (then called “total” technical efficiency) into pure technical efficiency and scale efficiency. Total technical efficiency is calculated assuming that firms operate under constant returns to scale (CRS). By contrast, the term pure technical efficiency is used when computing efficiency under variable returns to scale (VRS) and represents farming practices per se, regardless of the scale of production. The latter is assessed with the residual ratio between total (under CRS) technical efficiency and pure (under VRS) technical efficiency. This ratio represents the farm scale efficiency, and is also between zero and one. Farms operating at a suboptimal (too large or too small) scale of production have a scale efficiency score less than one, while farms with optimal scale have a score of one. Figure 1 illustrates the concepts of technical and scale efficiencies. CRS and VRS frontiers are depicted in a one output-one input dimension. All farms located on the VRS frontier are purely technically efficient, that is to say they are fully efficient disregarding their operational scale. This is the case of farms A and B, but not of farm C. In addition, farm A is located on the CRS frontier, indicating that, unlike B, it is totally technically efficiency (that is to say it has an optimal scale). The distance to the frontier illustrates a farm’s inefficiency, but efficiency scores are calculated as ratios. Relating to Figure 1, total (i.e. under CRS) and pure (i.e. under VRS) technical efficiencies of farm C are given by equations (1) and (2). Scale efficiency is given by the ratio between total technical efficiency and pure technical efficiency; thus, on the figure the scale efficiency score of farm C is given by equation (3). Equation (4) summarizes the link between the three types of efficiency.
Total technical efficiency of farm C (under CRS) = OcC OcC′ (1) Pure technical efficiency of farm C (under VRS) = OcC OcC′′ (2)
Scale efficiency of farm C = OcC OcC' ′′ (3)
Figure 1: DEA frontiers under CRS and under VRS
Source: after Coelli et al., 2005 (Figure 6.3)
Moreover, with DEA it is possible to identify under which returns to scale farms operate. Farms may operate under CRS meaning that they are scale efficient (this is the case when the total technical efficiency score is equal to the pure technical efficiency score, the ratio between both being equal to 1), or, for those that are not scale efficient, may have decreasing (DRS) or increasing returns to scale (IRS), indicating respectively that they operate under too large or too small production scale.
DEA has two alternative orientations: input and output. The input-oriented model calculates the proportional decrease in the use of inputs as output remains unchanged, while the output-oriented model computes the proportional increase in outputs that could be attained with constant inputs. We calculated efficiency scores using both orientations and found extremely similar results. We therefore present in this paper only results from the output orientation. Our DEA model is multi-output and multi-input. The outputs and inputs included depend on the type of pig producer. Pig producers may be separated into three or more types (e.g. three as in Azzam and Skinner (2007), or more as in Key and McBride (2007)) depending on
output input CRS frontier VRS frontier A B B’ IB’ IB C IC’ IC’’ IC C’ C’’ OC
whether farrowing, feeding, weaning, and finishing operations are carried out. In this paper, we follow Azzam and Skinner (2007) and assume that French pig producers can operate as a farrowing, a finishing, or a farrow-to-finish operation. Farrowing farms manage sows to produce small weanling pigs that are then sold after weaning, finishing farms obtain weanling pigs outside the farms and breed them to the slaughter weight, and farrow-to-finish farms farrow and finish pigs to the slaughter weight. The three types of farms differ in their production technologies, implying different inputs and outputs. Farrowing farms’ sole output is the number of piglets, while the number of swine is the sole output for finishing and farrow-to-finish farms. Regarding the inputs, the number of sows is an input for farrowing and farrow-to-finish farms, and the number of piglets is an input for farrow-to-finish and finishing ones. Other inputs, common to all three types of farms, include labor use, feed expenditures, depreciation, and other expenditures (energy, water, maintenance and repair, health expenditures, etc).
3.2. Second stage: impact of agglomeration on technical efficiency
In the second stage, the efficiency scores obtained in the first stage are regressed on several explanatory variables capturing agglomeration economies. Standard in the efficiency literature, the second-stage’s objective is to estimate the impact on efficiency of variables over which the farmer has no control. For example, in sectors such as hospital and transportation, these variables generally concern the type of firm (public or private), governmental regulations, location, etc. In agriculture, the variables used will be location and socioeconomic variables (such as the age of the farmer), as well as other variables which represent the quality of the production factors when it is available.
Three types of econometric models are generally used for the second-stage regression. The standard model used is Ordinary Least Squares (OLS). However, the bounded nature of DEA (bounded at 1) has prompted researchers to use other models that can take that into account. The literature is, however, not clear whether the efficiency distribution is censored at one, in which case a Tobit model can be preferred (e.g. Lissitsa and Odening, 2005; Davidova and Latruffe, 2007) or the distribution is truncated at one, in which case a truncated regression may be used (e.g. Simar and Wilson, 2007; Bojnec and Latruffe, 2009). What is certain, however, is that both limited dependent models may bring some biases in the results (Greene, 2000). Therefore, in general, OLS are used when only a low share of farms are on the frontier, that is to say when the bounded character of the distribution is not pronounced. This is the case with our sample (see section with results), and thus an OLS regression is performed.
More specifically, the following model (equation 5) is used for the estimations:
(
)
(
)
0 1 2 C 3 S 4 5 6 7 8
Y =
β β
+ MF+β
W +I C+β
W +I S+β
D+β
E+β
WE+β
P+β
FF+u (5) where:- Y is the farm’s efficiency score, which is in turn total technical efficiency (model 1), pure technical efficiency (model 2) and scale efficiency (model 3).
- MF is the regional production of pig feed (million tons) used as a proxy for the upstream sector to assess the influence of the farm’s closeness to this sector, and we expect it to be positive.
-
(
WC +I C)
is the non-industrial pig feed availability (in squared kilometers of cereal fields) in the farm’s own sub-county and in the neighboring sub-counties less than 100 kilometers away.(
WC +I C)
is a second upstream proxy that is also expected to have a positiveinfluence on farm efficiency. For W we use a distance decay function as C
ϕ
ij =dij−1, where dijis the physical distance in kilometers between capitals of sub-county i and sub-county j, if the distance is below 100 kilometers, otherwise ϕij is set to 0.
-
(
WS +I S)
is the slaughtering capacity (in thousand tons of meat) in the farm’s own sub-county and in the neighboring sub-counties.(
WS +I S)
proxies the sub-county’s accessibilityto slaughterhouses and represents the downstream sector effect (we assume that the production of the pig farm cannot be sold directly to consumers), which we expect to be positive. For W we use an inverse distance matrix. For the cut-off, we consider the minimum S
distance ensuring that each observation has at least one neighbor.
- D is the farm’s county’s density of pig farms (number of farms per hectare). It is a proxy for the agglomeration of farms, which we expect has a positive influence on technical efficiency, due to knowledge spillovers, matching labor force and input sharing possibilities.
- E is a proxy for environmental pressure in the farm’s own sub-county, and WE is its spatial lag in the neighboring sub-counties less than 100 kilometers. The environmental proxy E is calculated as the ratio of nitrogen quantity discharged by all livestock in the farm’s own sub-county over the available area for spreading manure (in kilograms per hectare). Values of E that are larger than the legally authorized limit of nitrogen (quota) of 170 kg/ha indicate that sub-counties are in excess and that their farmers need to find land in neighboring sub-counties
to spread their manure. By contrast, lower figures indicate more room for farmers located in this sub-county. Regarding its spatial lag WE, where we use a squared decay function with a cut-off of 100 kilometers (to take into account the high transport cost of manure), large values indicate an excess manure production in the farm’s neighboring sub-counties, forcing farmers to travel far to spread their own manure. As explained above, the overall influence of the environmental proxy and its spatial lag is ambiguous, due to two possible and opposite effects.
- P is the farm’s sub-county’s population (in thousand inhabitants), also proxying for environmental pressure, as well as competition for land, and thus also expected to play a negative role on farm efficiency;
- FF is a dummy equal to 1 for farrow-to-finish farms and 0 for other types of farms; - u is a normally distributed random term.
Agglomeration variables were tested at several administrative levels: municipality, sub-county (“Canton”), sub-county (“Département”, level 3 of the European NUTS2 classification), and region (“Région”, level 2 of the European NUTS classification). The final variables retained for inclusion in the model as explained in equation (5) above, are described in the next section. We do not include other explanatory variables often included in efficiency studies (such as human capital variables), as they are available for very few observations only and this would reduce the number of observations in the regression to only a few farms. The three sub-samples (farrowing, farrow-to-finish, and finishing) were merged for this second-stage estimation, as carrying out the regression on each separately did not return any significant findings. The merged sample therefore consists of 936 farms, and in total three regressions have been carried out on the whole sample, depending on the dependent variable (model 1, model 2, model 3).
4. Data
This study employs farm-level data from a technical survey and a bookkeeping survey of pig farms carried out by the French Institute of the Pig Sector (IFIP) in 2004. Both surveys included a large range of data about outputs, inputs, management, as well as technical and social variables, for a sample of about 3,600 farms (IFIP, 2006). Only farms that had non-missing and reliable information for the selected outputs and inputs are included in our DEA model. From this reduced sample of 936 farms, the three sub-samples (farrowing farms, farrow-to-finish farms, and finishing farms) are created, and one DEA frontier is constructed for each sub-sample.
Of the whole sample’s pig producers, 43.1 percent are located in NUTS 2 region Brittany and about 72 percent in Western NUTS 2 regions (Brittany, Pays de la Loire, Basse-Normandie, and Poitou-Charentes). Moreover, Midi-Pyrénées (in South East France) and the central regions (regrouping the three NUTS 2 regions Centre, Limousin, and Auvergne) gather respectively 8.4 percent and 9.3 percent of the sample farms. This is consistent with the location of pig production in France. Regarding the three orientations, 74 percent of the sample are farrow-to-finish farms (of which more than three quarters are located in Western regions), 9.5 percent are farrowing farms (concentrated more in NUTS 2 Centre and Poitou-Charentes) and 16.5 percent are finishing farms (located mainly in Western regions).
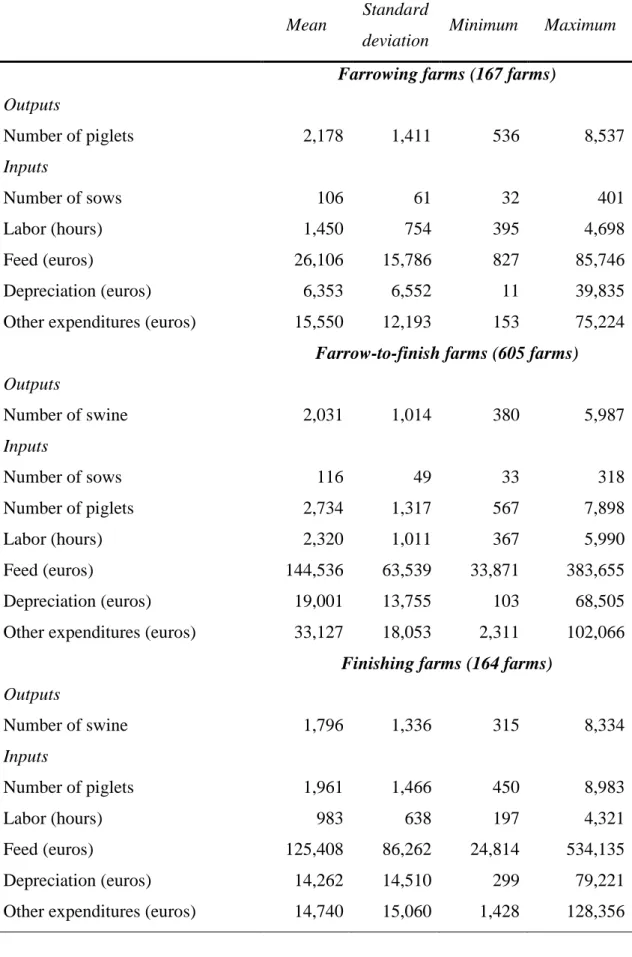
Descriptive statistics of the three sub-samples’ outputs and inputs used in the DEA are presented in Table 1. These outputs and inputs are for the porcine activity only, even for farms not fully specialized in pig production. Farrow-to-finish farms use much more of any input than farrowing farms, which is consistent with the fact that input values are calculated with the average input use per livestock head times the number of heads. Among all three orientations, finishing farms used, in general, less input.
Table 1: DEA outputs and inputs: descriptive statistics of the three sub-samples
Mean Standard
deviation Minimum Maximum Farrowing farms (167 farms)
Outputs Number of piglets 2,178 1,411 536 8,537 Inputs Number of sows 106 61 32 401 Labor (hours) 1,450 754 395 4,698 Feed (euros) 26,106 15,786 827 85,746 Depreciation (euros) 6,353 6,552 11 39,835
Other expenditures (euros) 15,550 12,193 153 75,224
Farrow-to-finish farms (605 farms) Outputs Number of swine 2,031 1,014 380 5,987 Inputs Number of sows 116 49 33 318 Number of piglets 2,734 1,317 567 7,898 Labor (hours) 2,320 1,011 367 5,990 Feed (euros) 144,536 63,539 33,871 383,655 Depreciation (euros) 19,001 13,755 103 68,505
Other expenditures (euros) 33,127 18,053 2,311 102,066 Finishing farms (164 farms)
Outputs Number of swine 1,796 1,336 315 8,334 Inputs Number of piglets 1,961 1,466 450 8,983 Labor (hours) 983 638 197 4,321 Feed (euros) 125,408 86,262 24,814 534,135 Depreciation (euros) 14,262 14,510 299 79,221
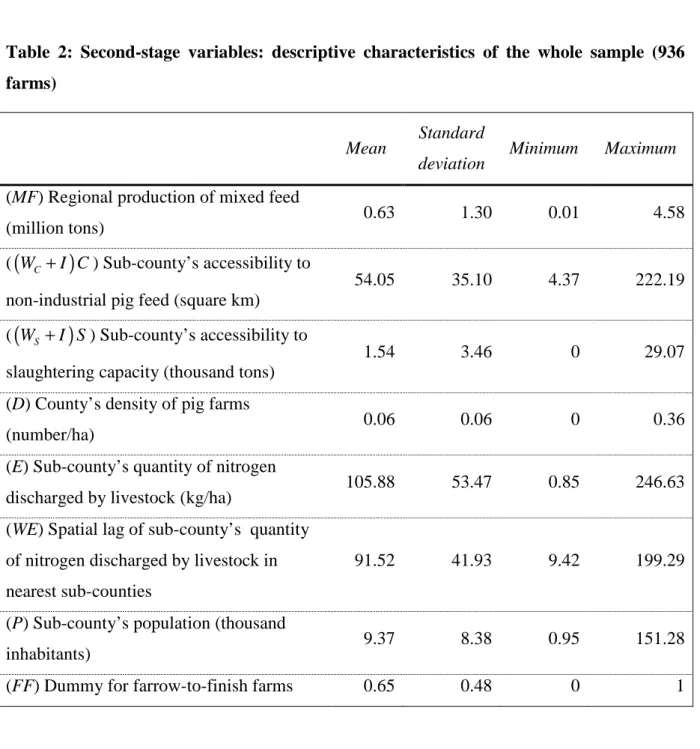
For the second-stage regression of efficiency scores, agglomeration variables at different administrative levels are calculated with data from the 1999 Agricultural Census and data from other surveys, which give detailed information about farm environment and upstream and downstream sectors. Descriptive statistics are provided in Table 2.
Table 2: Second-stage variables: descriptive characteristics of the whole sample (936 farms)
Mean Standard
deviation Minimum Maximum (MF) Regional production of mixed feed
(million tons) 0.63 1.30 0.01 4.58
(
(
WC +I C)
) Sub-county’s accessibility to non-industrial pig feed (square km)54.05 35.10 4.37 222.19
(
(
WS +I S)
) Sub-county’s accessibility to slaughtering capacity (thousand tons)1.54 3.46 0 29.07
(D) County’s density of pig farms
(number/ha) 0.06 0.06 0 0.36
(E) Sub-county’s quantity of nitrogen
discharged by livestock (kg/ha) 105.88 53.47 0.85 246.63
(WE) Spatial lag of sub-county’s quantity of nitrogen discharged by livestock in nearest sub-counties
91.52 41.93 9.42 199.29
(P) Sub-county’s population (thousand
inhabitants) 9.37 8.38 0.95 151.28
5. Empirical results
5.1. Total technical efficiency and its components
Descriptive statistics of total technical, pure technical and scale efficiency for the output-orientation are presented in Table 3. Due to the way DEA constructs the efficient frontier, the maximum score within the sample is unity for each DEA model. Therefore, only minima are reported in this table. The share of farms with efficiency score of unity, that is to say on the frontier, is also presented. Total technical efficiency scores are on average between 0.82 and 0.89, depending on the sub-sample. For example, the finishing sample has an average total technical efficiency score of 0.89. This score indicates that these farms can increase their outputs by 11 percent on average (difference between one and total technical score) and still use the same level of inputs. Despite this potential output increase, this sub-sample is the most efficient on average, in terms of total technical efficiency and pure technical efficiency. This suggests a larger homogeneity in farming practices within this sub-sample compared to the other two. Scale efficiency is high and similar for all specializations, with sub-sample’s averages between 0.97 and 0.98. Scale efficiency scores that are higher than pure technical efficiency scores indicate that the main source of inefficiency is sub-optimal scale. Indeed, the total potential output increase is given by the potential increase revealed by the pure technical efficiency score (difference between one and this score) plus the potential increase revealed by the scale efficiency score (difference between one and this score). For the finishing farms for example, on average, the total potential output increase of 11 percent is due to a potential output increase of 8 percent coming from pure technical inefficiency (score of 0.92) and a potential output increase of 3 percent coming from scale inefficiency (score of 0.97). This suggests that inefficiency due to sub-optimal scale is less than inefficiency due to farming practices per se (pure technical efficiency). The same conclusion applies to the other two sub-samples. Farrow-and-finish farms have the lowest average of pure technical efficiency, possibly due to the dual activity carried out by them, which may imply conflicts in input use. However, they have a similar scale efficiency average, suggesting similar space for scale economies. This partly confirms Azzam and Skinner’s (2007) findings for US hog production based on multistage cost estimations. The authors find that between 1988 and 1996, compared to stand-alone (farrowing or finishing) operations, joint farrowing and finishing operations imply scope economies, but that the latter cannot offset scale diseconomies at each operation level.
Table 3: Descriptive statistics of DEA efficiency scores Mean Standard deviation Minimum Share of farms with efficiency score of 1 (%) Total technical efficiency
Farrowing farms (167 farms) 0.82 0.13 0.43 13.2 Farrow-to-finish farms (605 farms) 0.82 0.12 0.39 5.6 Finishing farms (164 farms) 0.89 0.08 0.53 9.1
Pure technical efficiency Farrowing farms (167 farms) 0.85 0.13 0.45 22.2 Farrow-to-finish farms (605 farms) 0.84 0.12 0.44 9.6 Finishing farms (164 farms) 0.92 0.08 0.58 22.6 Scale efficiency Farrowing farms (167 farms) 0.97 0.06 0.60 14.4 Farrow-to-finish farms (605 farms) 0.98 0.03 0.74 12.9 Finishing farms (164 farms) 0.97 0.04 0.63 15.9
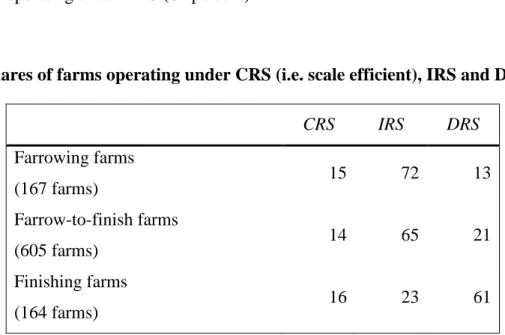
The shares of farms operating under CRS (i.e. farms that are scale efficient), IRS and DRS respectively, presented in Table 4, indicate that the majority of farms operated at sub-optimal scale of production: only 14 to 16 percent of farms operated at an optimal scale in the three sub-samples. Farrowing and farrow-to-finish farms operated mainly under IRS (72 and 65 percent respectively), that is to say farms were too small, suggesting that these orientations could gain efficiency by increasing their scale of production. By contrast, finishing farms
could improve their efficiency by decreasing their scale, as the majority of them were identified as operating under DRS (61 percent).
Table 4: Shares of farms operating under CRS (i.e. scale efficient), IRS and DRS (%)
CRS IRS DRS Farrowing farms (167 farms) 15 72 13 Farrow-to-finish farms (605 farms) 14 65 21 Finishing farms (164 farms) 16 23 61
5.2. The impact of agglomeration on farm efficiency
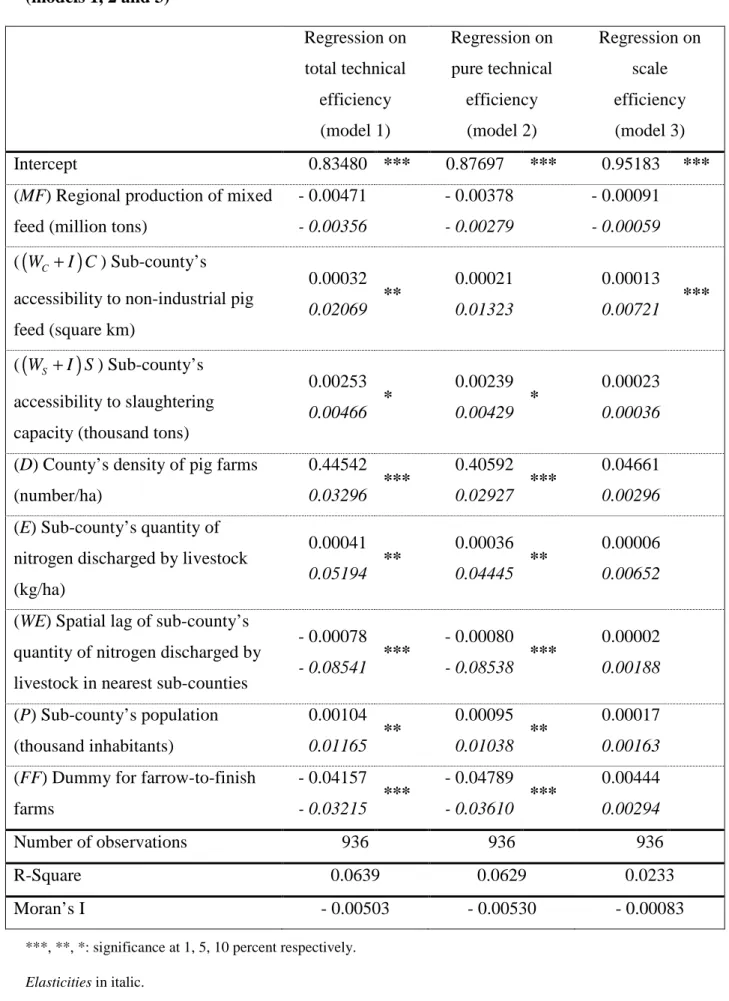
Table 5 reports the estimation results (coefficients and elasticities) based on the model described by equation (5). They show that the farrow-to-finish orientation is the least efficient in terms of total and pure technical efficiency, as the coefficient for the dummy variable is negative and significant (at 1 percent) in models 1 and 2. However, this sub-sample has no superiority in terms of optimal scale of production, as no significant influence of the dummy variable on scale efficiency is identified (model 3). This confirms the findings from Table 3. Regarding agglomeration effects, results in Table 5 suggest that they are present at various administrative levels and validate our theoretical expectations.
1) Our first theoretical expectation is confirmed, as a county’s pig farm density has a positive and significant influence on total and pure technical efficiency3. This suggests that proximity of farms increases knowledge spillovers, and is consistent with the study by Tveteras and Battese (2006) on salmon farms.
2) The second theoretical expectation regarding market access is confirmed for the downstream market: the accessibility to slaughterhouses has a positive and significant impact on technical efficiency. Regarding the upstream market, although regional production of
3 We tested the same three models using the sub-county’s density of pig farms and its spatial lag instead of the county’s density of pigs, and obtained the same findings.
mixed feed has no significant impact, available non-industrial pig feed plays a positive role, as expected. In addition, the positive coefficient of farm density validates such positive agglomeration effect on input sharing.
3) Regarding the effect of environmental regulations, the sign is ambiguous and we had no a priori expectation. The theoretical ambiguous effect is confirmed by ambiguous findings. On the one hand, the quantity of nitrogen discharged per hectare in the farm’s own sub-county has a significant positive effect on technical efficiency, indicating that in sub-counties where pollution is much higher than the authorized level, farms are more efficient. This is opposite to the expectation that increased competition for land may constrain farmers’ production decisions. Instead, our findings indicate that environmental constraints force farms to rationalize their production, confirming Porter’s hypothesis. The positive and significant coefficient of the population in the sub-county where the farm is located suggests also that neighborhood pressure forces farms to adopt efficient production decisions. However, on the other hand, the spatial lag of the nitrogen quantity ratio negatively influences farms’ technical efficiency, suggesting that traveling to further arable fields to spread their manure constrains farmers in their input decisions, giving support for the negative impact of the regulation stringency on farm performance.
Spatial autocorrelation may affect the regression results. For this reason, we used Moran’s I test to analyze the spatial clustering of each variable used in the regressions and to evaluate regression residuals. Spatial autocorrelation measures the extent to which the occurrence of an event in an areal unit is linked to the occurrence of an event in a neighboring areal unit: if there is any systematic pattern in the spatial distribution of a variable, it is said to be spatially autocorrelated (Cliff and Ord, 1981). We used a first-order neighborhood structure such that only spatial units that shared a common boundary were considered as neighbors. A value above the theoretical mean of −1/
(
n−1)
(where n is the number of observations in the sample) indicates positive spatial autocorrelation while a value below indicates negative spatial autocorrelation. The spatial distribution of the variable values is predictable when autocorrelation values are significant at 5 percent level. The inference is based on the normality assumption. Our results indicate that the null hypothesis of a random spatial distribution cannot be rejected: the test indicates an absence of spatial autocorrelation in our regressions, and thus a spatial independence of observations.Table 5: Influence of agglomeration on efficiency: results of the three OLS regressions (models 1, 2 and 3) Regression on total technical efficiency (model 1) Regression on pure technical efficiency (model 2) Regression on scale efficiency (model 3) Intercept 0.83480 *** 0.87697 *** 0.95183 ***
(MF) Regional production of mixed feed (million tons)
- 0.00471 - 0.00356 - 0.00378 - 0.00279 - 0.00091 - 0.00059 (
(
WC+I C)
) Sub-county’saccessibility to non-industrial pig feed (square km) 0.00032 0.02069 ** 0.00021 0.01323 0.00013 0.00721 *** (
(
WS +I S)
) Sub-county’s accessibility to slaughtering capacity (thousand tons)0.00253 0.00466 * 0.00239 0.00429 * 0.00023 0.00036 (D) County’s density of pig farms
(number/ha) 0.44542 0.03296 *** 0.40592 0.02927 *** 0.04661 0.00296 (E) Sub-county’s quantity of
nitrogen discharged by livestock (kg/ha) 0.00041 0.05194 ** 0.00036 0.04445 ** 0.00006 0.00652 (WE) Spatial lag of sub-county’s
quantity of nitrogen discharged by livestock in nearest sub-counties
- 0.00078 - 0.08541 *** - 0.00080 - 0.08538 *** 0.00002 0.00188 (P) Sub-county’s population (thousand inhabitants) 0.00104 0.01165 ** 0.00095 0.01038 ** 0.00017 0.00163 (FF) Dummy for farrow-to-finish
farms - 0.04157 - 0.03215 *** - 0.04789 - 0.03610 *** 0.00444 0.00294 Number of observations 936 936 936 R-Square 0.0639 0.0629 0.0233 Moran’s I - 0.00503 - 0.00530 - 0.00083
***, **, *: significance at 1, 5, 10 percent respectively.
Table 5 indicates that there is no agglomeration effect on scale efficiency, except for a sub-county’s availability of non-industrial feed. This might be explained from a methodological point of view: scale efficiency scores are very high for most of the farms, and therefore the variation in the dependent variable might not be sufficiently large. Another explanation might be that farm individual characteristics, in particular the initial size, influence scale efficiency more than aggregate characteristics do. This is supported by Table 6, which presents the correlation coefficients between farms’ utilized agricultural area and their three efficiency scores (total technical, pure technical, scale). This investigation was carried out on a reduced sample of 227 farms only (out of 936) as the land area was available for a limited number of farms. For this reduced sample, the average area is 85 ha, with a minimum of 0 ha and a maximum of 500 ha. Table 5 shows that the relationship between a farm’s area and scale efficiency is statistically significant. The coefficient is positive, suggesting that larger farms are more scale efficient.
Table 6: Correlation between farms’ efficiency and utilized agricultural area (227 observations) Total technical efficiency Pure technical efficiency Scale efficiency Spearman coefficient 0.1156 0.0946 0.1487 Probability 0.0822 * 0.1553 0.0251 **
***, **, *: significance at 1, 5, 10 percent respectively
6. Summary
This paper has investigated the impact of agglomeration on the technical efficiency of French pig producers in 2004, using the non-parametric method DEA and a second-stage econometric regression. Results indicate that technical efficiency is affected by agglomeration in several ways. Agglomeration externalities that have a positive effect on farm technical efficiency are in the form of knowledge spillovers facilitated by the spatial proximity of farms, and in the form of closeness to upstream (in terms of accessibility to cereals) and downstream (in terms of slaughterhouse capacity) markets. An ambiguous impact was expected from environmental regulations relating to manure spreading, that could potentially
constrain farmers in their production decisions and in their demand for land. Our empirical results show that, on the one hand, regulations and local population pressure may force farmers to rationalize their production (Porter’s hypothesis) and become more efficient. However, on the other hand, environmental regulations may also be too stringent and result in misallocation of inputs and lower efficiency.
Although our paper can be extended in different ways, our analysis is the first one that deals with the role of geographical concentration a farm’s technical efficiency. It has shown that the theory applies as much to farms as other businesses, with a farm’s performance increasing with agglomeration because of knowledge spillovers, matching labor force, and easier access to upstream and downstream sectors. It has also shed light on the specificity of this sector, namely the environmental externalities induced by agglomeration and the resulting governmental regulations possibly affecting a farm’s performance.
References
Azzam A., Skinner C.S. (2007). Vertical economies and the structure of U.S. hog farms. Canadian Journal of Agricultural Economics, 55(3): 349-364.
Bojnec S., Latruffe L. (2009). Determinants of technical efficiency of Slovenian farms. Post-Communist Economies, 21(1): 117-124.
Charnes A., Cooper W.W., Rhodes E. (1978). Measuring the efficiency of decision making Units. European Journal of Operational Research, 2: 429-444.
Ciccone A., Hall R.E. (1996). Productivity and the density of economic Activity. The American Economic Review, 86(1): 54-70.
Cliff A.D., Ord J.K. (1981). Spatial Processes: Models and Applications, Pion.
Coelli T., Rao D., O’Donnell C., Battese G. (2005). An Introduction to Efficiency and Productivity Analysis, second edition, Springer.
Cohen J.P., Morrison Paul C.J. (2005). Agglomeration economies and industry location decisions: the impacts of spatial and industrial spillovers. Regional Science and Urban Economics, 35(3): 215-237.
Davidova S., Latruffe L. (2007). Relationship between technical efficiency and financial management for Czech Republic farms. Journal of Agricultural Economics, 58(2): 269-288.
Duranton G., Puga D. (2004). Micro-Foundations of Urban Agglomeration Economics, in Henderson J.V., Thisse, J.F. (eds), Handbook of Regional and Urban Economics, vol. 4, Ch. 48, North-Holland: 2063-2117.
Farrell M.J. (1957). The measurement of productive efficiency. Journal of the Royal Statistical Society. Series A General, 120(3): 253-281.
Fujita M., Thisse J.F. (2002). Economics of Agglomeration, Cambridge University Press. Greene W. (2000). Econometric Analysis, fourth edition, Prentice Hall, New Jersey.
Henderson V. (1974). The sizes and types of cities. American Economic Review, 64(4): 640-656.
Henderson V. (2003). Marshall’s scale economies. Journal of Urban Economics, 43: 1-28. Henderson V., Shalizi Z., Venables A. (2001). Geography and development. Journal of
Economic Geography, 1(1): 81-105.
IFIP. (2006). Le Porc par les Chiffres 2006, Institut de la Filière Porcine, France.
Key N., McBride W. (2007). The Changing Economics of U.S. Hog Production. Economic Research Report Number 52, ERS USDA, December.
Le Goffe P., Salanie J. (2005). Le droit d’épandage a-t-il un prix ? Mesure sur le marché foncier. Cahiers d’Economie et Sociologie Rurales, 77: 36-63.
Lissitsa A. and Odening M., 2005. Efficiency and total factor productivity in Ukrainian agriculture in transition, Agricultural Economics, 32(3): 311-325.
Metcalfe M. (2001). U.S. Hog Production and the Influence of State. Water Quality Regulation. Canadian Journal of Agricultural Economics, 49: 37-52.
Morrison Paul C., Siegel D. (1999). Scale economies and industry agglomeration externalities: A dynamic cost function approach. American Economic Review, 89(1): 272-290.
Murillo-Zamorano L. (2004). Economic efficiency and frontier techniques, Journal of Economic Surveys, 18(1): 33-77.
Piot-Lepetit I., Le Moing M. (2007). Productivity and environmental regulation: the effect of the nitrates directive in the French pig sector. Environmental and Resource Economics, 38: 433-446.
Porter M.E., Van der Linde C. (1995). Towards a new conception of the environmental- competitiveness relationship. Journal of Economic Perspectives, 9: 97-118.
Rosenthal S.S., Strange W.C. (2004). Evidence on the Nature and Sources of Agglomeration Economies, in Henderson J.V., Thisse, J.F. (eds), Handbook of Regional and Urban Economics, vol. 4, Ch. 49, North-Holland: 2119-2171.
Simar L., Wilson P. (2007). Estimation and inference in two-stage, semi-parametric models of production processes. Journal of Econometrics, 136(1): 31-64.
Tveteras R., Battese G.E. (2006). Agglomeration externalities, productivity, and technical inefficiency. Journal of Regional Science, 46(4): 605-625.
Yang C.C., Hsiao C.K., Yu M.M. (2008). Technical efficiency and impact of environmental regulations in farrow-to-finish swine production in Taiwan. Agricultural Economics, 39: 51-61.
Les Working Papers SMART – LERECO sont produits par l’UMR SMART et l’UR LERECO
• UMR SMART
L’Unité Mixte de Recherche (UMR 1302) Structures et Marchés Agricoles, Ressources
et Territoires comprend l’unité de recherche d’Economie et Sociologie Rurales de
l’INRA de Rennes et le département d’Economie Rurale et Gestion d’Agrocampus Ouest.
Adresse :
UMR SMART - INRA, 4 allée Bobierre, CS 61103, 35011 Rennes cedex
UMR SMART - Agrocampus, 65 rue de Saint Brieuc, CS 84215, 35042 Rennes cedex
http://www.rennes.inra.fr/smart
• LERECO
Unité de Recherche Laboratoire d’Etudes et de Recherches en Economie Adresse :
LERECO, INRA, Rue de la Géraudière, BP 71627 44316 Nantes Cedex 03
http://www.nantes.inra.fr/le_centre_inra_angers_nantes/inra_angers_nantes_le_site_de_nantes/les_unites/et udes_et_recherches_economiques_lereco
Liste complète des Working Papers SMART – LERECO :
http://www.rennes.inra.fr/smart/publications/working_papers
The Working Papers SMART – LERECO are produced by UMR SMART and UR LERECO
• UMR SMART
The « Mixed Unit of Research » (UMR1302) Structures and Markets in Agriculture,
Resources and Territories, is composed of the research unit of Rural Economics and
Sociology of INRA Rennes and of the Department of Rural Economics and Management of Agrocampus Ouest.
Address:
UMR SMART - INRA, 4 allée Bobierre, CS 61103, 35011 Rennes cedex, France
UMR SMART - Agrocampus, 65 rue de Saint Brieuc, CS 84215, 35042 Rennes cedex, France
http://www.rennes.inra.fr/smart_eng/
• LERECO
Research Unit Economic Studies and Research Lab Address:
LERECO, INRA, Rue de la Géraudière, BP 71627 44316 Nantes Cedex 03, France
http://www.nantes.inra.fr/nantes_eng/le_centre_inra_angers_nantes/inra_angers_nantes_le_site_de_nantes/l es_unites/etudes_et_recherches_economiques_lereco
Full list of the Working Papers SMART – LERECO:
http://www.rennes.inra.fr/smart_eng/publications/working_papers
Contact
Working Papers SMART – LERECO
INRA, UMR SMART
4 allée Adolphe Bobierre, CS 61103 35011 Rennes cedex, France
2009
Working Papers SMART – LERECO
UMR INRA-Agrocampus Ouest SMART (Structures et Marchés Agricoles, Ressources et Territoires) UR INRA LERECO (Laboratoires d’Etudes et de Recherches Economiques)