Contribution as a Carbon Sink
Technical Paper
Jagdish Kishwan
Director General
Indian Council of Forestry Research and Education, Dehradun
E-mail: jkishwan@nic.in
Rajiv Pandey
Scientist (Statistics) Indian Council of Forestry Research and Education, Dehradun
E-mail: rajivfri@yahoo.com
VK Dadhwal
Dean
Indian Institute of Remote Sensing, Dehradun E-mail: dean@iirs.gov.in
Jagdish Kishwan1, Rajiv Pandey1 and V K Dadhwal2
1 Indian Council of Forestry Research and Education, Dehradun,
Uttarakhand
2 Indian Institute of Remote Sensing, Dehradun, Uttarakhand
India’s Forest and Tree Cover:
Contribution as a Carbon Sink
Abstract
India ranks 10th in the list of most forested
na-tions in the world with 76.87 million ha of forest and tree cover. Like other forests of the world, our forests also provide critical ecosystem goods and services. However, the significant role of forests in carbon storage and sequestration has increased their importance manifold and brought them to the centre-stage of climate change mitigation strategies.
India’s forest and tree cover accounts for about 23.4% of the total geographical area of the country. Over the past decades, national poli-cies of India aimed at conservation and sustain-able management of forests have transformed India’s forests into a net sink of CO2. From 1995 to 2005, carbon stocks stored in our forests have increased from 6244.78 to 6621.55 million tonnes (mt) registering an annual increment of 37.68 mt of carbon = 138.15 mt of CO2eq. This annual removal by forests is enough to neutralise 9.31% of our total annual emissions of 2000. This amount of carbon sequestration will still be adequate to dent our emissions even when these will be on the increase due to our accel-erated development process. Estimates show that the continued removals by the forests would still be able to offset 6.53% and 4.87%
of our projected annual emissions in 2010 and 2020 respectively. It is estimated that emissions in 2010 and 2020 will respectively be 45% and 95% higher than those in 2000.
And, if over and above the current trend, the National Mission for a Green India as part of the ‘National Action Plan on Climate Change’ (NAPCC) becomes operational, the capability of the forestry sector to contribute in GHG re-moval will further enhance. Afforestation and reforestation of 6 million hectares of degraded forest land covered under the National Mission with participation of Joint Forest Management Committees (JFMCs) would be able to add an-other 18 mt of carbon = 66 mt of CO2eq by 2020. Annual addition of 6 mt of biomass due to operationalization of the Mission will increase the annual emissions removal capability of the forests from 4.87% to 5.18% of the correspond-ing projected emissions in 2020. Even if half (3 mt) of the annual biomass increment (6 mt) is removed annually on a sustainable basis from 2025 onwards, the emission removal capability of forestry sector would still be able to offset every year 5.02% of the 2020 level emissions. It is abundantly clear that forestry sector has sig-nificant emissions removal capability which can further be enhanced by operationalizing major afforestation and reforestation initiatives like Na-tional Mission for a Green India besides contin-ued strengthening of the present protection re-gime of forests. Launching a programme to
pro-vide LPG in hilly areas of Himalayan region and in central tribal belt offers another potential op-portunity to further improve the carbon seques-tration potential of our forests as this kind of fuel switching by the hilly and tribal communities would reduce pressure of fuelwood removal from forests.
Key words: Emissions Removal, Capability of Forests, GHG Emissions, Carbon Storage, For-est Carbon Stocks, Joint ForFor-est Management Committees, Green India
Introduction
Forests provide a wide range of goods and ser-vices. Goods include timber, fuelwood, as well as food products (berries, mushrooms, etc.) and fodder. As regards important services, forests and trees play a role in the conservation of eco-systems, in maintaining quality of water, and in preventing or reducing the severity of floods, avalanches, erosion, and drought. Forests pro-vide a wide range of economic and social ben-efits, such as employment, forest products, and protection of sites of cultural value (FAO, 2006). Forests, like other ecosystems, are affected by climate change. The impacts due to climate change may be negative in some areas, and positive in others. However, forests also influ-ence climate and the climate change process mainly by effecting the changes in the quantum of carbon dioxide in the atmosphere. They ab-sorb CO2 from atmosphere, and store carbon in wood, leaves, litter, roots and soil by acting as “carbon sinks”. Carbon is released back into the atmosphere when forests are cleared or burned. Forests by acting as sinks are consid-ered to moderate the global climate. Overall, the world’s forest ecosystems are estimated to store more carbon than the entire atmosphere (FAO, 2006).
However, deforestation, mainly conversion of forests to agricultural land, is continuing at an alarmingly high rate. Forest area, which is about 30% (4 billion hectares) of the global total land area decreased worldwide by 0.22% per year in the period 1990-2000 and 0.18% per year between 2000 and 2005. However, the net loss of forest is slowing down as a result of the plant-ing of new forests and of natural expansion of forests. Forests and trees are being planted for many purposes and at increasing rates, yet the plantations still account for only 5 percent of
total forest area (FAO, 2006). Quantifying the substantial roles of forests as carbon stores, as sources of carbon emissions and as carbon sinks has become one of the keys to understanding and modifying the global carbon cycle.
Worldwide numerous ecological studies have been conducted to assess carbon stocks based on carbon density of vegetation and soils (Atjay et. al., 1979; Olson et. al., 1983; Saugier and Roy, 2001). The results of these studies are not uni-form and have wide variations and uncertain-ties probably due to aggregation of spatial and temporal heterogeneity and adaptation of dif-ferent methodologies. IPCC (2000) estimated an average carbon stock of 86 tonnes per hect-are in the vegetation of the world’s forests for the mid-1990s. The corresponding carbon in biomass and dead wood in forests reported in FRA, 2005 amounts to 82 tonnes per hectare for the year 1990 and 81 tonnes per hectare for the year 2005. Each cubic metre of growing stock equals different amounts of biomass and carbon (in biomass) in different regions. Glo-bally, each cubic metre of growing stock equals, on an average, 1 tonne of above-ground biom-ass, 1.3 tonnes of total biomass and 0.7 tonnes of carbon in biomass (FAO, 2006). The country reports of FAO indicate that global forest veg-etation stores 283 Gt of carbon in its biomass, and an additional 38 Gt in dead wood, for a total of 321 Gt and IPCC (2000) assumed 359 Gt of carbon in these pools.
Total growing stock shows a slight overall down-ward tendency – mainly owing to a decrease in forest area. However, some regions also show significant positive trends in growing stock per hectare. For example, Europe shows an increase and Southeast Asia a decrease. It is estimated that the world’s forests store 638 Gt of carbon in the ecosystem as a whole (to a soil depth of 30 cm). Thus forests contain more carbon than
the entire atmosphere. Roughly half of total car-bon is found in forest biomass and dead wood combined and half in soils and littercombined (FAO, 2006).
India is a large developing country known for its diverse forest ecosystems and mega-biodiversity. It ranks 10th amongst the most
for-ested nations of the world (FAO, 2006) with 23.4 percent (76.87 million ha) of its geographical area under forest and tree cover (FSI, 2008). With nearly 173,000 villages classified as forest fringe villages, there is obviously a large depen-dence of communities on forest resources. Thus, it is very important to assess the likely impacts of projected climate change on forests, to de-velop and implement adaptation strategies both for biodiversity conservation and protection and for safeguarding the livelihoods of forest depen-dent people, and to ensure production of round wood for industrial and commercial needs. The forest carbon was assessed in different ways by different researchers. Earlier attempts for es-timating forest carbon did not take into consid-eration soil carbon. The biomass carbon stock in India’s forests was estimated at 7.94 MtC dur-ing 1880 and nearly half of that after a period of 100 years (Richards and Flint, 1994). The first available estimates for forest carbon stocks (bio-mass and soil) for the year 1986, are in the range of 8.58 to 9.57 GtC (Ravindranath, et al., 1997; Haripriya, 2003; Chhabra and Dadhwal, 2004). As per FAO estimates (FAO, 2005), the total for-est carbon stocks in India have increased over a period of 20 years (1986–2005) and amount to 10.01 GtC. The carbon stock projections for the period 2006–30 is projected to be increasing from 8.79 to 9.75 GtC (IISc, 2006) with forest cover becoming more or less stable, and new forest carbon accretions coming from the cur-rent initiatives of afforestation and reforestation programme (Ravindranath, et al., 2008).
Need-less to say that the present state of forest car-bon stocks owes its origin to the drive of planta-tion forestry in India started in the late 1950s and supplemented later by the social and farm forestry initiatives of the 1980s and early 1990s. All the same, the National Communication of the Government of India to the UNFCCC for 1994 has reported that the LULUCF sector is a marginal source of emissions with a figure of 14.29 mt (million tonnes) of CO2. However, in the LULUCF sector ‘changes in forest and other woody biomass stock’ account for a net removal of 14.25 mt of CO2 (NATCOM, 2004).Thus, for forests alone, the NATCOM presents a net sink of 14.25 mt CO2eq. With the knowledge and the information that is now emerging, the role of forests and plantations in mitigation is becom-ing more and more important. NATCOM re-ports a comprehensive inventory of India’s emis-sions from all energy, industrial processes, agri-culture activities, land use, land use change and forestry and waste management practices to the United Nations Framework Convention on Cli-mate Change (UNFCCC) for the base year 1994. It is a useful reference document to compare the contribution of different sectors in the na-tional level emissions.
The compounded annual growth rate of CO2eq emissions in India is 4.2 per cent. Some may consider this to be higher than the desired, but the absolute value of these emissions is still one-sixth that of the United States and lowest for the per capita GHG emissions (Rawat and Kishwan, 2008).
In India, CO2 emissions from forest diversion or loss are largely offset by carbon uptake due to forest increment and afforestation. Many au-thors concluded that for the recent period, the Indian forests are nationally a small source with some regions acting as small sinks of carbon as well (Ravindranath, et al.1997; Haripriya, 2003;
Chhabra and Dadhwal, 2004; Ravindranath, et al., 2008). The improved quantification of pools and fluxes related to the forest carbon cycle is important for understanding the contribution of India’s forests to net carbon emissions as well as their potential for carbon sequestration in the context of the Kyoto Protocol (Chhabra and Dadhwal, 2004).
It was in this background that the country rec-ognized the importance of pursuing the poli-cies of conservation and expanding the areas of woodlots that besides goods and other ser-vices allowed the forests to sequester more and more carbon in biomass and the soil. This is happening not only in India, but in many other developing countries. To encourage conserva-tion and expansion of forests world-wide, India internationally supported compensation for nations in return for the carbon services they are, and will be, providing by conserving, stabi-lizing and/or increasing their forest cover. The policy approach advocated by India in the con-text of the agenda item of “Reducing emissions from deforestation in developing countries” of the United Nations Framework Convention on Climate Change (UNFCCC), also known as REDD or REDD-plus was named “compensated conservation” (Kishwan, 2007). However, any future agreement on REDD/REDD-plus would require assessment and monitoring of forest carbon stocks of a country at regular intervals through application of scientifically acceptable methodologies.
Purpose of this study is to compute improved estimates for biomass, and therefrom biomass carbon in forests taking into account the inven-tory data for diversified forest types present in the country, and also by accounting for biom-ass in other vegetation on forest floor (other than trees). It may also be mentioned that most stud-ies related to estimation of biomass have not
incorporated the biomass stored in the under-story of the forest (Brown and Lugo, 1991; Manhas, et al., 2006).
Methodology
Estimation of carbon stocks in forestry sector, present in biomass and soil, is based either on IPCC guidelines or through use of actual con-version and other factors starting from the grow-ing stock (GS) data of forest inventories. Forest Survey of India is primary source of these data in the country. However, some other sources such as FAO, and research papers complement these inventories. The present study for the as-sessment of forest carbon stocks uses primary data for the soil carbon pool and secondary data of growing stock from various sources for esti-mating the biomass carbon (Brown and Lugo, 1984; Houghton, et al. 1985; Dadhwal and Nayak, 1993). Approach of the study being a combination of primary and secondary data with large number of samples for assessment of soil organic carbon (SOC) makes it more reli-able for carbon pool estimates. Mathematically, assessment of forest carbon stocks in the study can be represented as:
CCarbon = CBiomass + CSoil
Where,
CCarbon = Total available carbon in the forest, i.e., in the vegetation and in soil
CBiomass = Total available carbon in the above and below ground biomass of all for-est vegetation
CSoil = Total available soil organic carbon (SOC) up to 30cm depth in the forest
Soil Organic Carbon (SOC) Pool
-For estimating SOC, the IPCC guidelines (IPCC, 1997) prescribe that only the upper 30 cm layer of soil, which contains the actively changing soil carbon pool in the forest, should be considered. For this purpose, the representative soil samples were collected from a pit of 30 cm wide, 30 cm deep and 50 cm in length. The samples con-tained thoroughly mixed soil with gravels re-moved, and were collected randomly from all forest types by digging a fresh rectangular pit in the forest and by clearing the top layer of grass, litter and humus in an area of 50 cm x 50 cm. However, no samples were taken from eroded land, or from near the trunk of trees, roads, houses and construction sites, etc. For estimat-ing bulk density, two to three clods of about 2 to 3 cm size were picked from each pit from top to bottom using standard collectors. Soil samples were collected from a total of 571 sample points laid in different forest types cov-ering the whole country. Forest types were used as strata for sampling and equal number of sample points were allocated to each stratum. The study covered a total of 571 samples in for-est area and 101 additional samples in the nearby non-forest areas. But, for assessment of SOC in forests, 101 samples collected from non-forest areas were not taken into account. Addi-tionally, 15 samples falling in alpine scrub were discarded as area of this forest type was not available. Soil organic carbon was estimated by standard Walkley and Black method and bulk density was estimated using standard Clod method. All measurements, observations and in-formation required for each sample were sys-tematically recorded. The bulk density (D) was calculated as under:D = weight of soil (gm)/volume of core (cyl-inder) in cm3
Soil organic carbon stock Qi (Mg m-2) in a soil
layer or sampling level i with a depth of Ei (m) depends on the carbon content Ci (g C g-1), bulk
density Di (Mg m-3) and on the volume fraction
of coarse elements Gi, given by the formula (Batjes, 1996):
Qi = Ci Di Ei (1–Gi )
For the soil thickness z with k levels of depar-ture, the total stock of carbon was obtained by adding the stocks for each of the k levels (Schwartz and Namri, 2002):
) 1 ( 1 1 i i i i k i k i i t soil Q Q C DE G C = =
∑
=∑
− = =Rock outcrop at a site affects the representa-tive elementary volume and the regolith volume available for root growth. This attribute was eliminated by using a simple estimate of areal percentage (McDonald et al., 1990).
Biomass Carbon
-Biomass carbon can be disaggregated into above ground and below ground biomass. Change in forest carbon stocks during a time period is an indicator of the net emissions or removals of CO2 in that period. Total biomass was calculated for the years 1995 and 2005, and linearly projected for the year 2015.
Assessment of biomass was based on the con-sideration that all lands, more than one hectare in area, with a tree canopy density of more than 10 per cent are defined as ‘Forest’. The country’s forest carbon estimate is based on the forest cover assessment of 1997 and 2005 by Forest Survey of India (FSI). Additionally, data for the year 2003 was also considered. The satellite data used for 1997 assessment related to the period from 1993 to 1995, and for 2005, pertained to 2003 to 2005. Therefore, we have safely
pre-sumed that these assessments are sufficiently and adequately representative, and thus can be used for forest carbon stock estimation for 1995 and 2005 (Saxena, et al., 2003). The total forest cover in India according to the State of Forest Re-port 2005 is 67.71 mha or 20.60% of the geo-graphic area (FSI, 2008), and as per 1995 report, the forest cover is 63.34 mha covering 19.27% of geographic area of country (Manhas, et al., 2006). The component-wise, i.e., growing stock sepa-rately for forest and tree cover of the country for the years 2003 and 2005 is respectively avail-able in State of Forest Report 2003 (FSI, 2005) and State of Forest Report 2005 (FSI, 2008). However, for 1995, growing stock only for for-est cover is available at the national level. Grow-ing stock for the tree cover for 1995 at the coun-try level was estimated based on the mean of the ratio between growing stock of tree cover and that of forest cover for the years 2003 and 2005 with the assumption that during the pe-riod of about a decade between 1993, and 2003-2005, the increment in growing stock of the tree cover and that of forest cover have fol-lowed a uniform pattern. As regards, state-wise break-up of data relating to the quantum of growing stock for forest cover, and that for tree cover, the same is not available for 2005, which makes it difficult to estimate state-wise figures for such data for 1995 also.
Suitable biomass increment values (expansion and conversion for calculating total tree above ground biomass) and the ratio of below and above ground biomass (for calculating total tree biomass above and below ground) as available in different studies covering a range of forest types of the country were used in the present study. The referred studies measured directly or indirectly the total biomass of the stand broken down into the individual components (Chhabra, et al., 2002; Kaul, et al., 2009). These
compo-nents were stemwood, branches, leaves and roots of the tree in a stand or even in a larger area depending on the study. The biomass of other vegetation on forest floor (understory) was estimated based on the ratio of total tree biom-ass to the total forest floor biombiom-ass excluding the tree component in the area. In general, other for-est floor biomass accounts for less than 2 percent of total biomass of closed forest formations (Ogawa, et al., 1965; Rai, 1981; Brown and Lugo, 1984). However for this study, ratio was adopted based on the published records for different veg-etation types and different localities, and also keeping in view its application and representa-tion for the country level estimates (Singh and Singh, 1985; Rawat and Singh, 1988; Negi, 1984; Roy and Ravan, 1996). Mathematically, the above ground biomass of tree component is as follows: Vegetaion Other Tree Total GS GS GS = + . = Total
GS Total growing stock in forest =
Tree
GS Growing stock of tree component
=
Vegetaion Other
GS . Growing stock of other
vegetation on forest floor
Ground Below Ground Above Tree V V GS = . + . Ground Above
V . = Above ground volume
Ground Below
V . = Below ground volume
Ground Above
V . = GSCommercialx Expansion factor Commercial
GS = Growing stock of tree bole
upto 10 cm diameter
Expansion factor = Adjusted mean biomass (vol-ume) expansion factor for the country
Ground Below
V . = VAbove.Ground x Ratio
Ratio = Adjusted mean ratio between below and above ground biomass (volume)
=
Vegetaion Other
GS . GSTree x R
R = Ratio of other forest floor biomass to grow-ing stock of tree component
The biomass is estimated by taking into account the total growing stock of the forest including the above and below ground volume of all veg-etation in the forest and multiplying it with a ‘volume to mass’ conversion factor. The conver-sion factor adopted in this study is influenced by the contents of studies of Brown, Gillespie and Lugo, 1991; Rajput, et al., 1996 and Kaul, et al., 2009.
B = GSTotal x MD
B = Biomass (million tonnes)
Total
GS = Total forest growing stock (million m3)
MD = Mean wood density
Biomass material contains about 40% carbon by weight, with the hydrogen (6.7%) and oxy-gen (53.3%). The remaining proportions include nitrogen with a share of 0.3-3.8%, and sulfur 0.1-0.9%. The variability of approximately 9% de-pends on the nature of the biomass material (Bowen, 1979; Levine, 1996). Although most studies have used the carbon proportions be-tween 40 to 50% depending on the require-ments (IPCC, 1997; 2004; Andreae, 1991; 1993 Susott, et al., 1996; Ludwig, et al., 2003), the present study uses the conservative value of 40% carbon content keeping in view the fact that the study deals with mixed biomass com-prising timber, fuelwood, leaves, twigs, roots, etc. The study also assumes the presence of an average moisture content of 20% mcdb
(mois-ture content on dry basis) in dry wood and other biomass. This has also been suggested by Leach and Gowen, 1987; Hall, et al., 1994 for getting more realistic estimate considering that good amount of water still remains in wood even af-ter proper drying (Ludwig, et al., 2003). Conser-vative values of carbon content and mcdb have been adopted to have realistic estimates in view of the errors that are generally associated with use of such values and factors in computation of total growing stock, wood densities, expan-sion and converexpan-sion factor, etc. Mathematically, the biomass carbon can be estimated as follows:
= Biomass
C Biomass x (1 - mcdb) x Proportion
of Carbon Content
Based on the carbon estimates for the year 2005 and 1995, the annual addition of carbon in India’s forest was calculated. This increment was converted into the CO2 equivalent for compar-ing and estimatcompar-ing the emissions offsettcompar-ing ca-pability of India’s forest in relation to the national level GHG emissions. Figures for GHG emis-sions of the country were available in published records for the year 1990, 1994 and 2000 in Sharma, et al., 2006, and for 2000, 2010 and 2020 in Shukla, 2006 with corresponding CO2 equivalent value. Emissions removal or offset-ting capability of forests was calculated as a percentage of these projected values. Incre-ment in forest carbon stocks over a period of time is calculated as under:
Carbon Increment in m years (Im) = CCarbon in tth year -
Carbon
C in (t-m)th year
Based on above, the annual increment (IA) in forest carbon stocks is
m I
I m
A =
Result
The growing stock of the country for the year 2005 is 6,218 million cubic meter comprising 4,602 million cubic meter corresponding to the forest cover and 1,616 million cubic meter cor-responding to the tree cover. Average growing stock in the recorded forest area per hectare is 59.79 cubic meter. However, in 2003, the grow-ing stock under tree cover was 1,632 million cubic meter and for forest cover was 4,781 mil-lion cubic meter. The proportion of growing stock for tree cover as compared to that for forest cover is 35.12% and 34.14% in 2005 and 2003 respectively (FSI, 2005, 2008). The mean of these proportions (34.63 %) is utilized for estimating the growing stock under tree cover for the country in the year 1995, as the figure for this growing stock for 1995 is not available. In this year, the growing stock under forest cover was 4,339.55 million cubic meter (FSI, 1997; Manhas, et. al., 2006), and the estimated grow-ing stock under tree cover worked out on the basis of average proportion is 1,502.77 million cubic meter, making the total growing stock of 5,842.32 million cubic meter for both forest and tree cover. Following the description in meth-odology, the adjusted mean biomass expansion factor, ratio between below and above ground biomass, mean density, and ratio between other forest floor biomass to the tree biomass were esti-mated, and are presented below in Table 1 to-gether with calculation for forest biomass carbon in the country’s forests. The calculation uses con-version of commercial wood volume (growing stock) into total biomass using average adjusted wood density and expansion factors and ratios as also suggested by Brown, Gillespie and Lugo, 1991. Soil organic carbon pool for different forest groups was estimated based on the primary data as described in methodology and reported in Table 2 for 1995 and 2003.
Table 1: Forest Biomass Carbon in India (million tonnes)
Item with symbolic description Factor 1995 2005
Growing Stock of Country in Mm3 - GS 5842.320 6218.282
Mean Biomass Expansion Factor - EF 1.575
Ratio (Below to Above Ground Biomass) - RBA 0.266
Above Ground Biomass (Volume) - AGB = GS X EF 9201.654 9793.794
Below Ground Biomass (Volume) - BGB = AGB X RBA 2447.640 2605.149
Total Biomass (Volume) – TB = AGB + BGB 11649.294 12398.943
Mean Density - MD 0.7116
Biomass in Mt = Growing Stock (Mm3) x Mean Density (MD) 8289.638 8823.088
Ratio (Other Forest Floor Biomass except tree to Tree Biomass) 0.015
Total Forest Biomass in Mt (Trees + Shrubs + Herbs) - TFB 8413.982 8955.434
Dry Weight in Mt (80% of TFB) - DW 6731.186 7164.348
Carbon in Mt (40 % of DW) 2692.474 2865.739
Factors for various items were derived from mainly Kaul, et.al., 2009; Ray and Ravan, 1996 and Singh and Singh, 1985.
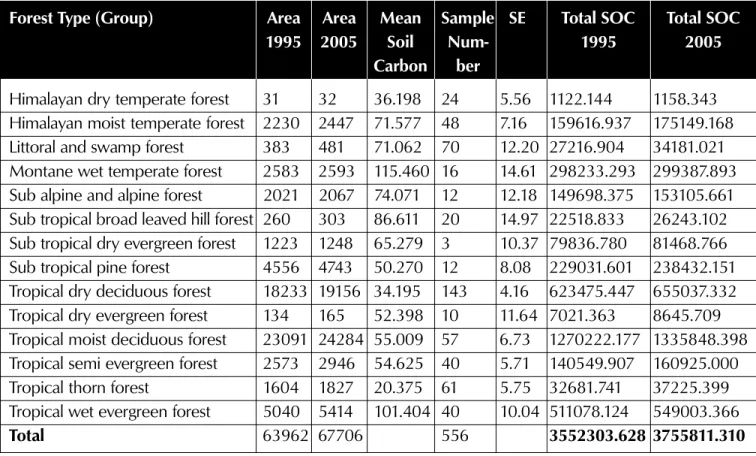
Table 2: Soil Organic Carbon Pool Estimates (0 - 30 cm) in India’s Forests (million tonnes)
Area in 000 ha
Forest Type (Group) Area Area Mean Sample SE Total SOC Total SOC
1995 2005 Soil Num- 1995 2005
Carbon ber
Himalayan dry temperate forest 31 32 36.198 24 5.56 1122.144 1158.343
Himalayan moist temperate forest 2230 2447 71.577 48 7.16 159616.937 175149.168
Littoral and swamp forest 383 481 71.062 70 12.20 27216.904 34181.021
Montane wet temperate forest 2583 2593 115.460 16 14.61 298233.293 299387.893
Sub alpine and alpine forest 2021 2067 74.071 12 12.18 149698.375 153105.661
Sub tropical broad leaved hill forest 260 303 86.611 20 14.97 22518.833 26243.102
Sub tropical dry evergreen forest 1223 1248 65.279 3 10.37 79836.780 81468.766
Sub tropical pine forest 4556 4743 50.270 12 8.08 229031.601 238432.151
Tropical dry deciduous forest 18233 19156 34.195 143 4.16 623475.447 655037.332
Tropical dry evergreen forest 134 165 52.398 10 11.64 7021.363 8645.709
Tropical moist deciduous forest 23091 24284 55.009 57 6.73 1270222.177 1335848.398
Tropical semi evergreen forest 2573 2946 54.625 40 5.71 140549.907 160925.000
Tropical thorn forest 1604 1827 20.375 61 5.75 32681.741 37225.399
Tropical wet evergreen forest 5040 5414 101.404 40 10.04 511078.124 549003.366
Total 63962 67706 556 3552303.628 3755811.310
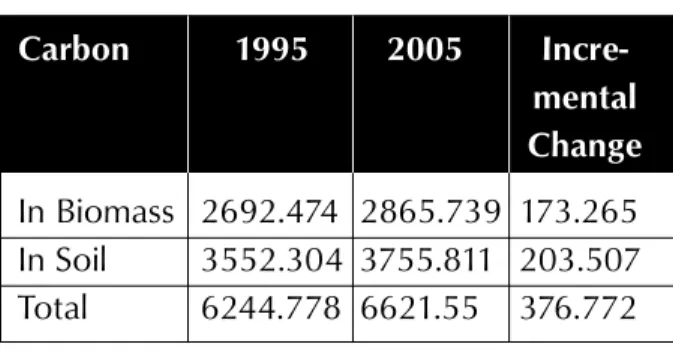
Based on the figures for biomass carbon and SOC in forests given in Table 1 and Table 2 above, the estimates of total forest carbon stocks comprising components of biomass carbon and SOC for 1995 and 2005 were computed, and are presented below in Table 3. Component-wise changes in the period from 1995-2005 were also worked out.
out the proportion of national level emissions offset by forests in India. Proportion of emissions removed/offset by India’s forestry sector in dif-ferent years is reported below in Table 4. Implementation of the National Mission for a Green India as part of the National Action Plan for Climate Change can further enhance the present mitigation potential of the forestry sec-tor. Same methodology as has been used for calculating forest carbon stocks for forestry sec-tor can be used for estimating the additional quantum of carbon sequestered by afforestation and reforestation of 6 million ha of degraded forest lands. Presuming a conservative dry bio-mass accumulation of 1 t ha-1 yr-1, 18 million
tonnes (mt) of carbon (in 45 mt of dry biomass) would get accumulated by 2020 when the plan-tation is done at the rate of 1 million ha per year, 2010 onwards. The figure would rise to 75 mil-lion tonnes of carbon in 2025. In 2020, when 6 mt of biomass = 2.4 mt of carbon or 8.8 mt of CO2eq is sequestered every year; this will be able to additionally offset 0.31% of projected 2020 level emissions annually. The mission will have the effect of increasing the emissions re-moval capability of the country’s forests from 4.87 to 5.18% annually of the 2020 emissions level. Even if half the biomass of 3 mt from the total annual incremental biomass is removed from 2025 onwards on a sustainable basis, the
Table 3: Component-wise Carbon in India’s Forests in 1995 and 2005 (million tonnes)
Carbon 1995 2005 Incre-mental Change In Biomass 2692.474 2865.739 173.265 In Soil 3552.304 3755.811 203.507 Total 6244.778 6621.55 376.772
The analysis showed that there is improvement in forest carbon stocks on temporal basis from 1995 to 2005. The difference of 376.772 mt between figures of 1995 and 2005 shows the incremental carbon accumulation in India’s for-ests during the period. On yearly basis, the ad-dition of carbon was 37.677 mt ≈ 37.68 mt (say), which means an annual removal of 138.15 mt CO2 eq. Annual accumulation of forest carbon stocks was compared with the trend of national GHG emissions as computed and reported by Shukla, 2006 and Sharma, et al., 2006 to work
Table 4: Total GHG Emissions (mt CO2eq) from various sectors, and proportion thereof offset by forestry sector
Estimate Source/ Proportion 1990 1994 2000 2010 2020
Shukla, 2006 – – 1454 2115 2839
Proportion of Emissions Removed
by India’s Forestry Sector (%) 9.50 6.53 4.87
Sharma et. al. 2006 987.885 1,228.539 1,484.622 – –
Proportion of Emissions Removed
plantations of the mission would still be able to maintain the increased emissions removal ca-pability of forestry sector at 5.02% of the 2020 level emissions.
References
Andreae, M. O. 1991. Biomass burning. Its history, use, and distribution and its impact on environmental quality and global climate. In J.S. Levine (ed.), Glo-bal Biomass Burning: Atmospheric, Climatic, and Biospheric Implications. MIT Press, Cambridge, Mas-sachusetts, pp. 3-21.
Andreae, M. O. 1993. The influence of tropical biom-ass burning on climate and the atmospheric envi-ronment. In: Biogeochemistry of Global Change: Radiatively Active Trace Gases. Ed.: Oremland, R. S. Chapman and Hall, New York. pp. 113–150. Atjay, G.L., Ketner, P. and Duvigneaud, P. 1979.
Terres-trial primary production and phytomass In: The Global Cycle. Eds.: Bolin, B.; Degens. E.T.; Kempe, S. and Ketner, P. John Willey & Sons, Chichester. pp. 129 – 181.
Batjes, N. H. 1996. Total carbon and nitrogen in the soils of the world. Eur. J. Soil Sci., 47: 151– 163. Bowen, H. L. M., 1979. Environmental Chemistry of the
Elements. Academic Press, London.
Brown, S. and Lugo, A. E. 1984. Biomass of Tropical Forests: A New Estimate Based on Forest Volumes.
Science, 223: 1290–1293.
Brown, S. ; Gillespie, A.J.R. and Lugo, A. E. 1991. Biom-ass of Tropical Forests of south and southeast Asia.
Can. J. For. Res. 21: 111-117.
Chhabra, A. and Dadhwal, V. K.2004. Assessment of major pools and fluxes of carbon in Indian forests.
Climatic Change, 64(3): 341–360.
Chhabra, A.; Palria, S. and Dadhwal, V. K. 2002. Grow-ing Stock Based Forest Biomass Estimate for India.
Biomass Bioenergy, 22: 187–194.
Dadhwal, V. K. and Nayak, S. R. 1993. A Preliminary Estimate of Biogeochemical Cycle of Carbon for In-dia. Sci. & Cult. 59: 9–13.
FAO. 2005. State of the World’s Forests. FAO, Rome. FAO. 2006. Global Forest Resources Assessment 2005:
Progress towards sustainable forest management. FAO Forestry Paper 147. Food and Agriculture Organisation of the United Nations, Rome. FSI. 1995. Extent, composition, density, growing stock
and annual increment of India’s forests. Forest Sur-vey of India, Ministry of Environment & Forests, Dehradun.
FSI. 1997. State of Forest Report 1995. Forest Survey of India, Ministry of Environment and Forests, Dehra Dun.
FSI. 2005. State of Forest Report, 2003. Forest Survey of India, Ministry of Environment and Forests Gov-ernment of India, Dehra Dun, India.
FSI. 2008. State of Forest Report, 2005. Forest Survey of India, Ministry of Environment and Forests Gov-ernment of India, Dehra Dun, India.
Hall, D. O.; Rosillo-Calle, F. and Woods, J. 1994. Biom-ass utilization in households and industry: Energy use and development. Chemosphere, 29: 1099–1119. Haripriya, G. S.2003. Carbon budget of the Indian
for-est ecosystem. Climate Change, 56: 291–319. Houghton, R. A.; Boone, R. D.; Melillo, J. M.; Myers,
N.; Palm C. A.; Skole, D. L.; Moore, B. and Woodwell, G. M. 1985. Net Flux of Carbon from Tropical For-ests in 1980. Nature, 316: 617–620.
II.Sc 2006. Forest conservation and afforestation/refor-estation in India: implications of forest carbon stocks and sustainable development. Report of project No. 6/2/2006-CCC. Indian Institute of Science, Banga-lore, 560 012, India.
IPCC (International Panel on Climate Change). 2004. Good Practice Guidance for Land Use, Land-Use Change, and Forestry. IPCC, Geneva, Switzerland. IPCC. 1997. Landuse change and forestry. In: Revised
1996 IPCC Guidelines for National Greenhouse Gas Inventories: Reference Manual. Volume 3. Eds.: Houghton, J.T.; Meira Filho, L.G.; Lim, B.; Treanton, K.; Mamaty, I.; Bonduki, Y.; Griggs, D.J. and Callander, B.A. Intergovernmental Panel on Climate Change. http://www.ipccnggip.iges.or.jp/public/gl/ invs6d.htm. assessed on 10th Dec., 2007.
IPCC. 2000. Land use, land-use change and forestry. Special report, Cambridge University. Intergovern-mental Panel on Climate Change, Geneva.
Kaul, M.; Dadhwal, V.K. and Mohren, G.M.J. 2009. Land use change and net C flux in Indian Forests. Forest Ecology and Management, 258: 100-108.
Kishwan, J. 2007. Reducing emission from deforesta-tion in developing countries: Indian proposal. Pre-sented at 2nd UNFCCC Workshop on REDD: 7–9
March 2007, Cairns, (Australia) available at: http:// unfccc.int/files/methods_and_science/lulucf/appli-cation/pdf/070307kishwan.pdf.
Leach, G. and Gowen, M. 1987. Household Energy Handbook. World Bank Technical Pap. 67, World Bank, Washington, D.C.
Levine, J. S., 1996. Biomass Burning and Global Change. MIT Press, Cambridge, MA. pp. 902 +28.
Ludwig, J.; Marufu, L. T.; Huber, B.; Andreae, M. O. and Hela, G. 2003. Domestic Combustion of Biomass Fuels in Developing Countries: A Major Source of Atmospheric Pollutants. Journal of Atmospheric Chemistry 44:23–37.
Manhas, R.K; Negi, J.D.S.; Rajesh Kumar and Chauhan, P.S. 2006. Temporal Assessment of Grwoing Stock, Biomass and Carbon Stock of Indian Forests. Climate Change, 74: 191-221.
McDonald, R.C.; Isbell, R.F.; Speight, J.G.; Walker, J. and Hopkins, M.S. 1990. Australian Soil and Land Sur-vey Handbook – Field Handbook, 2nd ed. Inkata Press, Melbourne. 198 pp.
NATCOM 2004. India’s first national communication to UNFCCC, Ministry of Environment and Forests Government of India, New Delhi.
Negi, J.D.S. 1984. Biological productivity and cycling of nutrients in managed and man made ecosystem. Ph.D. thesis, Garhwal University, Garhwal.
Ogawa. H.; Yoda, K.; Ogino, K. and Kira, T. 1965. Comprative ecological studies on three main types of forests vegetation in Thailand II. Plant Biomass. In: Nature and Life in Southeast Asia. Ed.: Kira, T. and Iwata, K. Fauna and Flora Research Society, 4: 49-80.
Olson, J.S.; Watts, J.A. and Allison, L.J. 1983. Carbon in Live Vegetation of Major World Ecosystems. Oak Ridge National Laboratory ORNL – 5862, Oak Ridge, Tennessee.
Rai, S. N. 1981. Productivity of tropical rain forests of Karnatka. PhD. thesis, University of Bombay. Bombay.
Rajput, S.S.; Shukla, N.K.; Gupta, V.K. and Jain, J.D. 1996. Timber mechanics: Strength classifications and grad-ing of timber. ICFRE Publications-38, Dehradun. Ravindranath, N. H.; Somashekhar, B. S. and Gadgil,
M. 1997. Carbon flows in Indian forests. Climate Change, 1997: 35, 297–320.
Ravindranath, N.H.; Rajiv Kumar Chaturvedi and Murthy, I.K. 2008. Forest conservation, afforestation and reforestation in India: Implications for forest carbon stocks. Current Science: 216 95 (2): 216-222. Rawat, V.R.S. and Kishwan, J. 2008. Forest conserva-tion–based, climate change–mitigation approach for
India. International Forestry Review, 10(2): 269-280. Rawat, Y.S. and Singh, J.S. 1988. Structure and func-tion of oak forests in Central Himalaya.I. dry Matter Dynamics. Annals of Botany, 62: 397-411.
Richards, J. F. and Flint, E. P. 1994. Historic land use and carbon estimates for South and Southeast Asia 1880–1980. ORNL/CDIAC-61, NDP-046, Oak Ridge National Laboratory, Tennessee, USA.
Roy, P.S. and Ravan, S.A. 1996. Biomass estimation us-ing satellite remote sensus-ing data- An investigation on possible approaches for natural forest. J.Biosci., 21(4): 535-561.
Saugier, B. and Roy, J. 2001. Estimations of global ter-restrial productivity; converging towards a single number? In: Global terrestrial productivity: past, present and future. Eds.: Roy, J.; Saugier, B. and Mooney, H.A. Academic Press, New York.
Saxena, A.; Jha, M.N. and Rawat, J.K. 2003. Forests as Carbon Sink-The Indian Scenario. Indian Forester
129(7):807-814.
Schwartz, D. and Namri,M. 2002. Mapping the total
organic carbon in the soils of the Congo. Global Planet Change, 681: 77-93.
Sharma, S.; Bhattacharya, S. and Garg, A. 2006. Green-house gas emissions from India: a perspective. Cur-rent Science 90(3): 326–333.
Shukla, P.R. 2006. India’s GHG emission scenarios: Aligning development and stabilization paths. Cur-rent Science, 90 (3): 384-395.
Singh, J.S. and Singh, S.P. 1985. An integrated ecologi-cal study of Eastern Kumaun Himalaya with empha-sis on natural resources. Report for DST Sponsored project, Botany Department, Kumaun University, Nanital.
Susott, R. A.; Olbu, G. J.; Baker, S. P.; Ward, D. E.; Kauffman, J. B. and Shea, R. W. 1996. Carbon, hy-drogen, nitrogen, and thermogravimetric analysis of tropical ecosystem biomass, in J. S. Levine, (ed.), Biomass Burning and Global Change, MIT Press, Cambridge, MA. pp. 249–259.