IMPROVING FACILITIES LIFECYCLE MANAGEMENT USING
RFID LOCALIZATION AND BIM-BASED VISUAL ANALYTICS
Ali Motamedi
A Thesis
in
the Individualized Program
Presented in Partial Fulfillment of the Requirements
for the Degree of Doctor of Philosophy (Individualized Program) at
Concordia University
Montreal, Quebec, Canada
August 2013
ii
CONCORDIA UNIVERSITY SCHOOL OF GRADUATE STUDIES This is to certify that the thesis prepared
By: Ali Motamedi
Entitled: IMPROVING FACILITIES LIFECYCLE MANAGEMENT USING RFID LOCALIZATION AND BIM-BASED VISUAL ANALYTICS and submitted in partial fulfillment of the requirement for the degree of
Doctor of Philosophy (INDI)
complied with the regulations of the University and meets with the accepted standards with respect to originality and quality.
Signed by the final examining committee:
Dr. Syed Ahsan Chair
Dr. Mohamed Al-Hussein External Examiner Dr. Mamoun Medraj External to Program Dr. Yong Zeng Examiner
Dr. Anjali Awasthi Examiner
Dr. Amin Hammad Thesis Supervisor
Approved by Chair of Department or Graduate Program Director
m Dean of Faculty
iii
ABSTRACT
Improving Facilities Lifecycle Management Using RFID Localization and BIM-Based Visual Analytics
Ali Motamedi
Concordia University, 2013
Indoor localization has gained importance as it has the potential to improve various processes related to the lifecycle management of facilities, such as the manual search to find assets. In the operation and maintenance phase, the lack of standards for interoperability and the difficulties related to the processing of large amount of accumulated data from different sources cause several process inefficiencies. For example, identifying failure cause-effect patterns in order to prepare maintenance plans is difficult due to the complex interactions and interdependencies between different building components and the existence of the related data in multiple, fragmented sources.
Building Information Modelling (BIM) is emerging as a method for creating, sharing, exchanging and managing the information throughout the lifecycle of buildings. Radio Frequency Identification (RFID), on the other hand, has emerged as an automatic data collection technology, and has been used in different applications for the lifecycle management of facilities. The previous research of the author proposed permanently attaching RFID tags to assets where the memory of the tags is populated with their accumulated lifecycle information taken from a standard BIM database to enhance various lifecycle processes. This thesis builds on this framework and investigates several methods for supporting lifecycle management processes of assets by using BIM, RFID
iv
and visual analytics. It investigates the usage of location-related data that can be retrieved from a BIM and are stored on RFID tags. It also investigates the usage of RFID technology for indoor localization of RFID-equipped assets using handheld readers. The research proposes using the location data saved on the tags attached to fixed assets to locate them on the floor plan. These tags also act as reference tags to locate moveable assets using received signal pattern matching and clustering algorithms. Additionally, the research investigates extending BIM to incorporate RFID information. It provides the opportunity to interrelate BIM and RFID data using predefined relationships. For this purpose, a requirements’ gathering is performed to add new entities, data types, relationships, and property sets to the BIM. Moreover, the research investigates the potential of BIM visualization to help facilities managers make better decisions in the operation and maintenance phase of the lifecycle. It proposes a knowledge-assisted BIM-based visual analytics approach for failure root-cause detection in facilities management where various sources of lifecycle data are integrated with a BIM and used for interactive visualization exploiting the heuristic problem solving ability of field experts.
v
ACNOWLEDGEMENT
My greatest appreciation goes to my supervisor, Dr. Amin Hammad for his intellectual and personal support, encouragement and patience. His guidance, advice and criticism was my most valuable asset during my studies. Overall, I feel very fortunate having the opportunity to know him and work with him.
I would like to thank my research colleagues for their kind support in developing the simulation environment, preparing 3D models and performing field tests. I would like to acknowledge the contributions of Mr. Mohammad Soltani for developing the simulation environment, software programming of the RFID data logger application, and his help performing RFID localization field tests. His enthusiasm in conducting research was a great asset in our collaboration. I appreciate his recommendations related to RFID localization and BIM extension modules of my research. Mr. Shayan Setayeshgar has contributed to this research by developing several 3D models for the BIM extension project. His technical knowledge together with his teamwork skills made our collaboration very successful. Mr. Yoosef Asen developed the BIM model for the Genomics Research Center and assisted in developing the case study for FM visual analytics project. Mr. Kehinde Adetiloye helped in developing the mobile application for fixed asset localization. The cooperation of Mr. Barry Allen from Identec Solutions is also appreciated.
I would like to thank my colleagues at Concordia University Facilities Management Department with whom I had the chance to work on a part-time basis during my Ph.D. study. The data collection and the execution of the case studies of this thesis could not be
vi
done without the information and help provided by them. I would like to express my appreciation to Mr. Paul Blouin for his invaluable support and acknowledge the help of Mr. Stephan Drolet and Mr. Denis Dumont for helping in the development of the fault-tree analysis example.
Last but not least, I would like to thank the members of my thesis committee, for spending their precious time reading this thesis and for providing me with constructive feedbacks and suggestions. I gratefully appreciate my supervisory committee for their helpful advice, support, and valuable comments.
This research has been supported by the Natural Sciences and Engineering Research Council (NSERC) Doctoral Fellowship, Fonds Québécois de la Recherche sur la Nature et les Technologies (FQRNT) Bourses de Doctorat en Rechercheh, and Concordia University Merit Scholarship.
vii
DEDICATION
To My parents, Forough Asfa and Mehdi Motamedi and my brother Mohammad who made all of this possible, for their endless encouragement and support.
viii
TABLE OF CONTENTS
List of Figures ... xiv
List of Tables ... xvii
List of Abbreviations (Nomenclature) ... xix
CHAPTER 1 Introduction... 1
1.1 General Background ... 1
1.2 Problem statement and Research Gaps ... 2
1.3 Research Vision and Objectives ... 6
1.4 Thesis Organization... 7
CHAPTER 2 Literature Review ... 10
2.1 Introduction ... 10
2.2 Radio Frequency Identification (RFID) ... 10
2.2.1 A Brief History of RFID ... 11
2.2.2 RFID Technology Components ... 12
2.2.3 Ubiquitous Computing and Intelligent Products... 16
2.2.4 RFID and Intelligent Products ... 18
2.3 Localization and RTLS ... 19
2.3.1 Importance of Location Data ... 19
2.3.2 Localization Levels ... 21
ix
2.3.4 Indoor Localization ... 23
2.3.5 RFID-based Indoor Localization ... 25
2.4 Building Information Modeling (BIM) ... 29
2.4.1 Definition and Scope of BIM ... 29
2.4.2 BIM Data Storage, Exchange and Sharing Models ... 30
2.4.3 Industry Foundation Classes (IFC) ... 31
2.4.4 National Building Information Model Standard (NBIMS) ... 35
2.4.5 Facilities Lifecycle Management Using BIM ... 35
2.5 Lifecycle Management Using RFID and BIM ... 37
2.5.1 System Interaction Design ... 38
2.5.2 Data Capture Methods ... 39
2.5.3 Conceptual Data Structure ... 40
2.6 Building Knowledge Sources ... 44
2.6.1 Asset/System Hierarchies ... 44
2.6.2 System Modeling and Operational Procedures ... 45
2.6.3 FM Expert Systems ... 45
2.6.4 Condition Assessment Systems (CAS) ... 46
2.6.5 Fault/failure Modeling ... 47
2.7 Visualization for FM ... 49
x
2.7.2 Visual Analytics (VA) ... 52
2.8 Summary and Conclusions ... 53
CHAPTER 3 Overview of the Proposed Methodology ... 54
3.1 Introduction ... 54
3.2 Lifecycle Location Management Using RFID ... 55
3.3 Localization of RFID-Equipped Assets During the Operation Phase of Facilities ... 61
3.4 Extending BIM to Incorporate Information of RFID Tags Attached to Building Assets ... 62
3.5 Knowledge-Assisted BIM-Based Visual Analytics for Failure Root-cause Detection in Facilities Management ... 64
3.6 Relationship with Intelligent Products, IoT and Ubiquitous Computing ... 65
3.7 Summary and Conclusions ... 67
CHAPTER 4 Localization of RFID-Equipped Assets During the Operation Phase of Facilities ... 68
4.1 Introduction ... 68
4.2 Overview of Proposed Method ... 69
4.3 Location Information Source ... 69
4.4 Asset Categorization ... 71
4.5 Fixed Assets Localization ... 72
xi
4.5.2 Process of Fixed Asset Localization ... 74
4.6 Moveable Assets Localization ... 75
4.6.1 Process of Movable Tags Localization ... 76
4.6.2 Filtering and Averaging ... 78
4.6.3 Pattern Matching Algorithm ... 81
4.6.4 Identifying the Target Area by Clustering Reference Tags ... 82
4.6.5 Positioning Based on Clustering Results ... 86
4.6.6 Accuracy Calculation ... 87
4.7 User Localization ... 87
4.8 Development of a Simulation Environment ... 88
4.9 Testing and Validation ... 91
4.9.1 Testing RFID Characteristics ... 91
4.9.2 Localization Accuracy Comparison Using Simulation... 92
4.9.3 Case Study for Fixed Assets Localization ... 95
4.9.4 Case Studies for Moveable Assets Localization ... 96
4.10 Summary and Conclusions ... 102
CHAPTER 5 Incorporating Information of RFID Tags Attached to Building Components to the BIM ... 104
5.1 Introduction ... 104
xii
5.2.1 Sample Scenario: Updating Asset’s Inspection Results on its RFID Tag 106 5.2.2 Sample Scenario: Updating the Location Coordinates of Assets on a
Location Tag ... 107
5.3 Proposed Extension for IFC ... 108
5.3.1 Requirements Gathering for RFID System Definitions ... 108
5.3.2 Relationships with Other Objects ... 115
5.4 Case Study ... 118
5.4.1 Modeling RFID Tags in BIM Application... 118
5.4.2 Adding Relationships Using EXPRESS Language ... 121
5.5 Summary and Conclusions ... 125
CHAPTER 6 Knowledge-Assisted BIM-Based Visual Analytics for Failure Root-cause Detection in Facilities Management ... 127
6.1 Introduction ... 127
6.2 Proposed Approach for FM Visual Analytics ... 128
6.2.1 Current Practice vs. FMVAS ... 128
6.2.2 FMVAS Architecture ... 129
6.2.3 Visual Analytics Scenario Process Flow ... 130
6.3 Steps to Realize FMVAS ... 131
6.3.1 Data Integration ... 132
xiii
6.3.3 FMVAS Engine ... 139
6.3.4 Visualization in 3D or 4D ... 139
6.4 Case Study ... 140
6.5 Summary and Conclusions ... 147
CHAPTER 7 Summary, Conclusions and Future Work ... 148
7.1 Introduction ... 148
7.2 Summary of Research ... 149
7.3 Research Contributions and Conclusions ... 151
7.4 Limitations and Future Work ... 154
REFERENCES ... 156
APPENDICES ... 180
Appendix A - List of Related Publications ... 181
Appendix B – Process Flow for Visualizing Chain of Events ... 183
Appendix C - Technical Specifications for RFID Tags, READERS, and Handheld Device Used in The Research ... 184
xiv
LIST OF FIGURES
Figure 2-1 RFID system (Motamedi et al., 2009) ... 13
Figure 2-2 RF localization hierarchy (Motamedi et al., 2013) ... 26
Figure 2-3 The overall architecture of the IFC model (IFC, 2013) ... 33
Figure 2-4 Process data update (Motamedi and Hammad, 2009a) ... 43
Figure 2-5 Example of tag-data usage in the operation phase (Motamedi et al., 2011) ... 44
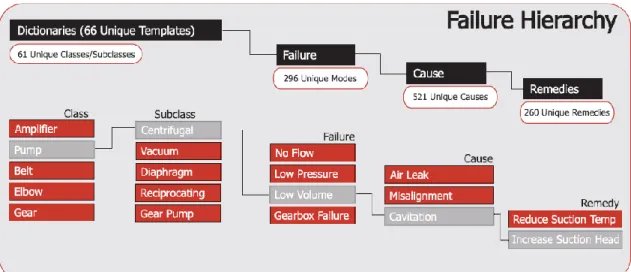
Figure 2-6 Sample failure hierarchy for a centrifugal pump (MRG, 2009) ... 48
Figure 2-7 Symbols used to show maintenance and repairs of components (Akcamete et al., 2010) ... 51
Figure 2-8 HVAC 3D drawing of one floor during the maintenance phase ( Hammad and Motamedi, 2007) ... 52
Figure 3-1 Thesis structure and content relationships ... 55
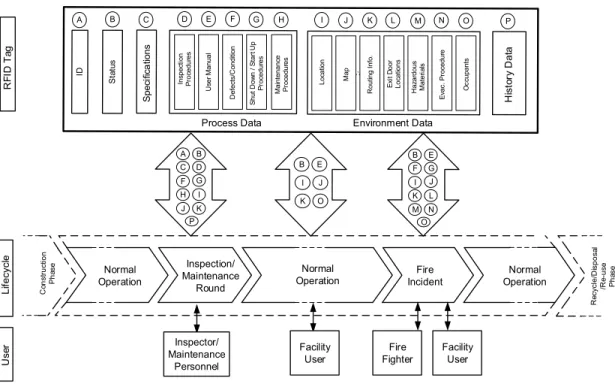
Figure 3-2 Examples of lifecycle location-related data on the RFID tag ... 60
Figure 4-1 RTLS-based location tracking... 71
Figure 4-2 Location tracking based on RFID data... 71
Figure 4-3 Location-tags placement ... 74
Figure 4-4 Process flowchart of fixed asset localization ... 75
Figure 4-5 Sample scenario of localization process ... 77
Figure 4-6 Process flowchart of localizing a specific movable target asset ... 78
Figure 4-7 Various types of RSSI patterns ... 79
Figure 4-8 Sample logged data and control chart ... 80
Figure 4-9 Reference tags clustering ... 84
xv
Figure 4-11 Sample simulation input data and results ... 90
Figure 4-12 RSSI vs. distance relationship ... 92
Figure 4-13 Shape of data collection path vs. CMTL error ... 93
Figure 4-14 Fixed asset localization software ... 96
Figure 4-15 Obstacle-free test ... 97
Figure 4-16 Preliminary test setup ... 99
Figure 4-17 Field test in cluttered and noisy environment ... 101
Figure 5-1 Conceptual BIM-tag data relationship (Motamedi and Hammad, 2009a) .... 106
Figure 5-2 Process flowchart to update inspection data ... 107
Figure 5-3 Flowchart of the process to update assets' coordinates on a location tag... 108
Figure 5-4 IFC hierarchy for RFID system... 110
Figure 5-5 IFC containment relationships (adapted from IFC, 2013) ... 115
Figure 5-6 RFID tag attachment and assignment relationships ... 115
Figure 5-7 Decomposition relationship ... 116
Figure 5-8 RFIDSystem connectivity and ports ... 117
Figure 5-9 Modeled RFID tag attached to the wall ... 119
Figure 5-10 Assignment of an active location tag to rooms ... 119
Figure 5-11 Assignment of selected assets to a tag ... 120
Figure 5-12 Case study entities and relationships... 121
Figure 6-1 (a) Current practice of using CMMS reports, (b) Proposed method to provide visualization for FM stakeholders ... 129
xvi
Figure 6-3 Examples of spatial and logical relationships between components and spaces
... 135
Figure 6-4 Fault tree for high temperature incident in rooms ... 137
Figure 6-5 FMVAS engine process ... 139
Figure 6-6 Prototype system modules... 141
Figure 6-7 Relations between tables in the database ... 143
Figure 6-8 Flowchart of FMVAS prototype ... 144
Figure 6-9 Sample SQL query ... 145
xvii
LIST OF TABLES
Table 2-1 Comparison of indoor localization techniques (Li and Becerik-Gerber, 2011) 24 Table 2-2 Tag and reader localization (adopted from Papapostolou and Chaouchi, 2011)
... 27
Table 2-3 Sample failure code table (PEMMS, 2003) ... 47
Table 4-1 Accuracy comparison between three-tag and four-tag CMTL localization for different data collection paths and reference tag densities ... 94
Table 4-2 Accuracy comparison between CMTL and LANDMARC for different data collection paths and reference tag densities ... 94
Table 4-3 β value for field test and one instance of the simulation (obstacle-free environment) ... 98
Table 4-4 Comparison between field test and simulated results for 3 and 4 tags ... 98
Table 4-5 β values for preliminary test (environment with obstacle) ... 99
Table 4-6 Accuracy comparison of CMTL and LANDMARC methods (environment with obstacles)... 101
Table 4-7 Effect of increasing the number of data collection points ... 102
Table 5-1 Shared property sets for RFID system ... 111
Table 5-2 Proposed property sets ... 113
Table 5-3 Definitions and properties of ports ... 118
Table 5-4 Data saved on the tags ... 121
Table 5-5 Part of EXPRESS code for the model ... 124
Table 6-1 Process flow for root-cause detection visual analytics ... 131
xviii
xix
LIST OF ABBREVIATIONS (NOMENCLATURE)
Abbreviation Description
AEC/FM Architecture, Engineering, Construction, and Facilities Management
A-GPS Assisted GPS
ANN Artificial Neural Network
AoA Angel of Arrival
API Application Programming Interface
BIM Building Information Modeling
BSA BuildingSMART Alliance
CAD Computer-Aided Design
CAFM Computer Aided Facilities Management
CAS Condition Assessment Systems
CMMS Computerized Maintenance Management System CMTL Cluster-based Movable Tag Localization
COBIE Construction Operations Building Information Exchange
DoD Department of Defense
DOM Document Object Model
EAM Enterprise Asset Management
EAS Electronic Article Surveillance
EPC Electronic Product Code
ERP Enterprise Resource Planning
FM Facilities Management
FMVAS FM Visual Analytics System
GPS Global Positioning System
xx
HVAC Heating, Ventilation and Air Conditioning IAI International Alliance of Interoperability IFC Industry Foundation Classes
IFF Identity Friend or Foe
INS Inertial Navigation Systems
IoT Internet of Things
ISO International Organization for Standardization
kNN k-Nearest Neighbors
LBS Location-Based Services
LED Light Emitting Diode
LF Low Frequency
LoS Line-of-Sight
MVD Model View Definition
NBIMS National Building Information Model Standard NIBS National Institute of Building Sciences
O&M Operation and Maintenance
PDA Personal Digital Assistant
PLM Product Lifecycle Management
PoA Phase of Arrival
PSet Property Set
RF Radio Frequency
RFID Radio Frequency Identification
RSS Received Signal Strength
RSSI Received Signal Strength Indicator
RTLS Real-Time Location System
xxi
SCM Supply Chain Management
SMP Smallest M-vertex Polygon
STEP Standard for the Exchange of Product model data
SVM Support Vector Machine
TdoA Time Difference of Arrival
ToA Time of Arrival
UHF Ultrahigh Frequency
UWB Ultra Wide Band
VA Visual Analytics
WLAN Wireless Local Area Network
1
CHAPTER 1 INTRODUCTION
GENERAL BACKGROUND
1.1
The Operation and Maintenance (O&M) is the longest and the most costly phase of facilities’ lifecycle. The cost for the O&M constitutes 75 percent of the total cost of ownership (Singh et al., 2009). Facility managers are responsible for major corporate assets that often accounts for 35 to 50 percent of an organization’s balance sheet (Jordani, 2010). The costs can be reduced by utilizing new methods and technologies to improve the efficiency of existing processes.
Singh et al. (2009) stated the cost-saving potential in the O&M phase of the life cycle when all the information is collected and made available in early planning and design phases and continues to accumulate to mine maximum savings. The NIST Interoperability Study (Gallaher et al., 2004) indicated that two-thirds of the estimated $15.8 billion lost are due to inadequate interoperability during the O&M phases (Rundell, 2006; Jordani, 2010).
Building Information Modeling (BIM) has been developed in order to tackle the problems related to interoperability and information integration by providing effective management, sharing and exchange of a building information throughout its entire lifecycle (Isikdag et al., 2008). A BIM database contains information about the geometry of the building as well as the lifecycle data of its components. Therefore, owners and operators can mitigate their portion of the cost associated with the lack of interoperability by using the high-quality building information from a BIM during the longer, more expensive O&M phase of the building’s lifecycle (Rundell, 2006).
2
The framework developed in our previous research has proposed adding structured information taken from the BIM database to Radio Frequency Identification (RFID) tags attached to building assets (Motamedi and Hammad 2009a, 2009b). RFID is a type of automatic identification technology in which radio frequencies are used to capture and transmit data (Aimglobal, 2008). RFID based systems have been used in different applications in construction and maintenance, such as component tracking, inventory management, equipment management, progress management, facilities and maintenance management, tool tracking, material management, and quality control (for example, Jaselskis and El-Misalami, 2003; Song, 2005; Motamedi and Hammad, 2007; Ergen et al., 2007a; and Kiziltas et al., 2008). Based on our previous research (Motamedi and Hammad, 2009a), RFID tags are permanently attached to assets at an early stage of lifecycle and the stored information on tags is beneficial for several lifecycle processes and is used by various stakeholders. Having tags attached to assets results in a massive tag cloud in the building which can be used for localizing RFID-equipped assets and people.
PROBLEM STATEMENT AND RESEARCH GAPS
1.2
The key problem of facilities O&M process inefficiencies can be attributed to the following main issues: (1) The existence of wasteful manual operations, such as manual search to find assets, (2) The lack of standards for interoperability between various systems, and (3) The difficulties related to the processing of large amount of accumulated data from different sources in the O&M phase. The details of the above-mentioned issues are presented as follows:
3
(1) Regarding the first issue of manual operations to locate assets; the productivity of labor can be improved by minimizing the time they spend searching for critical assets and equipment. For example, a study done in a typical hospital building showed that the location of 15 to 20 percent of assets is unknown and the time spent searching for these assets equates to $1900 per nurse (Cisco, 2007). To tackle this problem, the users can be provided with locations of assets in order to decrease their search time. Location information can be used by occupants unfamiliar with a building to navigate and find their destinations. Hence, indoor location information is especially valuable as it has the potential to improve the utilization and maintenance of facilities. The Global Positioning System (GPS) technology provides solutions for outdoor localization. However, so far no single indoor localization solution has been universally adopted (Li and Becerik-Gerber, 2011). Although several radio frequency-based methods have been introduced to provide accurate indoor localization, these methods suffer from the lack of precision and accuracy, inability to adapt to changes in the environment, and high implementation cost due to the need for fixed infrastructure (Li and Becerik-Gerber, 201; Papapostolou and Chaouchi, 2011).
RFID technology has been employed for localization in indoor environments in various research projects (e.g., Hightower and Borriello, 2001; Ni et al., 2003). However, the main shortcoming of RFID based localization is the interference of the environment of the building on radio frequency, which makes it sensitive to changes in the environment resulting in inconsistent performance (Papapostolou and Chaouchi, 2011). The RFID tag localization methods introduced by various research projects mainly require fixed infrastructure of RFID readers (e.g., Ni et al., 2003; Zhen et al., 2008). This infrastructure
4
imposes high implementation cost and low flexibility for localization as the system can only detect tags that are within the covered areas by fixed readers. With the advent of mobile computing, there is a need for localization methods that utilize handheld devices (such as Personal Digital Assistants (PDAs) and smartphones) equipped with RFID readers for localization of tagged assets. Moreover, using handheld devices to localize assets brings flexibility to users and enables them to look for assets anywhere in the facility without relying on the presence of localization infrastructure in certain covered areas. Additionally, most of RFID tag localization techniques that operate based on converting the radio signal strength to distance values perform poorly in the noisy and cluttered indoor building environments (Xu et al., 2012). As the result, there is a need to investigate new RFID-based indoor localization methods that consider the above-mentioned problems.
(2) Regarding the second issue on the lack of standardization; the BIM database is mandated to contain data related to all aspects of the facility (e.g., geometry, mechanical systems, construction scheduling) that are accumulated throughout the lifecycle. Currently, BIM standards are evolving and various BIM-compatible applications are introduced in the market. Consequently, various types of data that are useful for building’s stakeholders are required to be defined and added to available standards. On the other hand, RFID based systems are used in various applications in construction, operation and maintenance of facilities. The use of RFID tags attached to building components to store their lifecycle information has been proposed by Motamedi and Hammad (2009a). However, there is no formal definitions of RFID systems in the BIM
5
yet. Consequently, there is a need to incorporate the definitions of this technology into available standards.
(3) Regarding the third issues on the difficulties of processing large amount of fragmented data; decisions on maintenance-related tasks are usually made based on various types of accumulated historical data, such as design drawings, inspection records, and sensing data (Chen and Wang, 2009). Most of these data are text-based which makes the process of correlating information time-consuming and less intuitive. For example, discovering the root-cause of a problem based on the data recorded in a Computerized Maintenance Management System (CMMS) is difficult and prone to failure. This is due to the complexity of interrelations between various building components and systems (Ahluwalia, 2008), multiplicity of building components and various changing environmental factors. Although BIM is emerging as the main repository of information for the lifecycle of buildings, the use of BIM data in the O&M phase of building’s lifecycle is limited. Becerik-Gerber et al. (2012) performed interviews with Facilities Management (FM) personnel to identify the role of BIM in FM. Their study shows that most of current FM functions are done manually and that using BIM in FM can decrease the chances of errors and increases efficiency. BIM has the potential to help improving the quality of FM by visualizing the large amount of lifecycle data that is available. The visualization potentials of BIM for finding root cases of problems or trends has not been fully explored. This is due to the fact that lifecycle information about building assets and systems are fragmented and are hosted in several different applications (e.g. CMMS, Computer Aided Facilities Management (CAFM), and Enterprise Asset Management (EAM)) that are not tightly interconnected. Hence, there is a research gap in the area of
6
integrating various sources of building’s data and knowledge. Additionally, there is a research gap in using these knowledge and data sources with the native BIM visualization capabilities for problems’ root-cause detection. This is possible by providing experts with various types of background knowledge and data, and a flexible visualization tool that allows them to utilize their cognitive and perceptual reasoning for problem solving.
RESEARCH VISION AND OBJECTIVES
1.3
This research investigates the usage of available mass of RFID tags in a building for indoor localization of RFID-equipped assets during the operation phase of facilities. It investigates a framework to store location-related data on the RFID tags attached to various assets in the building. The aim is to propose an asset localization method that is tailored to operate within buildings and adapt to requirements and conditions of facility management personnel. Hence, the proposed method should operate in noisy and cluttered environment with the possibility of frequent layout changes.
The research also proposes extending the BIM standard to incorporate the definitions of RFID technology in order to map the data to be stored on RFID memory to associated entries in a BIM database. This can be done by identifying relationships between RFID tags and building assets to provide the opportunity to interrelate BIM data and RFID data using predefined relationships. Eventually, the data related to objects that are required to be saved on RFID tags can be automatically selected using defined relationships in a BIM.
Finally, the research proposes a knowledge-assisted BIM-based Visual Analytics (VA) approach for failure root-cause detection in FM where CMMS inspection and
7
maintenance data can be integrated with a BIM and used for interactive visualization exploiting the heuristic problem solving ability of field experts.
The specific objectives of the current research are: (1) to explore the possibility of using RFID tags attached to assets for localization purpose and to investigate new methods for localizing various types of RFID-equipped assets during the O&M phase; (2) to perform requirements’ gathering and to extend BIM by defining RFID system components, their properties, and their relationships with other building elements; and (3) to investigate the potential of knowledge-assisted BIM-based VA for the failure root-cause detection scenario by considering the BIM as the primary data source for information related to building lifecycle; and (4) to investigate the applicability of the proposed methods using several case studies.
THESIS ORGANIZATION
1.4
This study will be presented as follows:
Chapter 2 Literature review: This chapter reviews the concepts, techniques, major technologies and standards that are used in the research. The literature review comprises the information about RFID technology, the concepts of ubiquitous computing and intelligent products, Real-Time Location System (RTLS) technologies, context aware information delivery, BIM technology, and other building knowledge sources. Our previously proposed approach for lifecycle management of assets using RFID and BIM technologies is reviewed in detail. Complimentary to the BIM, the literature related to visual analytics techniques to support O&M activities in the building for the purpose of failure root-cause detection is reviewed.
8
Chapter 3 Overview of the proposed methodology: In this chapter the idea of lifecycle location management using RFID technology is discussed. It includes examples of location-related data that can be saved on RFID tags and can be used during the lifecycle of the asset. This chapter also briefly discusses the different modules of the proposed methodology including the motivations and brief overview for each module. It contains a summary figure that shows various modules and their relationships to the literature review contents.
Chapter 4 Localization of RFID-equipped assets during the operating phase of facilities:
This chapter elaborates on the proposed approach to use RFID technology to localize various types of assets that are equipped with RFID tags. The main focus of this chapter is on the localization of movable assets using a mobile RFID reader. The chapter includes various case studies that have been performed in order to validate the approach.
Chapter 5 Incorporating information of RFID tags attached to building components to the BIM: This chapter elaborates on the proposed approach to incorporate definitions of RFID tags into the BIM. The chapter includes, requirements’ gathering, model view definition (MVD), and a case study related to the discussed topics.
Chapter 6 Knowledge-assisted BIM-based visual analytics for failure root-cause detection in facilities management: This chapter elaborates on the proposed approach to utilize BIM and other building knowledge sources for providing customized visualizations to help facility operators find the root-causes of failures. The chapter includes a case study to demonstrate how the proposed approach can be applied.
9
Chapter 6 Summary, Conclusions, and Future Work: This chapter summarizes the present research work, highlights its contributions, and suggests recommendations for future research.
10
CHAPTER 2 LITERATURE REVIEW
INTRODUCTION
2.1
In this chapter, major technologies and standards related to RFID, ubiquitous computing RTLS, BIM, building knowledge sources, and visual analytics are introduced and related literature is discussed. The literature review comprises the history of RFID technology, its components and details about different tag types and operating frequencies. It elaborates on the concepts of ubiquitous computing and intelligent products, their relation to RFID technology and an insight of future developments. Reviewing localization methods and RTLS technologies is another major part of the literature review. This part focuses on the methods that utilize RFID technology for localization. BIM technology is also covered in this chapter, including data storage/exchange/sharing models, Industry Foundation Classes (IFC), and projects related to extending the IFC. Our previously proposed approach for lifecycle management of assets using RFID and BIM technologies is reviewed in detail. Complimentary to BIM and lifecycle management, the literature related to various knowledge sources that support the O&M processes of the buildings are explained. Furthermore, the applications of visual analytics to support O&M activities in the building are reviewed.
RADIO FREQUENCY IDENTIFICATION (RFID)
2.2
RFID has emerged as an automatic data collection and information storage technology and has been used in different applications in construction and maintenance (Domdouzis et al., 2007; Motamedi and Hammad, 2009a; Wang et al., 2007), such as component tracking, inventory management, equipment monitoring, progress management, facilities
11
and maintenance management, tool tracking, material management, and quality control (e.g., Jaselskis and El-Misalami, 2003; Song, 2005; Ergen et al., 2007a; and Kiziltas et al., 2008). An RFID tag is a memory storage device for storing a certain amount of data (e.g., the product ID, price and manufacturing date) that can be read wirelessly providing the ability to access large volumes of multiple data sets from multiple tags simultaneously (Chao et al., 2007; Domdouzis et al., 2007). Similar to barcodes, RFID is a technology for identifying and tracking objects. However, RFID technology introduces several advantages over barcoding in that its operation does not require line-of-sight and clean environments, and the stored data are modifiable. RFID has been identified as one of the ten greatest contributory technologies of the 21st century (Chao et al., 2007). An increasing variety of enterprises are employing RFID to improve their efficiency of operations and to gain a competitive advantage (Chao et al., 2007).
2.2.1 A BRIEF HISTORY OF RFID
Ernst F.W. Alexanderson in 1906 showed how the first radio wave can be continuously generated and how radio signals can be transmitted (Landt, 2005). During World War II, the British wanted to distinguish between their own returning aircrafts and those of the enemy. They installed radio transponders on their aircrafts which were able to respond appropriately to interrogating signals from base stations. This was called the Identity Friend or Foe (IFF) system which is widely considered the first use of RFID (Dittmer, 2004; Domdouzis et al., 2007).
Harry Stockman (1948) published a paper entitled “Communication by Means of Reflected Power”. In 1964, R.F. Harrington examined the electromagnetic theory related to RFID in a paper entitled “Theory of Loaded Scatterers”. In the late 1960s, two
12
companies called Sensormatic and Checkpoint together with another company called Knogo, developed the Electronic Article Surveillance (EAS) equipment to prevent the theft of merchandise (Landt, 2005; Domdouzis et al., 2007).
The first commercial application of RFID was developed in Norway in 1987 and was followed by the Dallas North Turnpike in the United States in 1989. During the 90s, a number of American states adopted a traffic management system which was based on the use of readers that could detect RFID tags (Domdouzis et al., 2007). Later on, several companies were involved in the development of a common standard for electronic tolling applications. More recently, much smaller RFID tags have been developed. RFID tags are built in the form of labels and placed on the objects which are going to be managed (Domdouzis et al., 2007).
2.2.2 RFID TECHNOLOGY COMPONENTS
RFID technology is a wireless technology based on the detection of electromagnetic signals (McCarthy et al., 2003). A basic RFID system consists of three components: an antenna, a transceiver with a decoder (RFID reader) and a transponder (RFID tag) electronically programmed with information. The emission of radio signals by the reader’s antenna activates a tag to read or write data from/to it. The transceiver is responsible for the data acquisition and communication. The antenna can be packaged with the transceiver and decoder in order to become a reader. The reader can be configured either as a handheld or a fixed-mount device. It can be part of other mobile computing and communication devices, such as cell phones or PDAs. If an RFID tag is placed in the electromagnetic zone produced by the reader’s antenna, it detects the activation signal and responds by sending the stored data in the form of electromagnetic
13
waves. The reader decodes the data which are encoded in the Integrated Circuit (IC) of the tag and passes them to the host computer system for processing (Domdouzis et al., 2007; Aimglobal, 2008). A typical RFID system is shown in Figure 2-1.
RFID Tag /
Transponder Reader/Antenna Computer
Figure 2-1 RFID system (Motamedi et al., 2009)
2.2.2.1 Tag Types
Two major types of RFID tags are available: active and passive. Active RFID tags are powered by an internal battery. The memory size of an active tag varies and some tags have more than 1 MB of memory (Scansource, 2008). The power supplied by the internal battery of an active tag generally gives it a longer read range. Active tags are usually bigger and more expensive than passive ones and have a limited operational life which may yield a maximum of 10 years, depending on operating temperatures and battery type (Aimglobal, 2008).
Passive RFID tags do not need any external power source and obtain operating power generated from the reader. Passive tags are consequently much lighter than active tags, less expensive, and offer a virtually unlimited operational lifetime. The trade-off is that they have shorter read ranges than active tags (Scansource, 2008).
14
2.2.2.2 Operating Frequencies
RFID systems currently operate in the Low Frequency (LF), High Frequency (HF) and Ultrahigh Frequency (UHF) bands. Each frequency has advantages and disadvantages relative to its capabilities. Generally a lower frequency means a lower read range and slower data read rate, but better capabilities for reading near or on metal or liquid surfaces compared with higher frequencies (Scansource, 2008).
2.2.2.3 RFID Standards
Standards are critical for RFID applications in areas, such as payment systems and Supply Chain Management (SCM). There are RFID standards related to the air interface protocol (communication details between tags and readers), data content (the way data are organized or formatted), conformance (ways to test that products meet the standard) and applications (how standards are used on shipping labels, for example) (Violino, 2005).
The International Organization for Standardization (ISO) and the Electronic Product Code (EPC) Global have both been leading the standardization debate. The ISO has introduced the 18000 standard and the EPC Global Center has introduced the EPC standard. The standardization situation was complicated by the fact that the Auto-ID Center, which developed EPC technologies, chose to create its own air interface protocol for tracking goods through the international supply chain (Violino, 2005). Wal-Mart decided to use the EPC standard, where the Department of Defense (DoD) uses the EPC for general purposes, but uses the ISO standard for air interface, which puts pressure on the ISO and EPC to come to an agreement (Scansource, 2012).
15
The Auto-ID Center developed its own UHF protocol. Originally, the center planned to have one protocol that can be used to communicate with different classes of tags. Each successive class of tags would be more sophisticated than the one before it. The classes changed over time, but the following is what was originally proposed (Violino, 2005). More details on tag class definitions can be found in GS1 (2007).
• Class 1: a simple, passive, read-only backscatter tag with one-time, field-programmable non-volatile memory.
• Class 2: a passive backscatter tag with up to 65 KB of read-write memory.
• Class 3: a semi-passive backscatter tag, with up to 65 KB read-write memory; essentially, a Class 2 tag with a built-in battery to support increased read range. • Class 4: an active tag that uses a built-in battery to run the microchip’s circuitry
and to power a transmitter that broadcasts a signal to a reader.
• Class 5: an active RFID tag that can communicate with other Class 5 tags and/or other devices.
In 2004, EPCglobal began developing a second-generation protocol (Gen 2). The aim was to create a single, global standard that would be more closely aligned with ISO standards. Gen 2 was approved in December 2004 and RFID vendors that had worked on the ISO UHF standard also worked on Gen 2 (Violiono, 2005). The RFID Network (RFIDNet, 2012) has assembled a quick reference list that contains a complete and updated list of ISO standards related to RFID.
16
2.2.3 UBIQUITOUS COMPUTING AND INTELLIGENT PRODUCTS
Friedewald and Raabe (2011) defined ubiquitous computing as “countless very small, wirelessly intercommunicating microprocessors, which can be more or less invisibly embedded into objects”. Such objects have a quality that they know, for example, where they are, which other things are in the vicinity and what happened to them in the past. It is predicted by Friedewald and Raabe (2011) that ubiquitous computing can pervade all spheres of life, such as increasing comfort in the private home area, improving energy efficiency, increasing work productivity and monitoring the health of the user (Aarts and Encarnaçao, 2005).
The new technologies have contributed to the development of systems that can autonomously communicate with each other, such as smart objects (Mattern, 2003; Siegemund, 2004; Kortuem et al., 2010; SEC, 2008; Khoo, 2010). The smart objects (intelligent products) are one of the technologies to watch with a time-to-adoption horizon of four to five years (HorizonProject, 2012). McFarlane et al. (2003) defined an
intelligent product with the following properties: (1) Possession of a unique identification; (2) Capability of communicating effectively with its environment; (3) Retaining or storing data about itself; (4) Deploying a language to display its features, production requirements, etc.; and (5) Capability of participating in or making decisions relevant to its own destiny. Based on this definition, Wong et al. (2002) have defined a product with Level 1 intelligence when the product covers points 1-3. Kärkkäinen et al. (2003) stated that the fundamental idea behind an intelligent product is the inside-out control of the supply chain deliverables and of products during their lifecycle by: (1) Possession of a globally unique ID; (2) Linkage to information sources about the product
17
across organizational border; and (3) Communicating with information systems and users when needed. Similar to the classification of McFarlane et al. (2003), this classification is mainly focused on the use of RFID technology. Ventä (2007) provided a definition that focuses on decision-oriented products by extending point five of the first definition and point three of the second definition and is more focused on products with sufficient embedded computing power (Meyer et al., 2009).
Intelligent Products were first analyzed in an after-sales and service context. Later the idea of integrating intelligence and control into the product spread to manufacturing (McFarlane et al., 2003) and supply chain control (Kärkkäinen, 2003).
Internet of Things (IoT)
The IoT can be defined as “Things having identities and virtual personalities operating in smart spaces using intelligent interfaces to connect and communicate within social, environmental, and user contexts” (EpoSS, 2008). A fundamental enabler would be the identity knowledge, of the self and of the others. Enabling the object to know itself and its common properties, such as creation, recycling, transformation, ownership change, or use for different purposes will allow common objects to interact actively and decisively with the environment.
Based on the review of the literature related to IoT (e.g., Brock, 2001; Gershenfeld et al., 2004; Huvio et al., 2002) by Meyer et al. (2009), they concluded that in many contexts, such as the SCM, the IoT concept tends to focus on product identification technologies, information storage and information exchange rather than on the intelligence of the products.
18
2.2.4 RFID AND INTELLIGENT PRODUCTS
In manufacturing and supply chain application domains, Auto Identification (Auto-ID) technologies (such as RFID) provided the possibility of tracking and tracing of products throughout the entire supply chain. Meyer et al. (2009) suggested that we would enter the realm of Intelligent Products, in case any individual product in a logistic or production setting is given a traceable individuality, the associated content, and possibly the delegated decision power. They stated that information needs to be represented at the item level and communicated between different organizations for such tracking and tracing in the supply chain. Moreover, RFID has the potential to enable machines to identify objects, understand their status, and communicate and take action if necessary, to create real-time awareness (Welbourne et al., 2009; Yan et al., 2008; Khoo, 2010). The mobile devices have a huge penetration in the market covering the needs of both consumers and industry due to the processing power and communication facilities they provide (Tesoriero et al., 2010). In the field of microelectronics, it can be assumed that, according to Moore’s Law (Swanson, 1998), in the coming years, logic and memory elements will become smaller, more powerful and cheaper at the same time. New materials, such as semi-conducting polymers help to ensure that electronic systems will be embedded in almost all conceivable objects and require less energy to operate (Chalasani and Conrad, 2008; Alcañiz and Rey, 2005; Friedewald and Raabe, 2011). Open standards and interoperability are key enablers for the success of the RFID deployments in the near future and the viability of the IoT in the long term. Moreover, the integration of smart devices into packaging and products, and the support for different communication and security standards and protocols that operate at different frequencies
19
are enablers for the success of IoT (EpoSS, 2008; ITU, 2005). The barriers in implementing the idea of IoT, such as governing authority, acceptance by states, companies, trade organizations and the common people should be considered. Also the privacy and security has a major importance and the public acceptance for the IoT will happen only when strong security and privacy solutions are in place (EpoSS, 2008).
LOCALIZATION AND RTLS
2.3
2.3.1 IMPORTANCE OF LOCATION DATA
Location data are essential for many processes related to SCM, FM, and Product Lifecycle Management (PLM) as many applications need to know where objects are located (Khoury and Kamat, 2009a; Zhao et al., 2007). They are is central to personalized applications in different areas and they are the basis for the delivery of personalized and Location-Based Services (LBS) (Li and Becerik-Gerber, 2011). Moreover, the accurate location data of objects are used for several applications (Zhou and Shi, 2009), such as finding items in a warehouse (Hariharan, 2006), locating equipments in construction sites (Song, 2007), avoiding collision between vehicles (Tong, 2007), and rescuing victims in underground mines (Zhang, 2006). In the area of construction management, effective monitoring of personnel movements, material locations, and construction equipment helps successfully manage projects (Ko, 2010; Ibn-Homaid, 2002; Fan et al., 2008; Yagi et al., 2005; Grau et al., 2009).
Indoor location data provide the basis for context awareness within the building, which involves an automatic recognition of the user’s location and activity (Zhao et al., 2007; Papapostolou and Chaouchi, 2011; Aziz et al., 2005). Context-aware information can
20
automate the delivery of information to on-site mobile personnel allowing them to locate specific targets, such as building components, equipment, tools and themselves to access target-specific information.
Li and Becerik-Gerber (2011) stated that indoor location information is especially valuable as it has the potential to improve the utilization and maintenance of facilities by: (1) Helping unfamiliar users of a building by providing them with information to navigate around and find their destinations; (2) FM personnel can be provided with locations of building components or equipment they need to maintain or repair; (3) Locations of tools and on-site FM personnel and the length of time they spend at each location can be analyzed to monitor the work procedures and improve productivity; and (4) Changes in building occupancy can be detected in real-time through location sensing, and energy conservation measures, such as adjustment of lighting and air conditioning, can be automated.
Location tracking systems provide the potential for achieving savings depending on the selected technology (Kelepouris and McFarlane, 2010). RTLS technologies (e.g., Ultra Wide Band (UWB)) are capable of providing real-time location information of assets in facilities, such as production floors or commercial buildings (Daek et al., 2012). However, providing RTLS infrastructure inside the building is costly because of the need of fixed infrastructure, which imposes tremendous amount of hardware, technical design and implementation costs.
21
2.3.2 LOCALIZATION LEVELS
Papapostolou et al. (2011) defined the localization problem as the process of determining the current position of a user or an object within a specific region, indoor or outdoor. However, a position can be expressed in several ways (e.g., coordinate, region, cell, hierarchical) depending on the application requirements or the positioning system specifications.
Razavi and Haas (2011) identified two approaches to localization: fine-grained
localization using detailed information and coarse-grained localization using minimal information. Minimal techniques are easier to implement and more likely to involve fewer resources and lower equipment costs, but they provide a lower degree of accuracy than detailed localization techniques. However, fine-grained localization uses measurement techniques (Razavi and Haas, 2011). Coarse-grained node localization uses range-free or connectivity-based localization algorithms that do not use any measurement. In this category, some sensors, have a priori information about their own location. The locations of other sensors are estimated based on connectivity information, such as which sensor is within the communication range of which other sensors (Bulusu et al., 2000; Simic et al., 2002; Song et al., 2006). The presence of an object within a specific range is usually determined by monitoring physical phenomena that have limited range, e.g., physical contact with a magnetic scanner, or communication connectivity to access points in a wireless cellular network (Razavi and Haas, 2011). Our proposed method for localizing movable assets (Explained in Chapter 4) follows fine-grained approach for localization as it uses measurement techniques to calculate the exact location of RFID tags.
22
2.3.3 CONTEXT-AWARE INFORMATION DELIVERY
Location-aware computing has significant potential to improve manual processes and supporting important decision making tasks in the field (Khoury and Kamat, 2009a). The context-aware information delivery (Aziz et al., 2005) has the potential to create a user-centered mobile dynamic indoor and outdoor work environment, which has the ability to deliver relevant information to on-site mobile users in order to help them take more informed decisions (Schilit and Want, 1994). Providing this wide range of information that forms the basis of context awareness in construction and FM, leads to improvement in project safety, schedule, cost (Caldas et al., 2006) and decision-making (Li and Becerik-Gerber, 2011).
For example, instead of browsing through detailed drawings and other paper based media, contextual project information can be automatically retrieved and visualized by continuously and accurately tracking mobile users’ three-dimensional spatial context (i.e. position and orientation) (Khoury and Kamat, 2009b). Navigation information, as demonstrated in Rueppel and Stuebbe (2008), is an example of information that can be delivered to mobile users (Li and Becerik-Gerber, 2011).
Li and Becerik-Gerber (2011) listed the areas for future research on applying information delivery mechanism to multiple areas including: (1) Execution and management of construction activities, e.g., assembly instructions are delivered to the workers; (2) Safety and security, e.g., locations of workers are monitored in real-time to avoid collisions, or alerts are sent when assets are removed without authorization; (3) Supporting FM personnel, e.g., a worker is located and his/her context analyzed, so that information,
23
such as maintenance history, work orders, or inspection records is delivered to him/her; and (4) Smergency response, e.g., rescuers are guided inside a building.
2.3.4 INDOOR LOCALIZATION
The GPS technology provides solutions for outdoor localization. However, so far no single indoor localization solution has been universally adopted (Li and Becerik-Gerber, 2011). Li and Becerik-Gerber (2011) listed technologies that have been proposed and tested for indoor localization as follows:
Indoor GPS: GPS-based solutions have been introduced to extend the use of GPS to indoor environments, such as high-sensitivity GPS that uses highly signal-sensitive receivers developed for weak-signal conditions (Schon et al., 2008), and Assisted GPS (A-GPS) (Diggelen, 2002).
Inertial Navigation Systems (INS) using sensors, such as accelerometers and gyros (Mezentsev et al., 2005).
Infrared-based solutions, such as Active Badge (Want et al., 1992), use portable infrared beacons and fixed infrared sensors to provide zone-level localization.
Ultrasound, such as the Cricket Location Support System (Priyantha et al., 2000) and Active Bat location system (Harter et al., 1999). They compare the time of arrival of ultrasonic signals with that of Radio Frequency (RF) signals to determine the distance between the signal transmitter and the receiver.
UWB-based solutions use very short pulses for communication between tags and receivers, and provide a high accuracy localization using fixed infrastructure (Becker, 2008; Cho et al., 2010).
24
Wireless Local Area Network (WLAN)-based solutions, such as the RADAR system (Bahl et al., 2000), can be easily set up and require few base stations.
Bluetooth and Zigbee-based solutions (Cruz et al., 2011; Huang and Chan, 2011; Shen et al., 2008).
RFID-based solutions: is further discussed in detail in Subsection 2.3.5.
Li and Becerik-Gerber (2011) provided a comparison chart that compares indoor localization solutions that is presented in Table 2-1.
Indoor Localization Challenges
The indoor radio propagation is site and environment specific. The changes of signal in indoor environments are difficult to predict because of dense environment and radio propagation effects, such as reflection, diffraction and scattering (Bekkali et al., 2007). Moreover, indoor environments exhibit severe multi-path effects and low probability of line-of-sight (LoS) signal propagation between the transmitter and the receiver (Pahlavan and Levesque, 2005) and makes accurate indoor positioning very challenging (Papapostolou and Chaouchi, 2011).
Table 2-1 Comparison of indoor localization techniques (Li and Becerik-Gerber, 2011)
Te ch no lo gy Accuracy (m) af fo rd ab ili ty ($ /m 2) No line of sight required Wireless Communication Context Independent On-board data storage Built-in power supply Wide application in building industry GPS 0.01-0.02 380 X X X √ √ √ INS 1.10-4.15 20 √ X √ √ √ X Infrared 0.30-0.50 17 X √ X X X X UWB 0.06-0.50 140 √ √ X X X X WLAN 4.53-6.89 3 √ √ X X X √ RFID 1.55-3.11 25 √ √ X √ X √
25
2.3.5 RFID-BASED INDOOR LOCALIZATION
RFID technology has been employed for localization in indoor environments in various research projects. However, the main shortcoming of RFID is the interference among its components, and the interference among RFID components and some materials (Papapostolou and Chaouchi, 2011). The proximity of liquids and metals significantly affects the readability range and data transfer rate of the RFID system.
2.3.5.1 RFID Localization Methods
Several researchers categorized RF-based localization methods and provided surveys and comparisons among various projects for RFID tag and reader localization (e.g, Fuchs et al., 2011; Liu et al., 2007; Li and Becerik-Gerber, 2011; Papapostolou and Chaouchi, 2011; and Zhou and Shi, 2009). The RF localization methods can be categorized in five major groups: (1) Trilateration: it uses the distances of the target to at least three points with known positions. The distance is estimated based on RF properties using the following techniques: Time of Arrival (ToA), Time Difference of Arrival (TDoA), Phase of Arrival (PoA), signal attenuation (Received Signal Strength (RSS)-based), Reverse Time of Flight (RToF), and hop-based; (2) Angulation: it determines the location of an object from the measured angles to at least two fixed points with known locations (e.g., Angel of Arrival (AoA)); (3) Proximity: it uses the approximate communication area to detect whether the target node is in a region or not (Zhou and Shi, 2009). It relies upon a dense grid of antennas, each having a known position. When a mobile target is detected by an antenna, it is considered to be collocated with it (Liu et al., 2007); (4)
Fingerprinting (scene analysis): it requires an offline phase for learning the radio signal behavior within a specific area under study to build a radio map database. It estimates the
26
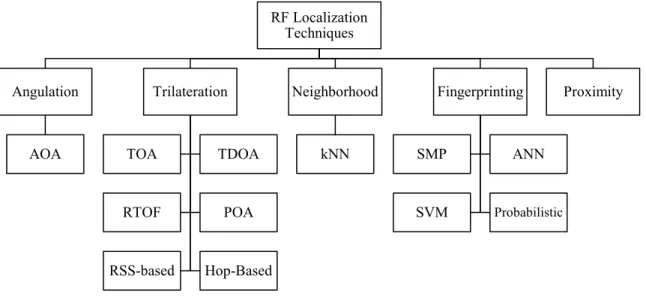
location of a receiver based on the similarity of its current signal strength measurements with the closest a priori location fingerprints in the radio map using the following techniques: Support Vector Machine (SVM), Artificial Neural Network (ANN), Smallest M-vertex Polygon (SMP), and probabilistic methods; and (5) neighbourhood: it uses RF properties to measure nearness to a known set of points. In this method, an RFID tag or a reader is attached to a target and communicates with the readers or tags with known locations deployed in the environment through radio waves. The observed signal strength or time of arrival are used to measure the nearness of reference positions. The measured nearness, along with the corresponding known locations, are used to estimate the location of a target. Figure 2-2 shows various methods used for RF localization based on the abovementioned categorization. The RFID tag localization method introduced in this research (explained in Subsection 4.6), utilizes the LANDMARC method, which is a specific neighborhood method, for the localization of mobile RFID tags. The LANDMARC method is briefly explained in the Subsection 2.3.5.3.
Figure 2-2 RF localization hierarchy (Motamedi et al., 2013)
RF Localization Techniques Angulation AOA Trilateration TOA TDOA RTOF POA RSS-based Hop-Based Neighborhood kNN Fingerprinting SMP ANN SVM Probabilistic Proximity
27
2.3.5.2 RFID Localization Targets
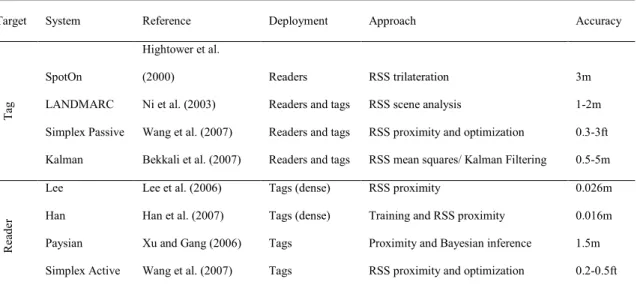
In RFID-based localization systems, tags or readers can be the targets for localization (Sanpechuda and Kovavisaruch, 2008). In tag localization, the RFID tag is attached to the target component for localization (e.g., Hightower et al., 2000; Ni et al., 2003; and Bekkali et al., 2007). In most of the settings, in order to track the target tag, readers or reference tags are deployed as reference points and a positioning technique is applied for estimating the location of a tag. In reader localization, usually reference tags are deployed as reference points for localization of the reader (e.g., Lee and Lee, 2006, Yamano et al., 2004, and Wang et al., 2007). Papapostolou and Chaouchi, (2011) listed some of tag and reader positioning systems that are summarized in Table 2-2.
Table 2-2 Tag and reader localization (adopted from Papapostolou and Chaouchi, 2011)
Target System Reference Deployment Approach Accuracy
Ta
g
SpotOn
Hightower et al.
(2000) Readers RSS trilateration 3m LANDMARC Ni et al. (2003) Readers and tags RSS scene analysis 1-2m Simplex Passive Wang et al. (2007) Readers and tags RSS proximity and optimization 0.3-3ft Kalman Bekkali et al. (2007) Readers and tags RSS mean squares/ Kalman Filtering 0.5-5m
R
ea
de
r
Lee Lee et al. (2006) Tags (dense) RSS proximity 0.026m Han Han et al. (2007) Tags (dense) Training and RSS proximity 0.016m Paysian Xu and Gang (2006) Tags Proximity and Bayesian inference 1.5m Simplex Active Wang et al. (2007) Tags RSS proximity and optimization 0.2-0.5ft
2.3.5.3 LANDMARC Method for RFID Tag Localization
LANDMARC (Ni et al., 2003), has been a foundation for many RFID tag localization solutions. LANDMARC-based methods have advantage over trilateration methods in adapting to complex and dynamic environments (Li and Becerik-Gerber, 2011).
28
LANDMARC uses active tags that are attached to the target assets (target tags). In this method, a grid of fixed reference tags with known locations is placed in the sensing area in order to provide reference locations. The Received Signal Strength Indicator (RSSI) values received from all RFID tags are recorded by fixed readers. The system measures the nearness of the reference tag to the target and identifies the nearest reference tags to the target. It uses weighted averaging in order to locate the target tag using an empirical formula. Equation 2-1 shows the weighted averaging method where x and y are the coordinates of the target tag and xi and yi are the coordinates of the k-nearest neighbors
(kNN) reference tags. The weights are calculated using Equation 2-2 where Ei is the
Euclidean distance in signal strengths (Ni et al., 2003).
( ) = ∑ ( ) Equation 2-1
= ( ⁄ ) (∑⁄ ( ⁄ )) Equation 2-2
Ni et al. (2003) performed field tests in an area of 5 m × 10 m with a grid of 16 reference tags and four fixed readers. Results showed the accuracy of within 1 m with 50% probability and within 2 m with 90% probability. Their research adopted the use of four nearest reference tags for optimal positioning (Ni et al., 2003). It is also noted that increasing the number of reference tags and readers improves the accuracy of the results. Technological constraints for available RFID systems at the time, such as inability to provide direct signal strength by readers, long time intervals of emitting signals from tags, and variations in the behaviour of tags are introduced as limitations.
29
BUILDING INFORMATION MODELING (BIM)
2.4
BIM is emerging as a method of creating, sharing, exchanging and managing the information throughout the lifecycle between all the building stakeholders. It has been developed in order to tackle the problems related to interoperability and information integration by providing effective management, sharing and exchanging of a building information through its entire lifecycle (Isikdag et al., 2008). The BIM database will contain data related to all aspects of the facility (e.g., geometry, mechanical systems, construction scheduling) that are accumulated throughout the lifecycle. Currently, BIM standards are evolving and various BIM-compatible applications are introduced in the market. Consequently, various types of data that are useful for stakeholders are required to be defined and added to available standards.
2.4.1 DEFINITION AND SCOPE OF BIM
According to Associated General Contractors Guide (AGC, 2005), BIM is a data-rich, object-oriented, intelligent and parametric digital representation of facilities. Views and data appropriate to various users’ needs can be extracted and analyzed to generate information that can be used to make decisions and improve the process of delivering a facility.
NBIMS (2007) described the scope of BIM within the following relationships: (1) BIM as a product or intelligent digital representation of data about a capital facility; (2) BIM as a collaborative process which covers business drivers, automated process capabilities, and open information standards use for information sustainability and fidelity; and (3) BIM as a facility lifecycle management tool of well understood information exchanges,