1
Indirect Test of M-S Circuits Using
Multiple Specification Band Guarding
´
Alvaro G´omez-Pau,
Student Member, IEEE
, Luz Balado, Joan Figueras,
Life Member, IEEE
Abstract—Testing analog and mixed-signal circuits is a costly task due to the required test time targets and high end technical resources. Indirect testing methods partially address these issues providing an efficient solution using easy to measure CUT infor-mation that correlates with circuit performances. In this work, a multiple specification band guarding technique is proposed as a method to achieve a test target of misclassified circuits. The acceptance/rejection test regions are encoded using octrees in the measurement space, where the band guarding factors precisely tune the test decision boundary according to the required test yield targets. The generated octree data structure serves to cluster the forthcoming circuits in the production testing phase by solely relying on indirect measurements. The combined use of octree based encoding and multiple specification band guarding makes the testing procedure fast, efficient and highly tunable. The proposed band guarding methodology has been applied to test a band-pass Butterworth filter under parametric variations. Promising simulation results are reported showing remarkable improvements when the multiple specification band guarding criterion is used.
Index Terms—Band Guarding, Multiple Specification, Mixed-Signal Testing, Alternate Test, Indirect Measurements, Indirect Measurements Selection, Test Escapes, Test Yield Loss, Octrees, Quadtrees, Classifiers, Butterworth Filter.
I. INTRODUCTION
T
ESTING analog and mixed-signal circuits is a challeng-ing task due to the limitations of current analog automatic test equipment and the partial availability of systematic proce-dures for mixed-signal testing [1]. This fact causes a significant increase of the incurred costs in the final product. Built-in techniques are considered a promising solution to cope with the ever increasing analog ATE costs and the drawback of externalizing internal analog nets. Area overhead and impact on CUT signals are, in some applications, justifiable and cost effective. Indirect testing methodologies are widely used in contrast to the classic specification based testing and have been presented as a suitable solution [2]–[6]. Alternate testing techniques require a mapping between the specification space and the measurement space in order to allow the test decision to be performed. Machine learning techniques [7], [8] and regression techniques [3], [9] have been used with successful results to this purpose, as well as using octrees to represent The authors are with the Department of Electronics Engineering at Universitat Polit`ecnica de Catalunya (UPC-BarcelonaTech). Av. Diagonal, 647, 9th floor, 08028, Barcelona, Spain. Emails: [email protected], [email protected], [email protected].This work has been partially supported by the Spanish Ministry of Economics and Competitiveness, project references TEC2010-18384 and TEC2013-41209-P and European Union FEDER funds.
the pass/fail regions [10], [11]. Test costs are heavily raised up due to the existence of decision errors, i.e. test escapes and test yield loss, so lowering these analog metrics usually becomes the goal of any testing strategy [1], [7].
Indirect testing strategies require the selection of a set of easy to measure parameters to be used as indirect measures. To that purpose, many options exist, some of them entirely relying on designer’s expertise and experience. Some authors have proposed the use of the sensitivity matrix between circuit’s functional specifications and indirect measurements with the goal of maximizing its rank [12]. This allows the avoidance of redundant information. Statistical methods have been also proposed, most of them relying on correlations and regressions techniques between the set of functional specifications and the set of indirect measurements [13]. For instance, in [6], [14], the authors use theBrownian distance correlationtogether with a greedy algorithm in order to select a meaningful subset of measures adequate for analog/RF circuits testing.
This paper is an extension of the work presented at the SMACD conference in 2015 [15]. Here, the work has been extended to consider multiple specification band guarding factors while keeping the goal of optimizing and/or reaching certain analog test metrics targets. The use of multiple band guarding factors over multiple circuit specifications is the major improvement with respect to the conference paper but other enhancements have been included such as the assessment of the criterion used to select the indirect measurements as well the evaluation of the required computation times. The proposed indirect test method comprises two phases, namely, the training phase and the testing phase [10], [15]. In the training phase, a representative amount of circuit samples is generated and the acceptance/rejection regions are encoded using octrees in the indirect measurement space. In the former phase, the proposed multiple specification band guarding strategy is applied by adequately tuning a set of factors which modify the test specifications and therefore the number of misclassified circuits. The latter phase corresponds to the actual production testing of the incoming ICs using the previously generated octree data structure. Octree encoded pass/fail regions facilitate an efficient and fast circuit clustering due to the inherent sparsity of such data structures.
The rest of the paper is organized as follows. Section II focuses on the details of testing analog and mixed-signal circuits using octree tessellation in the indirect measurement space. The training and testing phases are described as well as a short introduction to octree encoding is given. Section III
presents the proposed multiple specification band guarding methodology and how it can be used to achieve certain test targets. Section IV presents a band-pass Butterworth filter which serves as the test vehicle to evaluate the proposed multiple specification band guarding methodology. Section V reports the simulation results resulting from the application of the proposed band guarding methodology. The efficiency of the testing procedure in terms of test escapes and test yield loss metrics is studied as well as in terms of computation time. Also, the noise impact in the indirect measurements is also explored. Finally, Section VI summarizes the work and concludes the paper.
II. TEST OFMIXED-SIGNALCIRCUITS
IN THEINDIRECTMEASUREMENTSPACE
The procedure of testing analog and mixed-signal circuits can be formalized as the classification of a candidate circuit into pass/fail clusters. Such classification is usually performed in the specifications space or performance space in which circuit specifications/performances are directly measured. This procedure is referred as the well known specification based test as opposed to the indirect test or alternate test. Indirect testing aims to battle against the drawbacks of specification based test such as the need for high end technical resources or the difficulties in validating every single test specification. The indirect test procedure used in this work is formed by two phases, namely, the training phase and the testing phase. The former phase is in charge of generating the circuit data and encode them using an octree data structure which will be used in the latter phase to test the freshly fabricated ICs.
A. Training Phase
In order to perform the encoding of the acceptance/rejection regions in the measurement space, a certain amount of repre-sentative circuit data need to be generated [10]. This can be achieved by circuit simulation, model/macromodel evaluation or simply by using available data on the production run from already tested ICs. Of course, accelerating techniques to obtain representative border circuits can also be used, such as stratified sampling or statistical blockade [16], [17]. Then, when the circuit data are generated, they are digitally encoded by means of a classifier. This is, in general, considerably challenging since highly nonlinear boundaries are difficult to be represented by means of state of the art classifiers (neural networks, SVMs,. . . ) or regression models (linear, MARS,. . . ) [9], [18].
On the contrary, octree data structures present the advantage of being able to represent arbitraryn-dimensional regions as long as the training algorithm encounters circuit data points to generate the octree. Also, it has the capability of controlling the resolution by simply limiting the maximum depth level. Such structures can be represented digitally and are easy to evaluate since only a few comparisons are required to traverse the tree. Next subsection focuses on how to use an octree
1 2 2 3 3 6 6 9 3 4 9 1 0 2 4 2 9 3 0 3 1 3 7 3 8 5 9 6 4 7 0 8 3 8 4 8 5 5 6 7 8 1 1 2 0 2 1 2 2 1 2 1 7 1 8 1 9 1 3 1 4 1 5 1 6 2 5 2 6 2 7 2 8 3 2 3 3 3 4 3 5 3 9 4 4 4 5 5 8 6 0 6 1 6 2 6 3 6 5 6 6 6 7 6 8 4 0 4 1 4 2 4 3 4 6 5 5 5 6 5 7 4 7 5 2 5 3 5 4 4 8 4 9 5 0 5 1 7 1 7 6 8 1 8 2 7 2 7 3 7 4 7 5 7 7 7 8 7 9 8 0
Fig. 1. Graph representing the quadtree depicted in Fig. 2. The obtained quadtree is 6 levels deep and has 85 nodes. Green/red leaf nodes correspond to pass/fail circuits.
data structure to encode the pass/fail regions in the indirect measurement space.
B. Octree Encoding
An octree data structure of dimension nis a tree in which each node has exactly 2n children or none [19]. Octrees
usually represent a geometric partition of an n-dimensional space. One of their main applications is in the field of 3D computer graphics, so every node has 23 = 8 children, what gives its name (8-tree). For the case of two dimensional applications, they also receive the name of quadtrees (4-tree). The concept can be easily generalized ton-dimensional spaces where sometimes are referred as 2n-trees or simplyn
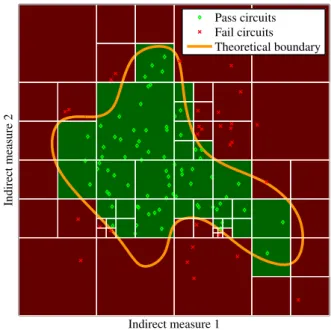
-dimensional octrees. Fig. 1 shows an example quadtree data structure encoding the plane tessellation depicted in Fig. 2. The graph has 85 nodes and is 6 levels deep, what implies the length of the side of the smallest octree cell is 1/64th of the the initial cell at level zero.
In order to illustrate the process of encoding the accep-tance/rejection regions in the measurements space, consider the set of data points shown in Fig. 2. The data shown represent circuits passing the test in green and circuits failing the test in red. Initially, the theoretical boundary separating them is unknown, so the octree encoding algorithm is solely based on the green/red data points. The first step is to consider an initial cell containing all the circuits and tessellate it into 4 equal regions by halving each dimension. Then, the following algorithm is applied to each of the resulting children. If it does exclusively contain single cluster data points, the square is tagged accordingly to that class and no further partitioning is performed. Otherwise, the square is marked as decision pending (white parent nodes in Fig. 1) and the procedure continues until all the generated squares only contain equal class data. After a tessellation, it may happen that some of the generated cells do not contain any data point. These cells are left untagged until the algorithm finishes and then treated separately. The way to proceed is to mark them accordingly to the majority of the clusters assigned to their neighboring octree cells [11].
C. Testing Phase
Trees, and in particulark-ary trees, are popular data struc-tures in computer science for which efficient algorithms have been developed such as tree traversal, tree insertion and tree
Indirect measure 1
Indirect measure 2
Pass circuits Fail circuits Theoretical boundary
Fig. 2. Example of a 2-dimensional space encoded using quadtrees. The octree encoding algorithm solely relies on the green/red data points to approximate the acceptance/rejection test regions.
pruning. Ak-ary tree can be stored as an array of pointers to memory locations what greatly facilitates its traversal from the root node to the leafs. The most common way of implementing ak-ary tree is by defining a node structure data type. The node structure haskmembers declared as pointers to a type of itself, what creates a recursive and efficient implementation of the tree which allows a fast traversal procedure in a similar way CPU indirect addressing works.
The testing phase corresponds to the actual classification of the freshly fabricated circuits into pass/fail clusters using the former octree data structure. Consider the octree depicted in Fig. 2 whose graph representation is the one shown in Fig. 1. Let(M1, M2)be a pair of circuit indirect measurements which
are assumed to be within the initial square. The first step is to check to which quadrant they belong to (SW, NW, SE or NE) by performing one comparison per coordinate. This decision brings the candidate circuit to a new bound since a deeper octree level is achieved. If the current node is a tagged leaf, the point is mapped to that cluster and the evaluation terminates. If not, the evaluation algorithm repeats the decision operation through out the graph until a tagged leaf node is found and the circuit is clustered as pass or fail [11], [20]. The algorithm listed in Fig. 3 implements the octree evaluation procedure in pseudocode.
III. MULTIPLESPECIFICATIONBANDGUARDING
IN THEINDIRECTMEASUREMENTSPACE
Test specification band guarding can be used to improve test outcomes depending on the established test escapes and test yield loss trade offs or targets. The underlying idea is to create a series of band guards along the test decision boundaries. The actual purpose of these guards is to displace the test limits with
1: function EVALMEASUREMENTS(N, M) 2: Precond: N is an octree node data structure 3: Precond: M is a vector of indirect measurements 4: if N.label6=NULLthen
5: returnN.label
6: else
7: idchild←compare(M, N.center) 8: N←N.child[idchild]
9: returnEVALMEASUREMENTS(N, M)
10: end if 11: end function
Fig. 3. Recursive implementation of the testing procedure using octrees in the indirect measurement space. Octree evaluation is efficient since only one comparison per coordinate and level is required.
Spec2
Spec1 M1
M2
Modified specs cube by band
2 1
guarding factors r and r Nominal specs cube
Fig. 4. Example of multiple specification band guarding in the specifications space and the resulting non linear mapping in the indirect measurement space. The applied shrink helps to reduce test escapes metric.
the objective of bypassing the mispredictions or uncertainties carried out by the actual test procedure, therefore achieving less misclassified circuits [15].
In this work, the proposed band guarding procedure is performed in the indirect measurement space using a set of factors r1, r2, . . . , rp, which are in charge of shrinking or
enlarging the test specification cube and so the test decision boundary in the indirect measurement space. From now on, these factors will be referred as band guarding factors. Each of the factors is responsible of modifying one or more test specifications as sketched in Fig. 4. The use of multiple band guarding factors is the major novelty of this work with respect to the work presented in [15].
If all the band guarding factors are less than 1, it is clear that the acceptance region will be shrunk, what immediately translates into tighter test specifications. This implies that the probability of classifying an actual fail circuit into the pass cluster will be reduced, i.e. the test escape metric will be reduced. On the contrary, if all the band guarding factors are greater than 1, the acceptance region will be enlarged, what implies the relaxation of tests specifications and therefore the probability of classifying an actual pass circuit into the fail cluster gets reduced, i.e. the test yield loss metric will be reduced. Of course, according to the desired trade off between the test efficiency metrics or the needs for tightening or relaxing any of the circuit performances, a whole space of possibilities is available for the test engineer. It is worth to
TABLE I
BAND-PASSBUTTERWORTHFILTERDESIGNSPECIFICATIONS
Specification Symbol Value Units
Center frequency f0 1.0 MHz Bandwidth (−3dB) BW 1.0 MHz
Quality factor Q 1.0
Pass-band gain GBP 0.0 dB
note that the case r1 =r2 =· · · =rp = 1 results in a test
scenario with no band guarding at all.
As a proof of concept, this work deals with two band guard-ing factors which are in charge of tunguard-ing the test specifications of a continuous time filter. The following section describes the case study and explains in which manner the test specifications are varied according to each of the factors.
IV. CASESTUDY:
BAND-PASSBUTTERWORTHFILTER
A. Filter Design and Test Specifications
In order to demonstrate the viability of the proposed multiple specification band guarding technique, it has been applied to test a 6th order band-pass Butterworth filter in the indirect measurement space [21]. The schematic of the CUT is shown in Fig. 6. Filter’s topology corresponds to an active implementation of a ladder filter in which inductors have been substituted by their active gyrator counterparts using operational transconductance amplifiers (OTA) and capacitors have been implemented taking advantage of technology’s MiM capacitor capabilities. The OTA circuit is a current mirror op-erational transconductance amplifier designed using simulated annealing optimization. The Butterworth filter has been de-signed in an industrial 65 nm N-well bulk CMOS technology from ST-Microelectronics [22]. Filter design components are listed in Table III.
Filter design specifications are listed in Table I. As can be appreciated, the Butterworth band-pass filter has been designed with a center frequency of 1 MHz and a bandwidth of 1 MHz. The Q-factor resulting for such combination is Q= 1, what ensures a wide flat band in the pass-band. A series of test specifications have been imposed over the filter as listed in Table II. The test limits have been defined using boxes in the magnitude Bode plot as Fig. 5 depicts in blue dashed lines. As can be observed, test specifications regard to both bandwidth and gain, what makes the testing of the filter a non trivial task. The filter has been simulated using HSPICE and the 65 nm technology models from ST-Microelectronics (statcrolles corner). Monte Carlo simulations based on the aforementioned statistical corner have been used to charac-terize the transconductance parameters of the OTA, namely, the transconductance gain gm and the output resistance ro, therefore facilitating the generation of the 104 circuits to be used in the training phase. Fig. 5 shows some Monte Carlo simulations when the statistical corner of the process design kit is used.
TABLE II
BUTTERWORTHFILTERTESTLIMITS
Specification Test Spec Units
Minimum pass-band bandwidth 745.6 kHz Maximum stop-band bandwidth 11.0 MHz Maximum pass-band gain 1.2 dB Minimum pass-band gain −3.0 dB Minimum stop-band attenuation −59.0 dB
105 106 107 −80 −70 −60 −50 −40 −30 −20 −10 0 10 Frequency (Hz) Magnitude (dB) Nominal circuit Fail circuits Pass circuits Test specification
Fig. 5. Magnitude Bode diagrams obtained by Monte Carlo simulations using technology statistical corner (statcrolles). The test limits listed in Table II are also drawn in blue dashed line.
The band guarding factors used in this work are referred to r1 andr2. The way the band guarding factors control the
test limits is as follows. Factorr1contributes to the maximum
and minimum allowable gains in the pass-band of the filter. If
r1>1 means that the two upper gain lines move away from
the 0 dB line. On the contrary, factor r2 contributes to the
bandwidth of the filter. Ifr2>1, the test specification related
to filter’s bandwidth is relaxed, what implies the band-pass corner frequencies get closer tof0.
B. Indirect Measurements Selection
The presented 6th order band-pass Butterworth filter has been excited with a multitone stimulus. The input signal is composed of 3 in-phase tones corresponding to filter’s center frequency (1 MHz), an octave higher (2 MHz) and an octave lower (500 kHz), what yields to a periodic signal of period 2µs. Such stimulus has been proven to be effective for analog and mixed-signal testing purposes since it concentrates in a single stimulus the excitation of three single tones, making the
TABLE III
BUTTERWORTHFILTERCOMPONENTSVALUES
Comp Value Units Comp Value Units
C1 2.12 pF CL1 74.94 pF
C2 4.24 pF CL2 37.47 pF
C3 6.37 pF CL3 24.98 pF
CL2 Vin CL1 C1 C2 CL3 C3 Vout RL gm gm gm gm gm gm gm gm
Fig. 6. Schematic of the 6th order band-pass Butterworth filter used as a case study. The filter has been designed and simulated using an industrial 65 nm technology from ST-Microelectronics. Filter topology corresponds to a ladder filter implemented with operational transconductance amplifiers (OTA).
6 6.2 6.4 6.6 6.8 7 7.2 7.4 7.6 7.8 8 −0.5 −0.4 −0.3 −0.2 −0.1 0 0.1 0.2 0.3 0.4 0.5 Time (µs) Voltage (V) 1 2 3 4 5 6 7 8 9 10 Input multitone Nominal output Pass circuits output Fail circuits output Candidate IM instants
Fig. 7. Response of the Butterworth filter when it is excited with a multitone signal. The candidate indirect measurements correspond to equally spaced samples of filter’s output.
whole process faster [11], [23]–[25]. Fig. 7 shows the applied multitone input signal and the corresponding output responses for a few Monte Carlo samples once the sinusoidal steady state has been reached. Green traces correspond to circuits fulfilling the test specifications listed in Table II while red traces correspond to circuits violating, at least, one of the test specifications.
In this work, the candidate set of indirect measurements are formed by several samples of filter’s response to the aforementioned multitone input signal. The candidate set of samples are taken at evenly spaced time intervals as indicated with the dashed vertical lines in Fig. 7. Note that, since the sampling signal is periodic, a stroboscopic or sequential equivalent-time sampling technique may be carried out over more than one period in order to reduce the effective sampling rate. Such procedure yields to a set of 10 candidate indirect measurements from which a final subset needs to be selected. As intuition suggests, a good subset of indirect measurements has to satisfy two requirements. The measurements need to reflect circuit’s performance variability and should not be redundant to avoid incurring in extra test costs.
Having a look at the Bode diagrams shown in Fig. 5 and the steady state transient responses depicted in Fig. 7, it is clear that the candidate measurements are correlated with circuit performances. Regarding the second condition, Kendall’s Tau
TABLE IV
KENDALL’STAURANKCORRELATIONCOEFFICIENTBETWEEN CANDIDATEINDIRECTMEASUREMENTPAIRS
1 2 3 4 5 6 7 8 9 10 1 1.000 2 0.688 1.000 3 0.910 0.620 1.000 4 0.835 0.576 0.830 1.000 5 0.658 0.626 0.645 0.501 1.000 6 0.766 0.712 0.755 0.633 0.812 1.000 7 0.331 0.272 0.313 0.171 0.587 0.425 1.000 8 0.705 0.706 0.689 0.550 0.916 0.865 0.520 1.000 9 0.240 0.033 0.256 0.308 0.053 0.015 0.130 0.046 1.000 10 0.981 0.689 0.912 0.835 0.658 0.768 0.331 0.706 0.240 1.000
rank correlation coefficient is used to quantify the correlation level among the final subset of indirect measurements [26]. Since the aim is to reduce redundant information, the pair presenting the lowest Kendall’s Tau correlation is included in the target subset.
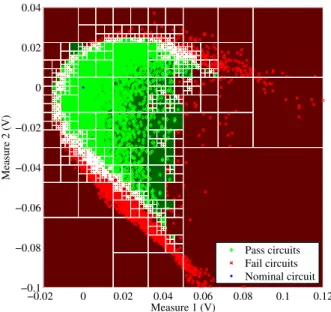
Table IV shows the absolute values of Kendall’s Tau rank correlation coefficient among the 10 candidate indirect mea-surements under consideration. The pair of meamea-surements presenting the lowest correlation is the one formed by mea-surements 9 and 6 with a correlation value of 0.015. Here forth, these measurements will define the indirect measurement space for the presented Butterworth filter and are the only measurements that need to be performed in the test application phase. Fig. 9 shows the indirect test space formed by these measurements.
It is worth to note that for the present case study two indirect measurements are enough to define the test decision boundary. If two measurements were not enough, Kendall’s Tau rank correlation coefficient is also useful for such scenario [11]. The underlying idea is to add indirect measurements to the final subset while keeping the sum of all their Kendall’s Tau the smallest possible. This is a general procedure based on a similar concept in order to make an appropriate selection when more than two measurements are needed.
C. Kendall’s Tau Criterion Assessment
In order to verify that the criterion used to select a subset of indirect measurements yields to reasonable results, all the possible pairs (45) have been used for the training/testing phases withr1=r2= 1. The training set size is composed of 104 pairs of indirect measurements while the testing set size
Test escapes Yield loss Total misclassifications 2 4 6 8 10 12
Misclassification (%) Pair (6,9) Pair (6,9)
Pair (6,9) Pair (6,9) suggested
by Kendall’s Tau criterion
Fig. 8. Box plots showing the distribution of misclassified circuits for all the possible pairs of indirect measurements. The pair suggested by the Kendall’s Tau criterion is within the first quartile of misclassifications.
is formed of 105 pairs. The results of this bruteforce study, are shown in Fig. 8 where the box plot of the distribution of the number of misclassified circuits are shown. As usual, box height represents the 25%-75% quartile spread while whisker’s lengths relate to the interquartile range and/or extreme values within the distribution. As can be appreciated, the pair sug-gested using Kendall’s Tau criterion reports misclassification levels which are within the first quartile of the population. More over, if the whole spread of total misclassification is taken as reference, the total misclassification level of the pair selected using Kendall’s Tau criterion is among the 4.4% best values, fact that confirms Kendall’s Tau rank correlation coef-ficient as a suitable indicator to select indirect measurements.
D. Training Phase
Taking into account the previously selected subset of in-direct measurements, 104 Monte Carlo samples of the But-terworth filter have been simulated resulting in the samples shown in Fig. 9. The application of the octree encoding algorithm detailed in Section II results in the octree depicted in Fig. 10. As can observed the octree gets finer exactly where it is needed, i.e. in the surroundings of the test decision boundary. The resulting octree is 12 levels deep.
In order to better understand the benefits of octrees as classifiers, it is worth to take a look at the levels distribution of the octree cells forming the octree data structure. Fig. 11 shows such distribution for the octree depicted in Fig. 10. As can be stated, the vast majority of octree cells concentrate at levels 7, 8, and 9 despite the maximum level is 12. This fact implies a considerable advantage in terms of test application time since most of the circuits will be resolved without the need of traversing the tree down to its maximum level as will be shown in Section V where the simulation results are presented. −0.02 0 0.02 0.04 0.06 0.08 0.1 0.12 −0.1 −0.08 −0.06 −0.04 −0.02 0 0.02 0.04 Measure 1 (V) Measure 2 (V) Pass circuits Fail circuits Nominal circuit
Fig. 9. Monte Carlo samples of a 6th order Butterworth band-pass filter in the indirect measurement space. Green/red circuits correspond to circuits fulfilling or not the test specifications detailed in Table II.
−0.02 0 0.02 0.04 0.06 0.08 0.1 0.12 −0.1 −0.08 −0.06 −0.04 −0.02 0 0.02 0.04 Measure 1 (V) Measure 2 (V) Pass circuits Fail circuits Nominal circuit
Fig. 10. Resulting octree after the application of the training phase to the set of104 Butterworth circuit samples shown in Fig. 9. As can be observed, high octree levels concentrate in the test decision boundary.
V. SIMULATIONRESULTS
A. Analog Test Metrics Evaluation
In order to evaluate the proposed testing procedure using octrees, a set of 105 Butterworth filters have been generated
using Monte Carlo simulations and evaluated using the octrees generated in the training phase. For the caser1=r2= 1, the
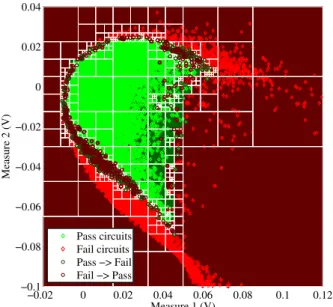
results of the evaluation can be observed in Fig. 12. Correctly classified circuits are drawn using green and red colors, which respectively correspond to pass and fail circuits. Circuits that have not been correctly clustered are circled using dark green for pass circuits classified as fail and dark red for fail circuits
0 1 2 3 4 5 6 7 8 9 10 11 12 0 100 200 300 400 500 600 700 800
Octree cell level
Occurrencies
Fig. 11. Levels distribution for the octree shown in Fig. 10. Despite the maximum level is 12, the vast majority of octree cells correspond to levels 7, 8 and 9, what greatly facilitates its evaluation in the forthcoming testing phase. −0.02 0 0.02 0.04 0.06 0.08 0.1 0.12 −0.1 −0.08 −0.06 −0.04 −0.02 0 0.02 0.04 Measure 1 (V) Measure 2 (V) Pass circuits Fail circuits Pass −> Fail Fail −> Pass
Fig. 12. Testing phase results using the octree shown in Fig. 10 with band guarding factors ofr1=r2= 1. Circled circuits correspond to circuits being misclassified by the octree, i.e. test escapes and test yield loss.
classified as pass. As can be appreciated, the misclassified circuits lie in the boundary of the test decision regions, which is the most prone area to misclassification.
Special attention needs the bar chart depicted in Fig. 13. It is showing the cumulative distribution of the required number of traversed levels in order to cluster every single circuit out of the105that have been generated. As can be observed, despite
the maximum octree level is 12 (plus the root node), more than 95% or the circuits are classified by just descending down to level 7. Recalling the algorithm listed in Fig. 3, it turns that with only 2×7 = 14 float number comparisons most of the circuits are clustered. This fact contrast with other classifier methodologies, such as support vector machines (SVM), which require the evaluation of multiple dot products
0 1 2 3 4 5 6 7 8 9 10 11 12 13 0 10 20 30 40 50 60 70 80 90 100 Octree level Cumulative tested (%)
Fig. 13. Cumulative percentage of tested circuits as a function of the achieved octree level for the testing phase. As can be appreciated, more than 90% of circuits are tested in just 7 levels recursions.
plus a complex kernel function [11].
The training and testing procedures have been performed using different octrees with different levels of band guarding factors. The band guarding factor related to gain specifications,
r1, has been varied from 0.5 to 1.78 in steps of 0.04. Similarly,
the band guarding factor related to bandwidth specifications,
r2, has been varied from 0.85 to 1.49 in steps of 0.02. Such
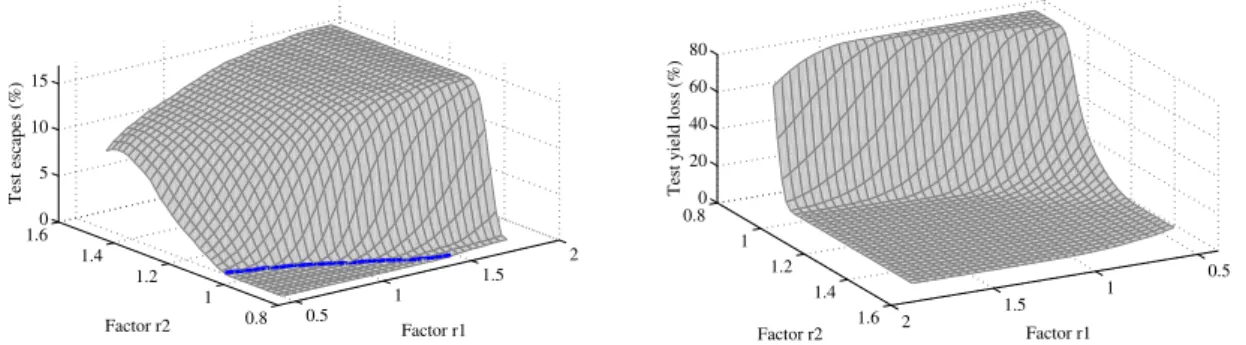
ranges result in grid of size33×33, which allows to explore the r1−r2 space. The resulting analog test metrics, i.e. test
escapes and test yield loss, are shown in Fig. 14 as function of factors r1 and r2. As mentioned before, the case r1 =
r2= 1corresponds to the nominal case with no band guarding
used. As can be appreciated, analog test metrics are drastically reduced down to zero as the band guarding factors vary along certain directions, while it is increased if opposite directions are taken.
As a rule of thumb, higher costs are incurred if circuits not accomplishing the specified test limits are shipped to the customer, i.e. false positive circuits. For that reason, fixing a test escape target and tune the test strategy to achieve it becomes a common practice in the test industry. For instance, let us assume the test escapes ratio must be below 1000 ppm (0.1%). In order to better elucidate the concepts throughout the example, Fig. 15 shows the test escapes contour levels in the
r1−r2plane. The established test escape level of 1000 ppm has
been highlighted using a thick blue line. This means that any combination of band guarding factors lying on this level will result in a test especifications with an associated test escape metric of 0.1%.
The counterpart metric to test escapes is the test yield loss. Test yield loss is defined as the ratio of circuits certainly accomplishing the test specifications but classified as fail by the test strategy, i.e. false negatives. In the used example, the test yield loss will serve to determine which is the optimum pair of (r1, r2) band guarding factors. Fig. 16 shows the
0.5 1 1.5 2 0.8 1 1.2 1.4 1.60 5 10 15 Factor r1 Factor r2 Test escapes (%) 0.5 1 1.5 2 0.8 1 1.2 1.4 1.6 0 20 40 60 80 Factor r1 Factor r2
Test yield loss (%)
Fig. 14. Test escapes (left) and test yield loss (right) metrics as a function of the band guarding factorsr1 andr2 evaluated using the set of105circuit samples in the testing phase. The test escapes target of 1000 ppm level is plotted in blue.
0.6 0.8 1 1.2 1.4 1.6 0.9 1 1.1 1.2 1.3 1.4 0.001 0.001 0.02 0.02 0.4 0.4 0.41 1 1 1 3 3 3 3 6 6 6 6 10 10 10 10 12 12 12 12 14 14 14 14 15 15 15 16 16 16 16.5 16.5 Factor r1 Factor r2
Test escapes levels (%)
Test escape target 1000 ppm = 0.1%
Fig. 15. Test escapes contour levels in ther1−r2plane. The test escapes target of 1000 ppm level is highlighted in blue. Any band guarding factor pair lying on the thick blue level guarantees a test escape of 1000 ppm.
together with the 0.1% test escape level elucidated from Fig. 15. The optimum band guarding factors would be the ones with the minimum test yield loss but still maintaining the test escapes target. It is clear that the contour level to choose is the one being tangent to the test escapes contour. Such yield loss contour level is highlighted with a thick red line in Fig. 16. The contour corresponds to a test yield loss of 16.77% and the needed band guarding factors to achieve the target arer1= 0.797 andr2= 1.010.
The results of the optimization process are listed in Table V. Initially, when no band guarding was used, the test escapes and yield loss were 2.05% and 3.11%, respectively. When using the proposed multiple specification band guarding method, the test escapes metric has been reduced by a factor of 20.5 at the expense of increasing the test yield loss metric by a factor of5.4. In the presented example, test escapes has been fixed as a target, but a different approach can be carried out using importance weights. For instance, an objective function
f(r1, r2)can be formed as a linear combination (or whatever)
of the test escapes and test yield loss functions as follows,
0.6 0.8 1 1.2 1.4 1.6 0.9 1 1.1 1.2 1.3 1.4 0.24 0.24 0.24 0.3 0.3 0.3 0.4 0.4 0.4 0.4 1 1 1 1 5 5 5 5 5 10 10 10 10 30 30 30 30 50 50 50 50 70 70 70 78 78 78 Factor r1 Factor r2
Test yield loss levels (%)
Test escape target 1000 ppm = 0.1% Optimum test yield loss level Optimum band guarding factors
Fig. 16. Test yield loss contour levels in ther1−r2 plane together with the resulting 1000 ppm test escape level from Fig. 15. The optimum band guarding factors are selected by choosing the minimum test yield loss level.
TABLE V
MULTIPLESPECIFICATIONBANDGUARDINGRESULTS
Without Band Guarding With Band Guarding Factor TE (%) 2.05 0.10 ÷20.5 YL (%) 3.11 16.77 ×5.4 r1 1.000 0.797 r2 1.000 1.010 f(r1, r2) =wTE·TE(r1, r2) +wYL·YL(r1, r2). Where wTE
andwYLare the weights assigned, for instance, proportionally
to the incurred costs of false positives and false negatives, respectively. Such a function can be numerically optimized without even the need of exploring the wholer1−r2 plane.
B. Noise Impact
It is clear that noisy indirect measurements may affect the test efficiency. The proposed multiple specification band guarding methodology is also capable of greatly improving
TABLE VI
MULTIPLESPECIFICATIONBANDGUARDINGRESULTSWHENGAUSSIAN NOISEISADDED TO THEINDIRECTMEASUREMENTS
Without Band Guarding With Band Guarding Factor TE (%) 3.21 0.50 ÷6.4 YL (%) 7.68 20.18 ×2.6 r1 1.000 0.989 r2 1.000 0.970
one of the metrics at the expense of worsening the other in the presence of noise. In order to study such scenario, simulations using Gaussian noise in the measurements have been carried out. Table VI shows the analog test metrics under the influence of Gaussian noise with a σ spread of 2 mV. As expected, results are worsened with respect to the results shown in Table V, but the method is still able to provide some benefits by just choosing the right band guarding factors depending on the desired targets. Here, a test escapes target has been fixed to 5000 ppm (i.e. 0.5%). The best obtained yield loss metric to achieve the target is 20.18%, what means that the method has been able to reduce the test escapes by a factor of 6.4 while increasing the test yield loss metric by a factor of 2.6. Results get affected by the noise but the method is still usable under such conditions.
C. Performance Evaluation
In order to provide some performance metrics of the pro-posed multiple specification band guarding technique using octrees, the computation times of the whole process have been annotated. The machine used in the benchmarking is an 8 core Intel Pentium i7 processor at 3.4 GHz with 16 Gbytes of RAM. The employed electrical simulator is Synopsis HSPICE version 2010.03 with no multiprocessing capabilities, i.e. all the simulations have been carried out using a single processor core. The algorithms for octree encoding and evaluation have been ad-hoc implemented in ANSI C using a recursive data structure as mentioned in Section II, while the postprocessing has been done using MATLAB R2012a.
Table VII shows the computation times for the training phase. As can be appreciated, the most time consuming items are the 104 AC and transient Monte Carlo simulations to
generate the training data sets. These two take about 1 min 17 s to be completed. The application of the multiple specification band guarding strategy using the presented33×33grid search for the band guarding factors takes about 1 min to complete. This means that, with a training set consisting of104 circuits,
an octree data structure encoding the acceptance/rejection regions is computed and stored to disk in just 54 ms. The total computation time devoted to the training phase is slightly over 2 min for the considered Butterworth filter case study.
Regarding the testing phase, Table VIII lists the required computation times. Again, the generation of the 105 circuits using Monte Carlo simulations is the bottle neck of the testing phase. The AC and transient simulations for the Butterworth
TABLE VII
COMPUTATIONTIME FORTRAININGPHASE
Item Time
10k circuits AC simulation 18.1 s
10k circuits TRAN simulation 59.3 s 33×33grid octree encodings with 10k circuits 58.8 s
Total time for training phase 2 min 16 s
TABLE VIII
COMPUTATIONTIME FORTESTINGPHASE
Item Time
100k circuits AC simulation 3 min 13 s 100k circuits TRAN simulation 9 min 57 s 33×33grid octree evaluations with 100k circuits 4 min 0 s
Total time for testing phase 17 min 10 s
filter take about 10 min 10 s. The evaluation of these 105
circuits in the previously encoded octrees for each of the (r1, r2)band guarding factors within the considered grid takes
about 4 min to be completed. In other words, the evaluation of 105 circuit samples in a single octree including the storage of the results to disk can be done in just 220 ms what implies that a single circuit can be clustered in 2.2 µs in average. These remarkable evaluation performances can be achieved because only one float number comparison per coordinate and level traversed is required. For the considered case study, the total computation time devoted to the testing phase is 17 min 10 s.
VI. CONCLUSIONS
A multiple specification band guarding technique for testing mixed-signal circuits in the indirect measurement space has been proposed. The method is based on a set of factors which are in charge of shrinking or enlarging the CUT specifications cube. An adequate tuning of the band guarding factors allows the optimization of any test target involving the number of misclassified circuits by the test methodology. The test method comprises two phases. The training phase encodes the indirect measurement using octrees to represent the acceptance/rejection test regions. In this phase, the multiple specification band guarding methodology tunes the CUT spec-ifications. The production testing phase uses the octree data structure in order to efficiently test the forthcoming circuits taking advantage of the inherent octree sparsity.
The proposed multiple specification band guarding method-ology has been applied to test a band-pass Butterworth filter with promising results. The band guarding factors have been set to act over the gain and bandwidth specifications of the CUT. The optimum selection of band guarding factors has allowed the achievement of the initially fixed test targets. Sim-ulations conducted under the presence of noise have revealed the proposed band guarding methodology is time efficient and also usable under noisy indirect measurements.
REFERENCES
[1] L. Milor, “A tutorial introduction to research on analog and mixed-signal circuit testing,”Circuits and Systems II: Analog and Digital Signal Processing, IEEE Transactions on, vol. 45, no. 10, pp. 1389–1407, 1998. [2] P. N. Variyam and A. Chatterjee, “Specification-driven test generation for analog circuits,”IEEE Transactions on Computer-Aided Design of Integrated Circuits and Systems, pp. 1189–1201, 2000.
[3] S. Devarakond, S. Sen, S. Bhattacharya, and A. Chatterjee, “Concurrent device/specification cause-effect monitoring for yield diagnosis using al-ternate diagnostic signatures,”Design Test of Computers, IEEE, vol. 29, no. 1, pp. 48–58, 2012.
[4] H. Stratigopoulos and S. Mir, “Adaptive alternate analog test,”Design Test of Computers, IEEE, vol. 29, no. 4, pp. 71–79, August 2012. [5] H. Ayari, F. Azais, S. Bernard, M. Comte, V. Kerzerho, O. Potin,
and M. Renovell, “Making predictive analog/rf alternate test strategy independent of training set size,” inTest Conference (ITC), 2012 IEEE International, November 2012, pp. 1–9.
[6] M. Barragan and G. Leger, “A procedure for alternate test feature design and selection,”Design Test, IEEE, vol. 32, no. 1, pp. 18–25, February 2015.
[7] H.-G. Stratigopoulos and Y. Makris, “Error moderation in low-cost machine-learning-based analog/rf testing,” Computer-Aided Design of Integrated Circuits and Systems, IEEE Transactions on, vol. 27, no. 2, pp. 339–351, 2008.
[8] G. Leger, “Boundary cost optimization for alternate test,” inProceedings of European Test Symposium (ETS), Cluj Napoca, Romania, May 2015. [9] J. H. Friedman, “Multivariate adaptive regression splines,”Ann. Statist.,
vol. 19, no. 1, pp. 1–67, 03 1991.
[10] A. G´omez-Pau, L. Balado, and J. Figueras, “M-s test based on speci-fication validation using octrees in the measure space,” inProceedings of IEEE European Test Symposium (ETS), Avignon, France, May 2013, pp. 70–75.
[11] ——, “Efficient production binning using octree tessellation in the alternate measurements space,”IEEE Transactions on Computer-Aided Design of Integrated Circuits and Systems, 2015, [available online]. [12] A. Chatterjee and S. Cherubal, “Method for diagnosing process
param-eter variations from measurements in analog circuits,” June 2002, uS Patent App. 09/838, 404.
[13] S. Larguech, F. Aza¨ıs, S. Bernard, M. Comte, V. Kerz´erho, and M. Ren-ovell, “Efficiency evaluation of analog/rf alternate test: Comparative study of indirect measurement selection strategies,” Microelectronics Journal, vol. 46, no. 11, pp. 1091–1102, 2015.
[14] M. Barragan and G. Leger, “Efficient selection of signatures for analog/rf alternate test,” inTest Symposium (ETS), 2013 18th IEEE European, May 2013, pp. 1–6.
[15] A. G´omez-Pau, L. Balado, and J. Figueras, “Mixed-signal test band guarding using digitally coded indirect measurements,” inProceedings of International Conference on Synthesis, Modeling, Analysis and Simu-lation Methods and Applications to Circuit Design (SMACD), Istanbul, Turkey, September 2015.
[16] A. Singhee and R. Rutenbar, “Statistical blockade: A novel method for very fast monte carlo simulation of rare circuit events, and its appli-cation,” inDesign, Automation Test in Europe Conference Exhibition, April 2007.
[17] G. Gielen and R. Rutenbar, “Computer-aided design of analog and mixed-signal integrated circuits,” Proceedings of the IEEE, vol. 88, no. 12, pp. 1825–1854, December 2000.
[18] C. Cortes and V. Vapnik, “Support vector networks,”Machine Learning, vol. 20, no. 3, pp. 273–297, 1995.
[19] D. Meagher, “Octree encoding: A new technique for the representation, manipulation and display of arbitrary 3-d objects by computer,” Rens-selaer Polytechnic Institute, New York, techreport, 1980.
[20] A. G´omez-Pau, L. Balado, and J. Figueras, “M-s specification binning based on digitally coded indirect measurements,” inProceedings of IEEE European Test Symposium (ETS), Paderborn, Germany, May 2014, pp. 105–110.
[21] H. G. Dimopoulos, Analog Electronic Filters. Theory, Design and Synthesis. New York: Springer, 2012.
[22] ST-Microelectronics, “Cmos065 design rule manual. 65 nm bulk cmos process,” 2013, version 5.3.6.
[23] L. Balado, E. Lupon, J. Figueras, M. Roca, E. Isern, and R. Picos, “Verifying functional specifications by regression techniques on lissajous test signatures,”IEEE Transactions on Circuits and Systems I: Regular Papers, vol. 56, pp. 754–762, April 2009, issue 4.
[24] A. G´omez, R. Sanahuja, L. Balado, and J. Figueras, “Analog circuit test based on a digital signature,” inProceedings of IEEE Design Automation and Test in Europe Conference (DATE), Dresden, Germany, March 2010, pp. 1641–1644.
[25] A. G´omez-Pau, L. Balado, and J. Figueras, “Diagnosis of parametric de-fects in dual axis ic accelerometers,”Microsystem Technologies Journal, vol. 21, no. 9, pp. 1855–1866, September 2015.
[26] M. G. Kendall, “A new measure of rank correlation,”Biometrika, vol. 30, no. 1/2, pp. 81–93, June 1938.
´
Alvaro G´omez-Pau received the M.Sc. degree in Engineering from Universitat Polit`ecnica de Catalunya (UPC-BarcelonaTech), Barcelona, Spain, in 2010. He is a Ph.D. candidate at the Department of Electronics Engineering at the same university. His research interests include design and test of analog and mixed-signals circuits.
Luz Balado received the M.Sc. and Ph.D. de-grees in engineering from Universitat Polit`ecnica de Catalunya (UPC), Barcelona, Spain, in 1980 and 1986, respectively. She is currently an Associate Professor with the Department of Electronics En-gineering, UPC, where she teaches electronics and electronic instrumentation. She is involved in Mi-croelectronics and Test Research Group. Her main research interests include design and test of digital and mixed-signal circuits, defect modeling, and low-power design.
Joan Figueras received his Industrial Engineering degree from Universitat Polit`ecnica de Catalunya (UPC), Barcelona, Spain, and the M.Sc. and Ph.D. degrees from the University of Michigan, Ann Ar-bor. He is currently Emeritus Professor at the De-partment of Electronics of the UPC, where he has research responsibilities in the areas of electronics and digital and mixed-signal design and test. His research interests are centered in emerging topics in low-power design and advanced test of electronic circuits and systems. He has an extensive publication record and has presented seminars and tutorials in professional meetings, NATO seminars on topics related to “Low Power Design” and “Quality in Electronics”. Dr. Figueras is currently an Editor of JETTA, was an Associated Editor of THEIEEE TRANSACTIONS ONCOMPUTER-AIDEDDESIGN OF INTEGRATEDCIRCUITS ANDSYSTEMS, and is a member of the steering and program committee of several Test and Low Power Design conferences.