A BPTrends Report
Sponsored by
Business Process
Modeling
Survey
December 2011
Paul Harmon & Celia Wolf
Copyright (c) 2011 Business Process Trends. www.bptrends.com 2
Contents
Introduction
3
The Respondents
4
Job Title or Function
The Scope of the Respondent’s Coverage The Size of the Organizations Being Described Industries Represented in the Survey
The Geographical Locations of the Respondents Companies Comments on Respondents
Process Modeling 10
Do You Do Business Process Modeling? How do you use business process modeling?
What Approach Do You Take to Process Modeling? Business Process Redesign Methodologies
Business Process Simulation
Process Modeling Tools
17
Do You Use a Software Tool for Process Modeling? What Modeling Tool Features Are Most Important? Process Modeling Notations and Standards
BPMS
21
How Extensively is BPMS Being Used?
Combining BPMS Suites with Process Modeling Tools
Does the Same Team do Business Process Modeling and Application Development? Roadblocks to BPMS
Summary
26
Appendices
29
Appendix I. CMMI Maturity Levels
Appendix II. The Three Business Process Traditions
Copyright (c) 2011 Business Process Trends. www.bptrends.com 3
Introduction
This report summarizes information provided by 559 respondents who completed a BPTrends Process Modeling Survey between June 27 and August 4, 2011. Like other BPTrends Reports, this report is available without charge to all registered members of BPTrends. We hope the information in this report will provide readers with insight into the ways that process modeling is being used in organizations today.
The respondents to this survey were either one of the approximately 16,000 registered members of the BPTrends community or they were visitors to the BPTrends website. While BPTrends covers the entire range of topics that can be said to be part of “business process,” we tend to draw more managers and practitioners interested in a comprehensive approach to process management than those interested in more narrowly focused concerns, like Six Sigma, Business Rules, or Business Process Outsourcing. As a result, our surveys tend to reflect the perspectives of a broad base of business managers and practitioners interested in a comprehensive approach to process.
Process modeling is a popular technique used by process practitioners to capture, organize and communicate information about business processes. Process models can be drawn on blackboards, on paper, or they can be represented in digital form in various types of process modeling software. Similarly, process models can be very high level abstractions that define phases of activity or they can be very detailed representations of the steps taken and the decisions made in a specific operation. A business manager, for example, might draw three boxes on a piece of paper to represent the three phases that his organization typically goes through in the course of an audit project. A software analyst might draw dozens of boxes with arrows and diamonds to show exactly what decisions were required to approve a new credit account. Both could be called process models, and this survey used the term “process modeling” very broadly to allow us to consider any and all types of modeling. We thank everyone who took part in the survey. It is only by sharing information in this way that we can provide the process community with insight into its current practices. We hope you find the report useful.
Celia Wolf
CEO/Publisher/BPTrends
Paul Harmon
Senior Market Analyst/Executive Editor - BPTrends
Copyright (c) 2011 Business Process Trends. www.bptrends.com 4
The Respondents
BPTrends conducted this survey between June 27 and August 4, 2011. We announced the survey to our members and readers through our monthly BPTrends mailings and our BPTrends Homepage encouraging them to participate. Therefore, the respondents to this survey were either BPTrends members and/or readers of BPTrends. This report is based on the 559 respondents who completed the entire survey. Partial completes are not included in the tabulations.
In the charts and tables that follow, some of the totals will add to less than 559 because some questions are not relevant to some respondents, or because some questions allowed respondents to select more than one answer. In addition, total percentages do not always sum to exactly 100% because of rounding, or because the question allowed the respondent to select more than one answer.
Job Title or Function
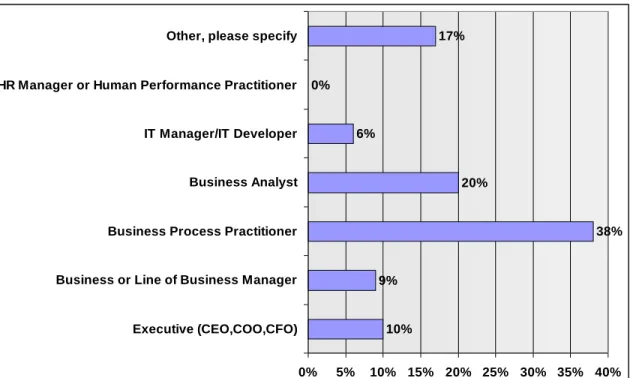
10% 9% 38% 20% 6% 0% 17% 0% 5% 10% 15% 20% 25% 30% 35% 40% Executive (CEO,COO,CFO) Business or Line of Business Manager Business Process Practitioner Business Analyst IT Manager/IT Developer HR Manager or Human Performance Practitioner Other, please specify
Figure 1. Respondent’s job title or function
Each respondent was asked to describe his or her job or function within his or her organization. In the chart presented in Figure 1 we show how the respondents answered this question. As you can see, over half (58%) describe themselves as either a business analyst or business process practitioner. (See Figure 1.)
In past surveys, we did not include the “business analyst” job title, and the number of respondents saying they were process practitioners has typically amounted to 50-60% of the total. When we break the two out, it seems likely that, in the past, lots of those who prefer the Business Analysttitle identified themselves as Business Process Practitioners.
The other respondents distribute as they have in the past, with about 20% saying they are business managers, and 5-8% saying they are from IT.
Copyright (c) 2011 Business Process Trends. www.bptrends.com 5
The number of respondents selecting “Other” is a bit higher on this survey (17%) than in the past. When we look at the written choices the “Others” entered, 27 described themselves as some kind of an architect, with a significant number describing themselves as “business architects.” This is new, and represents a growing interest in that job title. Besides “architects,” most of the other respondents who wrote in a title suggested that they were serving in some kind of consulting or advisory role. A smaller, third group, suggested that they were university students or professors. As in the past, those responding to the survey represent a broad cross section of those, outside of IT, who are working to change processes in the organization.
If one analyzes by geographical area, then it’s obvious that there are a lot more business analysts taking part in the survey who are from Europe than from North America. This seems to suggest that “process practitioner” is more likely to be a unique job in North America, while it is more likely be a role assigned to business analysts in European countries.
The Scope of the Respondent’s Coverage
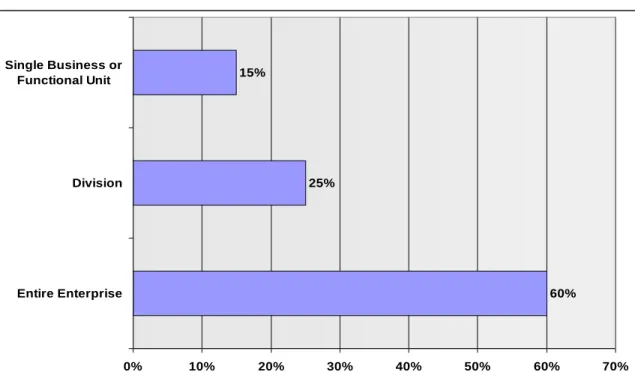
60% 25% 15% 0% 10% 20% 30% 40% 50% 60% 70% Entire Enterprise Division Single Business or Functional Unit
Figure 2. The business unit the respondent is describing
We asked respondents to tell us if they would be describing their entire organization, or simply a division or business unit within a larger organization. Sixty percent said they were reporting on the entire enterprise, 25% on a division, and 15% said they were reporting on a single business or functional unit. (See Figure 2.)
Once again, this response is very much in line with other surveys we have undertaken. The responses to this question have remained consistent over the course of the last eight years. More than half of the respondents are describing the entire organization and something less than half are describing a division or functional unit.
Copyright (c) 2011 Business Process Trends. www.bptrends.com 6
The Size of the Organizations Being Described
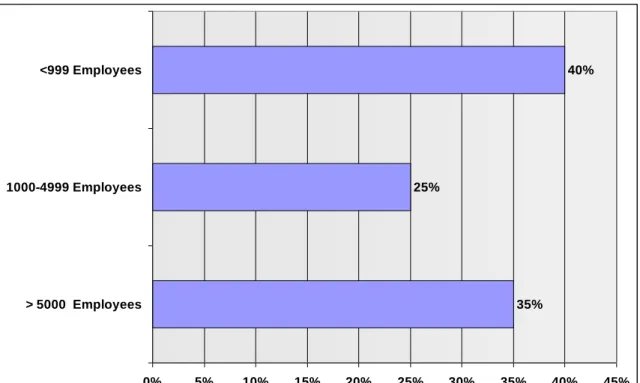
35% 25% 40% 0% 5% 10% 15% 20% 25% 30% 35% 40% 45% > 5000 Employees 1000-4999 Employees <999 Employees
Figure 3. The size of the respondent’s organization
We asked each respondent to indicate the overall size of the organization he or she would be describing. Forty percent were reporting on a company with less than 1000 employees, 25% on companies employing 1000-5000 employees and 35% were in organizations with over 5000 employees. (See Figure 3.)
Once again, this represents a nicely balanced response. If one factors out consultants and small companies, one finds that the number of executives represented in the survey drops. As in past surveys, the respondents divide between small, midsize (1000-4999 employees) and large organizations, with approximately one third in each category.
Copyright (c) 2011 Business Process Trends. www.bptrends.com 7
Industries Represented in the Survey
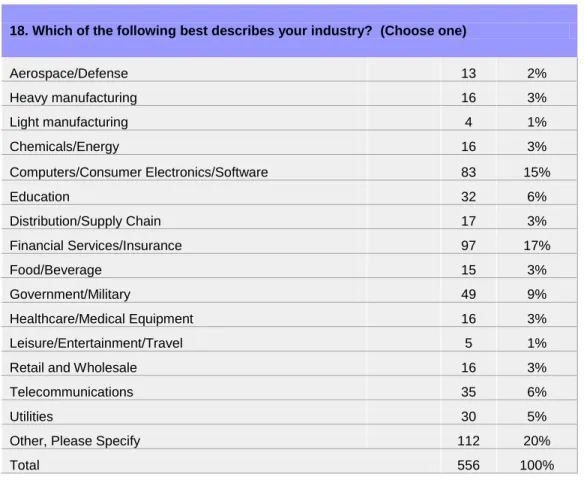
18. Which of the following best describes your industry? (Choose one)
Aerospace/Defense 13 2% Heavy manufacturing 16 3% Light manufacturing 4 1% Chemicals/Energy 16 3% Computers/Consumer Electronics/Software 83 15% Education 32 6% Distribution/Supply Chain 17 3% Financial Services/Insurance 97 17% Food/Beverage 15 3% Government/Military 49 9% Healthcare/Medical Equipment 16 3% Leisure/Entertainment/Travel 5 1% Retail and Wholesale 16 3% Telecommunications 35 6%
Utilities 30 5%
Other, Please Specify 112 20%
Total 556 100%
Figure 4. The range of industries represented in the survey
We asked respondents to identify the industry in which they worked. The categories match those used by U.S. Department of Labor.
The largest group (20%) chose “Other”, and most of those identified their industry as consulting. The next largest group (17%) is in financial services/insurance. The third largest group (15%) is from the computers/consumer electronics/software industry. We suspect that most of those choosing computers/consumer electronics/software are probably in the software area. The problem with this industry group comes in distinguishing those who are vendors of business process products and services, and those whose companies use BPM products to support their internal process work. The financial services industry is very competitive, generates high profit margins, and depends on computer systems to support or implement its services. Thus, they have always been quick to invest in any new IT hardware or software that might give them a competitive advantage.
BPMS vendors are software vendors, so determining whether a given response is from a user at a software company, whose interest is in whether the new software makes it easier for the company to achieve its goals, or from a vendor who is interested in promoting a specific approach to development is often difficult to sort out.
At 9%, government/military makes up the fourth largest group. We can’t say how many are actually in government or the military and how many are contract workers. Nevertheless, its rank in the
Copyright (c) 2011 Business Process Trends. www.bptrends.com 8
survey indicates that government and the military are still strong drivers and funders of business process methodology development and implementation.
Respondents indicating a Government affiliation are more likely outside North America, which makes sense when you consider that many programs that are doing extensive process work, like healthcare, are more likely to be managed by the government outside the US. Similarly, education at 6% reflects government funding. Telecommunications makes up the next 6%. None of the other categories accounted for more than 5% of respondents. (See Figure 4.) Once again, this distribution is typical of other surveys we have conducted.
In all our surveys, if we exclude “Other,” Financial Services/Insurance is always the largest group, usually followed by Computers/Consumer Electronics/Software, and/or by Government/Military. The prominence of Finance, both in our survey and any general survey of companies that use software, reflects the fact that it is a very competitive industry, has a high profit margin, can afford innovation, and depends on software to create and field its services. Computing is a bit more confusing, since many who say they are in that industry may be software vendors who sell BPMS or process modeling products. Government/Military, on the other hand, are always high on the list simply because they are so engaged in process work. This is especially true of governments outside the US, which are more likely to have healthcare and other responsibilities. In a nutshell, process work is being pursued in nearly every industry, worldwide.
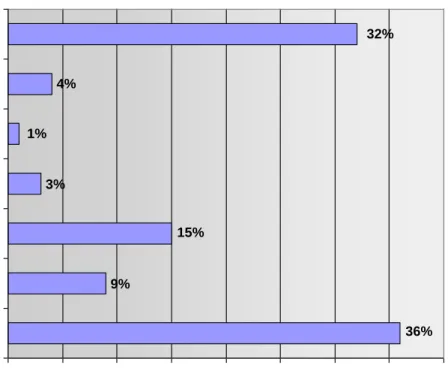
The Geographical Locations of the Respondents Companies
32% 4% 1% 3% 15% 9% 36% 0.00% 5.00% 10.00% 15.00% 20.00% 25.00% 30.00% 35.00% 40.00% North America South America Australia/New Zealand SE Asia/India NE Asia (Japan, Korea,
Greater China) Africa/Middle East
Europe
Figure 5. Where respondents’ organizations are located
We also asked respondents to tell us where their organizations were located. Well over half, 68%, are in North America (36%) or Europe (32%). The largest remaining segment, 15%, is in Australia/New Zealand. South America at 9% accounts for the most respondents from emerging markets, with Africa/Middle East (4%), SE Asia/India (3%), and NE Asia (1%) representing the rest.
Copyright (c) 2011 Business Process Trends. www.bptrends.com 9
In this case we find an interesting change. As in the past, most respondents come from North America and Europe. And, as in the past, Australia/New Zealand is very well represented and both South East and North East Asia are very poorly represented. What is new this year is the greater representation of South America. This fits with our overall impression that there is a rapidly growing interest in process work in South America. In part this probably reflects the growing economic might of countries like Brazil, and in part it represents the need of local manufacturers in South America to adjust to the challenge of China’s growing manufacturing capability, which has disrupted traditional processes and supply chains in South America just as it has in Europe and North America.
Comments on Respondents
We have already suggested that we are impressed by both the size of the sample – the number of people who responded – and the distribution of the sample among industries, geographical locations, and company size. These elements all suggest that the data is representative of the broad scope of BPM in the world today.
We do, however, want to remind readers of qualifications readers should consider in reviewing the data. First, most found out about the survey because they are members of BPTrends and are self-identified process people. We can not assume that the respondents represent the opinions of the average business executive. The data presented here represents the opinions of people who are concerned with and, at least, a little knowledgeable about the role or importance of business process. Second, we did not ask each respondent to identify his or her company. Thus, we don’t know how many respondents come from the same company. We have generally assumed that each respondent represents a different company. Thus, if 44% of the respondents said their companies used stand-alone Business Process Modeling tools (Figure 12.), we have assumed that 44% of the companies used those tools. This assumption is reasonable, even if a few of the respondents do come from the same company, but readers should be aware that we are ultimately reporting on the responses of individuals, and not responses from different companies.
Third, a large number of respondents were from Computers/Consumer Electronics/Software and Professional/Business Services/Consulting. Many of these respondents are probably consultants or software vendors who are not actually doing BPM implementation work themselves, but helping others in their BPM efforts. We checked several questions and did not find that the responses of those who said they were from Computers/Consumer Electronics/Software were very different from those of obvious end users, like those from Finance or Manufacturing. Where it does seem to skew the data a bit is in the number of Executives included in the survey. Of the 56 respondents from Computers and Software in 2005, for example, 16 were Executives. Of the 52 respondents from Professional and Consulting, 20 were Executives. Of the 63 respondents from Financial Services and Insurance, only 7 were Executives. Only 2 of the 13 respondents from manufacturing listed themselves as Executives.
Something similar happens when you consider the relationship between company size and job titles. Most of the executives come from small companies. And most of the professional and consulting companies are small companies. Thus, readers shouldn’t focus too much on the number of Executives taking part in the survey, as they probably represent executives from consulting companies and software vendors and not executives from end user companies. On the other hand, the Business Line Managers are mostly from larger companies and are more broadly representative of the entire range of industries involved in the survey.
We use filters – which allow us to examine how a particular subgroup of respondents answer the questions -- to check for any bias being introduced by respondents from specific groups – like Finance or Computing – and whenever we think the answers to a given question might be skewed by an atypical response by a particular subgroup of respondents, we note it.
Copyright (c) 2010 Business Process Trends. www.bptrends.com 10
Business Process Modeling
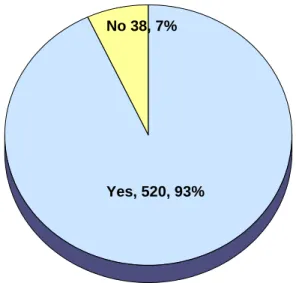
Do You Do Business Process Modeling?
Figure 6. Do you do business process modeling?
We asked all respondents whether or not they or their organization used business process modeling. We did not specify any specific type of process modeling. Five Hundred and Twenty (520) respondents (93%) said they or their organizations did business process modeling. Keeping in mind that our respondents have self-selected themselves for a survey on Business Process Modeling, it still represents the largest positive response to this question we have received in seven years of surveying. We will return to this result after we have considered some of the other responses, but to anticipate, we believe there has been a significant increase in the number of organizations doing some kind of process modeling. In previous surveys, for example, less than 80% of the respondents indicated that they were using either Visio or some other kind of modeling tool, and under 70% indicated that they had their major processes modeled.
This result is true for all regions of the world from which we have enough responses to make general statements. Thus, process modeling is just as common in Europe, South America, and in
Australia/New Zealand, as it is in North America. If any of these areas stand out, it is the
Australia/New Zealand region, where 98% say their organizations do process modeling and only 2% say they do not. (We do not have enough responses to make meaningful statements about Asia, Africa or the Middle-East.)
Yes, 520, 93% No 38, 7%
Copyright (c) 2011 Business Process Trends. www.bptrends.com 11
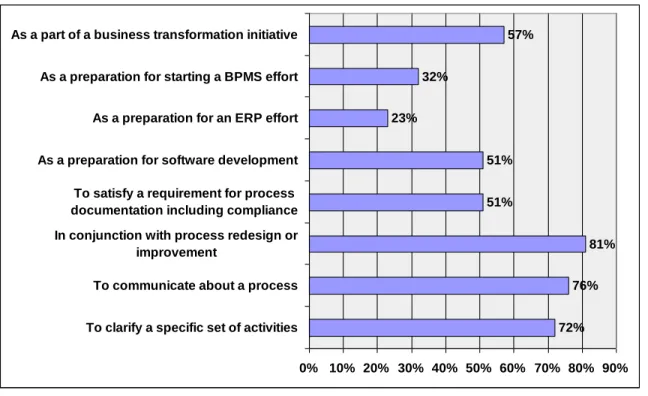
How Do You Use Business Process Modeling?
72% 76% 81% 51% 51% 23% 32% 57% 0% 10% 20% 30% 40% 50% 60% 70% 80% 90% To clarify a specific set of activities
To communicate about a process In conjunction with process redesign or
improvement
To satisfy a requirement for process documentation including compliance As a preparation for software development As a preparation for an ERP effort As a preparation for starting a BPMS effort As a part of a business transformation initiative
Figure 7. How do you use business process modeling?
We asked those who do modeling how they use business process modeling. They had 8 choices from which they could pick more than one. (See Figure 7.)
We could divide the responses here into roughly three groups:
Those who said they use process modeling to Clarify, Communicate, or use it in Conjunction with Process Redesign or Improvement were each between 72%-81%.
Respondents who said they use process modeling as part of a Transformation Initiative, to Satisfy a Process Documentation Requirement or as a Preparation for Software Development fell between 51% and 57%.
Those who use process modeling in conjunction with an ERP effort, or as Preparation for starting a BPMS effort were at 27%
Once again, we need to recall that most of the respondents are not IT developers, but business process practitioners, systems analysts or business managers. With that qualification, process modeling is being used to define, redesign and communicate information about processes. Its use as a preparation for a transformation effort or for software development is still significant, but its use for ERP or for BPMS, is strictly tertiary.
Once again, this pattern is true for all regions from which we have meaningful data. North Americans are more likely to stress process redesign than other regions, and Australia/New Zealand are slightly less likely to stress the need to clarify a specific set of activities, but these are minor differences and the overall pattern is consistent across all regions.
We also checked this result with more specific populations. For example, the pattern is the same with Business Analysts as with those who defined themselves as Business Process Practitioners and it is the same for respondents who identified their industry as computers or consulting, as with those in other industries.
Copyright (c) 2011 Business Process Trends. www.bptrends.com 12
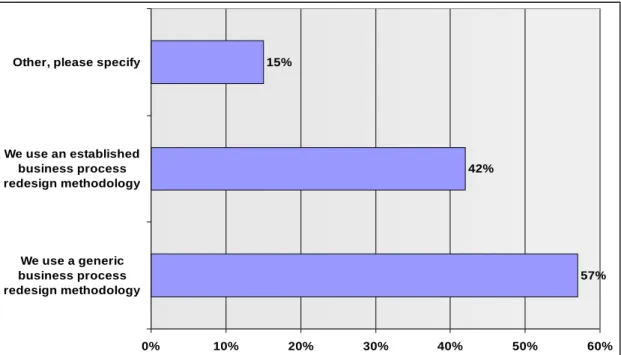
What Approach Do You Take to Business Process Modeling?
57% 42% 15% 0% 10% 20% 30% 40% 50% 60% We use a generic business process redesign methodology We use an established business process redesign methodology
Other, please specify
Figure 8. What approach do you take to business process modeling ?
Next we asked respondents who indicated that they use modeling for process redesign or improvement – 421 or 81% --what approach they use. (See Figure 8.) By this we meant whether they use a generic business process redesign methodology, an established methodology (like Lean or Six Sigma), or something else. The respondent could pick more than one category. Fifty-seven percent (57%) indicated they use a generic methodology; 42% use an established methodology, and 15% chose other. Because the percentages add to more than 100% we know that some are combining generic and established approaches, but from the data we can’t distinguish who is using both or how this group answered other questions.
Again, this pattern was similar in all geographical regions and equally true for Business Analysts and those from computer companies as for those who identified themselves as Business Process Analysts. The one exception to this generalization is that respondents from South America were more likely to use a specific, established methodology than a generic methodology.
Copyright (c) 2011 Business Process Trends. www.bptrends.com 13
Business Process Redesign Methodologies
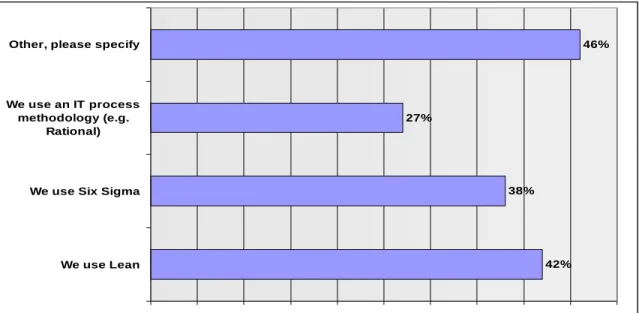
42% 38% 27% 46% 0% 5% 10% 15% 20% 25% 30% 35% 40% 45% 50% We use Lean We use Six Sigma We use an IT process methodology (e.g.
Rational) Other, please specify
Figure 9. Which established methodologies do you use?
We asked respondents who said they used an established methodology to tell us which specific methodology or mix of methodologies they use, i.e., they could choose more than one of the four choices. Here the largest percentage (46%) chose “Other”. Looking at those specific responses, most were in-house or BPM methodologies. Again, we don’t know who precisely is using more than one methodology, but from the sum of the numbers and percentages we know that some were. Given that, 42% use Lean, 38% Six Sigma, and 27% use an IT process methodology (e.g. Rational). (See Figure 9.)
If we combine Lean and Six Sigma, we get something like 65% who use both. (This will be a little high as several who indicated they use Lean may also have said they use Six Sigma.) At the same time we see that 27% use an IT process methodology (like IBM’s Rational), probably reflecting the high number of respondents who are business analysts.
The use of Lean and Six Sigma are both more common in North America (52% and 46% respectively) than in other regions. It is less common in Europe (32% and 24%) and South America (36% and 31%). The use of Lean and Six Sigma is less common among those who identify themselves as business analysts, but it isn’t significantly less among those who identify themselves as working for computer or consulting companies.
What is most interesting, however, is that most who say they use an established methodology (46%) say they use one not listed. We examined the Other responses, and classified them as follows:
Proprietary company –developed methodology – 25 respondents Methodology provided by a software vendor – 15
(ARIS was mentioned by 5 of the 15 respondents in this category.) BPTrends Methodology -- 10
Rummler or Rummler/Brache -- 6
Framework-based Methodology (e.g. SCOR) -- 6 Methodology provided by major consulting firm -- 4 IDEF -- 3
Copyright (c) 2011 Business Process Trends. www.bptrends.com 14
CMMI -- 3 Hammer -- 2
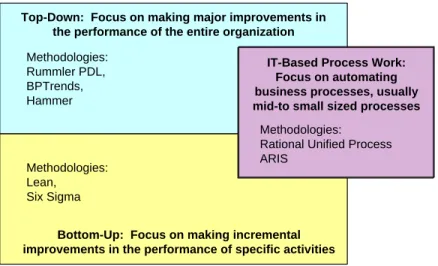
We have suggested for some time that there are, at the moment, three broad traditions in business process work. One tradition is focused on Quality and is currently represented by Lean and Six Sigma, one is focused on IT and is represented by software-focused process methodologies, and a third is a management tradition focused on improving the overall performance of the organization, often associated with Business Process Reengineering. The Quality tradition tends to be bottom up, focused on incremental changes, the Management tradition tends to be top-down, focused on major changes in how the organization works, and the IT tradition tends to lie somewhere in between, and can embrace either top-down or bottom-up. (See Appendix II for a more detailed explanation of these traditions.)
Top-Down: Focus on making major improvements in the performance of the entire organization
Bottom-Up: Focus on making incremental improvements in the performance of specific activities
IT-Based Process Work: Focus on automating business processes, usually mid-to small sized processes
Methodologies: Rational Unified Process ARIS Methodologies: Rummler PDL, BPTrends, Hammer Methodologies: Lean, Six Sigma
Figure 10. Types of Business Process Methodologies
Figure 10 provides an overview of the three traditions. We suggest that the data supports these three traditions, with Lean/Six Sigma of interest to from 42 to 80 percent of the respondents (depending on how much overlap there is between those who chose Lean and those who chose Six Sigma). Let’s say 50% of the respondents are interested in Lean Six Sigma. Another 42% of the respondents said they were engaged in using IT methodologies, either because they wanted to automate the process in question, or simply because they had an IT background and prefer one of the several popular IT process methodologies or notations. Of those that chose “Other,” some are clearly interested in IT and others cannot be accurately identified as preferring one methodology or the other, but we suggest that about 25-30% of the “Other” responses refer to some kind of top-down, Business Process Redesign (BPR) methodology and are working largely in the “management tradition.” We have also observed that BPR or top-down methodologies tend to be more popular when the economy is expansive and companies are undertaking major changes, acquiring companies or expanding into new markets. On the other hand, bottom-up methodologies, which place more emphasis on discrete cost savings, tend to be more popular in times when the economy is weaker and companies are trying to control expenditures. IT-based methodologies tend to be immune from the business cycle, although they are less popular with business process practitioners working in the business area, and more popular with those focused on automation projects.
Copyright (c) 2011 Business Process Trends. www.bptrends.com 15
Business Process Simulation
72% 6% 22% 0% 10% 20% 30% 40% 50% 60% 70% 80% We do not use simulation We use a tool specifically designed for
process simulation We use a simulation tool
in a process modeling or BPMS tool
Figure 11. Do you use business process simulation?
Here let us give a brief description of the difference between business process modeling and business process simulation…
We asked whether or not the respondents use business process simulation, and if so, whether they use a simulation tool in a process modeling or BPMS tool or a tool specifically designed for process simulation. Looking at Figure 11 we can see that a large majority (72%) do not use a simulation in their process management work. Of those who do, many more 114 (22%) use a simulation tool in a process modeling or BPMS tool as opposed to 28 (6%) who use a tool specifically designed for process simulation.
These results did not vary when we looked at responses from specific geographical locations or from roles or companies.
In our BPM consulting practice we have seen several large business process redesign projects where simulation was indispensible. When the process flow is complex enough, it is impossible to understand how a process design will work in actual practice without the information that simulation provides. We can well remember one project, where we set up the process with a default flow and a secondary path for exceptions. It was only when business rules were applied and actual data run through the process that we realized that about 75% of the transactions were being classified as “exceptions” and that our 10 regular processing clerks were often without work while our two exceptions clerks were getting further and further behind.
That said, we are the first to admit that we did not set up the simulation that provided this valuable information. A simulations specialist, using a powerful simulation tool took our flow plan and our business rules and generated the simulation that prevented us from launching a process that would have ground to a halt in one or two days, if we had actually launched it as we designed it.
To do a good simulation, you need data of past instances, and a sophisticated knowledge of the kinds of algorithms required to get good results. Lots of modeling tool vendors have struggled to add
Copyright (c) 2011 Business Process Trends. www.bptrends.com 16
simulation capabilities because companies often put simulation on their tool selection checklists – only to find that few if any of those who purchase their products ever do simulation.
We confidently predict that the same thing will happen with Process Mining, which is currently getting a lot of attention. Once again, this is a powerful technology that would be of great value in a variety of large projects, but only if you have people who know how to set up the technology so that it’s useful in your specific situation.
The key to the more extensive use of either simulation or process mining lies with those who design user interfaces. Someone is going to have to develop a really elegant, powerful interface that makes setting up and using simulation much easier before it will be widely used.
Copyright (c) 2011 Business Process Trends. www.bptrends.com 17
Process Modeling Tools
Do You Use a Software Tool for Process Modeling?
As we indicated in the Introduction, one can do process modeling on a blackboard or on a sheet of paper. Similarly, one can use digital diagrams to create models in tools like Visio, or one can use much more powerful modeling tools in which each element of the process is defined in a database. The value of database-based (also called repository-based) modeling tools is that they save your models and allow their reuse. More important, they allow you to begin to build a database of all of the processes, and information about specific processes, used in your organization.
A repository-based modeling tool is hardly simple, but it’s relatively simple compared with a BPMS suite or platform that allows you to not only create a diagram of a process, but to execute the process at runtime (as one does with a workflow system or with an ERP application). The process modeling, in a BPMS tool functions as the instructions which the BPMS engine implements when it processes a customer request. We are not interested in BPMS tools or BPMS applications, as such, in this survey. We are interested in BPMS as a driver for process modeling, and as a kind of “advanced” process modeling environment. To simplify things, we will divide our discussion, first considering simpler diagramming tools (like Visio) and repository-based process modeling software, and then, in the following section, we will consider the role that BPMS software is playing in the process modeling arena. 27% 44% 26% 3% 0% 5% 10% 15% 20% 25% 30% 35% 40% 45% 50%
Yes, we use MS Visio Yes, we use a stand-alone process modeling
tool
Yes, we use a process modeling tool that is
part of a BPM Suite No, we do not use a software tool to create or save process models
Figure 12. Do you use a software tool for process modeling?
We asked about use of software tools – whether or not one is used to create or save process models– and if, yes, what kind of tool is used. (See Figure 12.) The vast majority use a software tool to create or save their models. Only 15 (3%) do not. Most (44%) use a stand-alone tool and the rest are pretty evenly divided between those who use a process modeling tool that is part of a BPM Suite (26%) and those who use MS Visio (27%) Keep in mind that respondents could choose more than one response, and as we will see later, many use both Visio or a stand-alone process modeling tool, and a BPMS suite.
Copyright (c) 2011 Business Process Trends. www.bptrends.com 18
The results illustrated in Figure 12 are true for most geographical regions and for various roles and industries. The significant exception is that North Americans are more likely to use Visio (39%) and less likely to use a stand along process modeling tool (34%). And Europeans are much less likely to use Visio (13%). We suspect the latter reflects the bad press that Microsoft has gotten in Europe, coupled with the popularity of ARIS in Europe. The North American results are harder to explain. Perhaps we have drawn a wider cross-section of practitioners from North America, and have more sophisticated (or experienced) business process respondents from Europe and elsewhere?
Microsoft Visio is popular because it is widely available and, effectively, free to those who work for organizations that have a Microsoft Office license. Similarly, most stand alone modeling tools sell for something in the range of $3,000 to $10,000 while most BPMS suites sell for $50,000 to $150,000 – although some BPMS vendors sell their modeling suites independent of their complete BPMS package. Even more important, most organizations are somewhere between a CMMI level 2 organization and a CMMI level 3 organization. (See Appendix I if this terminology is unfamiliar.) This suggests that the main focus at these organizations is in redesigning and improving major, core processes within specific divisions and not in developing enterprise-wide systems to manage the execution of major processes. Of course BPMS tools can be used for small scale process redesign – and many BPMS applications have been built for just such processes – but most people think of BPMS as more appropriate for more mature organizations that already have good process management and measurement systems in place. In other words, most think of BPMS applications as most appropriate for CMMI Level 4 or 5 organizations.
This is by far the highest percent of sophisticated process modeling use we have encountered in one of our surveys. Given that all BPTrends surveys reflect respondents particularly interested in business process issues, this probably reflects a significant shift in the market toward more sophisticated process modeling tools.
What Modeling Tool Features Are Most Important?
43% 36% 44% 56% 30% 18% 13% 38% 10% 6% 0% 10% 20% 30% 40% 50% 60%
Support for a standard notation or modeling language
Ability to create simple models of processes Ability to create complex (nested) models of
processes
Ability to store models and process data in a repository
Ability to store information about roles, costs and other data associated with activities
Ability to do simulation Ability to print models Ability to post models on web so they can be
widely shared
Ability to move from the model to software code easily
Other, please specify
Copyright (c) 2011 Business Process Trends. www.bptrends.com 19
We asked respondents who used process modeling tools – again we are talking about 44% of the total number of respondents – to tell us what three features of a tool are most important to them. (See Figure 13.)
The feature considered by the majority (56%) as most important is the ability to store models and process data in a repository. The next two important features, considered so by similar numbers, are the ability to create complex (nested) models (44%) and support for a standard notation or modeling language (43%).
Two other features were essentially tied for 3rd place – the ability to post models on the web to be
widely shared (38%) and the ability to create simple models of processes (36%). Next in line is the ability to store information about roles, costs, and other associated date which was chosen by 30%. The ability to do simulations is important to only 18% which is consistent with our result that 72% don’t do simulation at all. The ability to print models is important to 13% and the ability to move easily from model to code to 10%. All “other” choices together amounted to only 6%.
Everyone agreed on the top three features. North Americans thought the ability to create complex models was more important than the use of a repository, but otherwise there were no significant differences based on geography, role or industry.
When you consider the unusually high number of respondents that indicate that they use repository-based modeling tools, it’s not surprising that respondents say a repository is important. Once again, this suggests a more sophisticated audience than the one we surveyed two years ago. Clearly organizations have been doing modeling and want to be able to save what they have discovered. In a similar way, the use of nested models suggests that more complex processes are being modeled, and the need for a standard notation suggests that modelers are at least considering the possibility that they will want to move their models to other tools for subsequent development. All this suggests that respondents and companies are more sophisticated about modeling than they were two years ago.
Process Modeling Notations and Standards
72% 18% 6% 4% 33% 0% 10% 20% 30% 40% 50% 60% 70% 80% BPMN UML BPEL XPDL Other, please specify
Copyright (c) 2011 Business Process Trends. www.bptrends.com 20
As noted above, support for a process standard notation or modeling language is the third choice for most important feature of process modeling tools, chosen by 43%. We asked respondents which modeling notations or standards they are using. They could choose more than one. (See Figure 14.) The vast majority (72%) are using BPMN. The next highest percentage, 33%, chose “other”. The most stated notation here was Event-Driven Process Chain or EPC. It was listed by 40 (8%) respondents, less than UML, listed by 18% but more that BPEL (6%) and XPDL (4%).
There were no regional or role variations in the responses to this question.
Clearly the only process modeling standard that is really important to our respondents is the OMG’s BPMN standard. (BPMN originally stood for Business Process Modeling Notation, but in the recent release 2.0, the OMG retitled it Business Process Model and Notation) At the same time the OMG is making the standard more technical and much more IT oriented, and it will be interesting to see if business and process practitioners continue to consider it important as release 2.0 becomes better known. Meanwhile, however, BPMN is not only a notation, but, it is rigorously used as a language that can be used to generate code. For organizations that are doing process modeling today and want to keep the option open for moving to BPMS applications in the future, BPMN is the best way to maintain their flexibility.
If we look at standards suggested by respondents that chose ‘Other,” the only one that stands out is ARIS/EPC (Event-driven Process Chain).
Copyright (c) 2011 Business Process Trends. www.bptrends.com 21
BPMS
As we have already suggested, business process modeling is used for a wide variety of purposes, from documentation and communication to redesign. In some cases, companies model processes in order to meet regulatory requirements. Groups undertaking Lean and Six Sigma projects often use relatively simple models to understand very narrowly defined sets of activities. Increasingly, Lean practitioners model value streams to develop a broad understanding of the way processes flow from customer requests to the delivery of products or services to the customer. Business analysts typically model processes in order to develop specifications that can guide software development or improvement efforts.
Business Process Management Software (BPMS) is a specific class of software that has evolved rapidly since about 2003. In the years immediately after 2003, a wide variety of vendors began to offer BPMS products. Some emphasized their ability to link existing software applications together, or to make those (mostly ERP) applications more flexible. Others emphasized their ability to provide good human interfaces for labor intensive processes, or to support the use of business rules in cases where decisions were important. Still others emphasize their ability to monitor process events and provide support for managerial decisions to correct processes that moved off target. Most large organizations began to experiment with these tools, but quickly realized that (1) they would need tools that did all of these things, and (2) the tools’ capabilities would need to be tightly integrated and have good interfaces if business managers were to use them effectively.
One key to understanding BPMS products, whether they are used by IT developers or by business process managers, is that they rely on a process model (and, to a lesser degree, on associated business rules). Anything that makes the average business manager more comfortable with the representation of a process by means of a process flow diagram makes it easier to sell that business manager on the value of a BPMS tool.
If one defines the business process market broadly, and includes all those who are interested in Lean and Six Sigma as well as those interested in process redesign and business analysis and architecture, then those interested in the use of BPMS products are clearly a minority. In fact, however, the interest in the possibility of BPMS automation has done a lot to excite the process market in the past decade, and will do more in the next. Moreover, the BPMS vendors have played a particularly interesting role in the process modeling arena in the last decade. First, in conjunction with the development of a BPMS standard, the Business Process Management Initiative (BPMI) developed a new process modeling notation – the Business Process Modeling Notation (BPMN) which has become quite popular. (BPMI later merged with the OMG and BPMN is now an OMG standard.) During the same period, the BPMS vendors proceeded to acquire many of the popular process modeling tool vendors. They bought the process modeling products to provide themselves with better process interfaces to their tools, but had the unintended effect of giving lots of new modeling vendors a chance to emerge.
How Extensively is BPMS Being Used?
We asked several questions to determine how many respondents were using BPMS. Perhaps the most direct question was: If you are currently modeling to create a BPMS application…. In this case, 313 respondents answered the question which means that 56% of the respondents are doing some kind of BPMS development.
Copyright (c) 2011 Business Process Trends. www.bptrends.com 22
Combining BPMS Suites and Process Modeling Tools
23%
36%
49%
0% 10% 20% 30% 40% 50% 60% Use process modeler
from BPMS, but don’t do BPMS
Use process modeler from BPMS and then proceed to create BPMS
applications Use a process modeling
tool independent of any BPMS suite, so we can
use multiple BPMS products
Figure 15. How do you use a process modeling tool and a BPMS suite together?
Some companies use both a process modeling and a BPMS suite together. For those who do we asked how they combined the two. The results are shown in Figure 15. Two hundred and thirty-four or 42% of respondents answered this question. About half (49%) reported using the modeling tool and suite independently so they can use multiple BPMS products. Thirty-six percent (36%) use the BPMS process modeler, and then create BPMS applications. Twenty-three percent use the process modeler from the BPMS, but don’t do BPMS.
Keep in mind that some vendors, like IBM, have been making their process modeling tool available for free or for a very modest fee. This encourages modelers to use the IBM product, and may, eventually, lead to BPMS sales. In the meantime, however, there are probably lots of modelers using IBM modeling tools who have no interest in proceeding to the development of a BPMS application. Once again, this result is valid for all regions, roles and industries. BPMS use is clearly growing, but just as clearly it does not dominate the BPM market. Companies are still more focused on defining and improving processes. If they are automating processes they are as likely to be using conventional tools as BPMS products.
Copyright (c) 2011 Business Process Trends. www.bptrends.com 23
Does the Same Team do Business Process Modeling and Application Development?
No, 201, 64%
Yes, 113, 36%
Figure 16. Does the same team do business process modeling and application development?
Business process modeling requires cooperation and coordination between business planners and IT developers. We wanted to know how users of BPMS applications manage these two functions, i.e. does the same team do both the business process modeling and the application development or does one team define the business process model while another IT development team does the BPMS specifications. The results are shown in Figure 16. Among the 314 who answered this question, two-thirds (64%) said that a business/process team did the process analysis and a different (IT) team did the actual BPMS development. We can’t emphasize the importance of this question and the responses enough! We have had discussions with BPMS vendors over the course of the past few years and find that many assume that process practitioners will learn to use BPMS products and then do process redesign and, later, application development in BPMS tools. This may happen someday, but it is not what is happening today.
Currently, process analysis, modeling and redesign is still being done by teams that are not involved in BPMS development. The teams may include an IT (BPMS) developer, but they are primarily made up of business managers, business practitioners or business analysts. This business team decides how the business process works, and if it should be changed. It is only after this team has defined the process that a separate team begins BPMS development. This, in turn, means that BPMS development will be gated, in many cases, by the number of people doing process analysis and design, who are not BPMS developers. Those people may be doing Six Sigma, Lean or Business Process Redesign and may or may not intend their work to lead to BPMS development.
This result is true for most regions, roles and industries. Business Analysts, and Business Managers are slightly more likely to say they use separate teams (73% and 69%). Respondents from South America are less likely to say that two separate teams do the work (47%) and more likely to say process modeling and IT development are done by the same team (53%). Recall that South American respondents are twice as likely to be IT Managers or Developers, on average (12% vs. 6%), though even 12% seems insufficient to explain this difference. Two industries indicated significantly more interest in UML than average – Finance and Government and the Military. Finance has always been represented by the largest body of respondents, and is usually thought of as closer to the cutting edge in BPMS than most other industries. Government is a close second. In both cases they are slightly more likely to use the same teams for both process analysis and BPMS. We suspect that, on average they are more mature in their approach to process work.
Copyright (c) 2011 Business Process Trends. www.bptrends.com 24
Roadblocks to BPMS Use
60% 11% 18% 15% 22% 0% 10% 20% 30% 40% 50% 60% 70%Not ready to implement BPMS Too difficult to
implement Too expensive to
implement Don’t think BPMS tools
are mature enough Other, please specify
Figure 17. If you have modeled business processes, why have you not implemented a BPMS?
The last question is about barriers to the use of BPMS. We asked why, if they have modeled business processes, they have not yet implemented BPMS. The results are in Figure 17. Respondents could choose more than one reason their company isn’t using BPMS. Sixty percent said their company is not ready to implement BPMS. Eighteen percent think BPMS is too expensive to implement, 15% don’t think the BPMS tools are mature enough, and 11% think they are too difficult. Among the 22% who specified “other” reasons, most were along the lines of the company not being ready to take on BPMS. We think the 6o%+ who don’t think their company is ready to do
BPMS is in line with our findings from our BPM Marketing surveys – specifically, that only about 5% of companies achieve level 5 on the Capability Maturity Model Index, although many more have pushed through to level 3 in the past 5 years.
We suggested earlier that about 56% of those taking this survey were using BPMS products. Inversely, about 44% are not using BPMS in any form. We asked those who were not using BPMS today to suggest why. The largest group – 60% of those who are not using BPMS – simply said they were not ready for BPMS. As we have already suggested, most organizations are between CMMI levels 2 and 3. They have yet to figure out or redesign most of their business processes, and don’t yet have systematic process measurement or management systems in place. If the company were to use BPMS, it would only be as a way to develop software, and not as a way to automate the actual management of processes. Thus, we read the “Not ready to implement BPMS” as simply an assertion that the company isn’t ready to invest in any kind of advanced process management effort. This result is true for all geographical areas and for most roles and most industries. If we focus only on business managers, the percent saying they are not ready for BPMS rises to 71%. If we look at all industries, save computing and consulting, the average who are not ready to implement BPMS is 69%.
We are actually surprised that so many of the respondents indicated that they were doing BPMS. Clearly most are focused on using BPMS tools for software development and not for the ongoing management of their business processes. With that in mind, as we look at the other responses to the
Copyright (c) 2011 Business Process Trends. www.bptrends.com 25
question, we see that 15% think the BPMS tools too immature, 18% think BPMS would be too expensive, and 11% think it would be too difficult. Without knowing the nature of the process problem faced at a specific organization, it would be hard to determine if these views were accurate – but it is easy to imagine process problems that would justify such opinions.
Copyright (c) 2011 Business Process Trends. www.bptrends.com 26
Summary
With the important qualification that this survey was completed by an audience that had self-selected itself as being interested in business process change, 93% of the respondents said they or their organizations were doing business process modeling. Clearly, process modeling, in its various forms, is the major technology or tool used by process practitioners and business analysts as they seek to define the way their organizations do work.
We have noted minor differences in responses where they occurred, based on geographical location, the role of the respondent, and the industry in which the respondent work. Compared to previous surveys, we were impressed that there are fewer differences, and more consistency. The difference between practices in North America and Europe, for example, is nearly non-existent. Similarly, the difference between business managers and those who identify themselves as IT managers is not unusually significant. Even leading industries like Finance and Government are not doing things significantly different from those in other industries. For better or worse, there seems to be a broad agreement in the process market about what should be done and why it is important. This marks a significant difference in the responses to our first survey in 2003.
Visio is still the most widely used process modeling tool, but, compared with even two years ago, the number of practitioners using more sophisticated modeling environments that allow users to save and reuse information about their processes, has grown rapidly.
Moreover, the great majority of today’s practitioners prefer the Object Management Group’s BPMN standard – suggesting that a common notation is beginning to permeate the business process community.
If one thinks of software markets as Geoffrey Moore did when he described his Technology Lifecycle Model (See Appendix I if you need a quick refresher on Moore’s model.) then Process Modeling – and more important, repository-based process modeling has definitely crossed Moore’s chasm, and is being used by the Majority of companies today.
We might get a different story if we asked – Has process modeling become a popular business language in the same sense that accounting statements are? More and more business managers rely on some kind of process model to represent the work their units are trying to accomplish. And, significantly, the latest tools make models available online, so they can be posted and widely accessed by business people throughout an organization. Still, today, process modeling is primarily a tool used by process practitioners and process-savvy managers. One sees a growing number of articles in business management journals that rely on simple process flow models, but one would have to be overly optimistic to suggest that most business managers feel comfortable thinking of the activities they manage in terms of process flows.
Process work, and the tools process analysts use have achieved greater prominence in the past few years. Process practitioners have made major progress, shifting from graphical tools like Visio to real process modeling tools with repositories that store process data. We fully expect this trend to continue and we expect that leading organizations will be increasingly willing to describe their processes in terms of process models.
Equally, it is clear that most business process modeling is being used to define, understand or redesign processes. Only 36% of our respondents say they use process modeling as a prelude to developing BPMS applications. More important, 64% of our respondents suggest that the team that does the process modeling is different from the team that works on the development of BPMS applications. Further, they suggest that business managers and process practitioners are usually modeling processes in conjunction with an effort to understand or communicate about their
Copyright (c) 2011 Business Process Trends. www.bptrends.com 27
processes, or to redesign and improve their processes, and not, primarily, to automate their processes.
We have suggested in the past that BPMS tools are primarily being undertaken by two groups: (1) IT organizations using BPMS products as a better way of building software applications (2) Very mature organizations (CMMI level 4 or 5) who are exploring the possibilities of actually
automating the day-to-day management of business processes.
The latter are few and far between – most organizations are between CMMI level 2 and 3 – and the former are closer, in many cases to ERP efforts than to process improvement efforts.
We believe that the expansion of the BPMS market will depend on organizations becoming more mature in the way they think about business processes. Thus, to encourage BPMS use, BPMS vendors must first encourage companies to redesign their existing processes and to develop integrated business process architectures. This kind of basic process development will lead to a growing demand for BPMS tools that can help managers improve their control over their processes. Smart BPMS vendors recognize this and have separated their process modeling environments from their BPMS package and sell the modeling environments separately, thereby encouraging companies to become familiar with their approach to modeling and to lay the groundwork for moving toward managing the runtime execution of those same processes.
Ironically, if you review the process modeling vendor market, you will see that many of the leading stand-alone process modeling tools were acquired by BPMS vendors who wanted to provide their BPMS customers with friendlier and more comprehensive interfaces. Unfortunately, as the BPMS vendors incorporated the modeling tools, and then required modelers to buy the entire package to get the tool, they forced organizations that just wanted modeling tools to seek other options. Thus, most of the leading process modeling tools of a few years back have disappeared, and they have been replaced by new process modeling tools offered by new vendors. The few BPMS vendors that acquired a popular modeling tool and continued to sell the modeling tool independent of the BPMS package, have done quite well – enjoying continued sales to those who wish to model, and, perhaps, even gaining an edge in their BPMS sales.
In most software areas, this would suggest that the technology is becoming more mature. In the case of BPMS, however, it’s dangerous to draw that conclusion. First, the consolidation is not primarily a matter of one BPMS vendor buying another – although that has occurred. Instead, we have witnessed a rapidly evolving definition of the features that a comprehensive BPMS product ought to include, and vendors have been buying other vendors to acquire new technology. Thus, a workflow vendor buys a Business Rules vendor, and then a Business Intelligence vendor, or a Process Modeling vendor, etc. This does not result in more mature products; instead it results in more complex products that the vendors must then struggle to integrate. Meanwhile, as some vendors are removed from the market, others enter to take their place.
There is clearly a need for a good, basic process modeling tool. As the BPMS vendors have bought popular process modeling tools and incorporated them into their complex BPMS suites, other, new process modeling vendors have entered the market and grown in popularity. Many of these newer entries have specific functionality that is of interest to niche markets.
In our opinion, the BPMS market has not yet crossed Moore’s chasm and been accepted by the majority of business organizations. The interest in process work has become a majority concern, as have process modeling tools. A growing number of companies are experimenting with BPMS products. But the companies using BPMS are, in fact, split in two:
Copyright (c) 2011 Business Process Trends. www.bptrends.com 28
In other cases, companies have really embraced the idea that BPMS should support the business managers who are actually responsible for processes on a day-to-day basis.
The cases in which IT has experimented with BPMS are far more numerous, and they are less likely to lead to self-sustaining growth. (IT people like to try new approaches.) The real take-off in the BPMS market will only occur when business managers decide that they need BPMS applications to manage the major processes of their organizations. Many organizations have been badly burned by ERP installations that cost much more than planned and have been much more rigid than promised. These same organizations have a need for the more flexible approach, which BPMS represents, but fear that they will, once again, spend too much on IT projects that deliver too little value.
The BPMS market will really take off when we begin to read of major BPMS applications that empower business managers and deliver significant value. This will happen when we read, for example, of a worldwide supply chain that is fully modeled in BPMS, returns hourly information to the supply chain executives, and can be adjusted within hours by the supply chain execs, as their needs change. We are confident that this type of BPMS application is coming, but there have been few if any given much publicity to date.
Meantime, if this study emphasizes anything it is this: The interest in process work is growing steadily. More process practitioners are using process modeling tools today than ever before. A company needs to walk before it can run: Companies need to model and improve their processes, and become convinced of the value that process improvement can deliver, before they will be ready to invest in expensive BPMS tools. Smart BPMS vendors need to work to increase the numbers of organizations that use process modeling, they need to encourage organizations to develop process architectures and create good process measurement and management systems as a prelude for automated process management. And, of course, they need to work with leading organizations that are already heavily committed to process work, to create a few killer applications that will convince the majority of organizations that they need to adopt this new technology or be placed at a significant competitive disadvantage.
Copyright (c) 2011 Business Process Trends. www.bptrends.com 29
Appendices
Appendix I. CMMI Maturity Levels
The concept of Process Maturity Levels was developed at the Software Engineering Institute (SEI) at Carnegie Mellon University in the Nineties, based on quality work originally undertaken by Watts Humphrey. Originally developed to support the analysis of software process maturity (CMM), the latest version, the Capability Maturity Model Integrated (CMMI) has been generalized so that it can be applied to any of a wide variety of processes in diverse organizations. (See Figure 18.)
Level 1. No Organized Processes Level 2. Some Organized Processes Level 3. Most Processes Organized Level 4. Processes Are Managed Level 5. Processes Contentiously Improved A Culture of Heros Processes are Improved at the Work Group or Departmental Level Processes are Organized and Redesigned at the Enterprise Level Processes are Measured and Managed Systematically Processes Teams Contentiously Improve Processes
Figure 18. An Overview of the basic CMMI maturity levels
Software organizations often pay SEI certified evaluators to do a formal evaluation to determine where their organizations are on the CMMI scale. Many other companies do informal evaluations, based on the broad concepts inherent in the CMMI “stair step diagram.” What follows is an informal description of the CMMI process maturity model.
Level 1. No Organized Processes
Level 1 organizations don’t rely on processes. Things get done according to plans made on the fly. CMMI folks often refer to them as organizations based on heroes. Things get done because someone makes a heroic effort and gets the report out at the last minute. If someone asks how long something will take, or what resources will be needed, those answering the question are just making a guess – they don’t have a systematic procedure or the data needed to provide accurate answers to these questions.
Level 2. Some Organized Processes
When organizations first begin to embrace processes, they begin by trying to define their core or most commonly used processes. At this stage, they don’t conceptualize the entire company as a set of processes, all interrelated, but focus only on a specific process as it functions within some more or less arbitrary set of boundaries. Level 2 Organizations have several of their major processes defined.
Level 3. Most Processes Organized
Level 3 organizations have most of their processes defined. They not only have models of their core business processes, but understand how management and support processes work to support those processes. Most Level 3 organizations have a process architecture that shows how all of the
Copyright (c) 2011 Business Process Trends. www.bptrends.com 30
organizations in the company function. Thus, if there is a problem, it’s easy to quickly identify the processes that could be causing the problem and the implications for any suggested change.
Level 4. Processes Are Managed
Level 4 organizations have gone well beyond simply defining all their processes. These organizations have process managers who gather data on process performance and customer satisfaction and use this data to make decisions about how to optimize the processes they manage.
Level 5. Processes Are Continuously Improved
Level 5 organizations have built processes right into the essence of the organization. They know their processes and manage their processes. Moreover, they have systems in place to constantly improve their processes whenever possible.
Most organizations are not, of course, right at one level or another. Studies have suggested that most organizations in the US are somewhere between Level 2 and Level 3, trying to expand the processes they have modeled and understand into a complete process architecture. Similarly, a smaller group of companies are between Levels 3 and 4. They are working to establish process management and measurement systems throughout the company.
In large organizations, it is common to find that one division or group will be at a different level of maturity than other groups or divisions within the same organization.