Performance Analysis and Optimization of In-situ Integration of
Simulation with Data Analysis: Zipping Applications Up
∗
Yuankun Fu, Feng Li
Purdue University, IndianapolisIndianapolis, Indiana {fu121,li2251}@purdue.edu
Fengguang Song
Indiana University-Purdue University Indianapolis, Indiana
Zizhong Chen
University of California, Riverside Riverside, California
ABSTRACT
This paper targets an important class of applications that requires combining HPC simulations with data analysis for online or real-time scientific discovery. We use the state-of-the-art parallel-IO and data-staging libraries to build simulation-time data analysis workflows, and conduct performance analysis with real-world ap-plications of computationalfluid dynamics (CFD) simulations and molecular dynamics (MD) simulations. Driven by in-depth perfor-mance inefficiency analysis, we design an end-to-end application-level approach to eliminating the interlocks and synchronizations existent in the present methods. Our new approach employs both task parallelism and pipeline parallelism to reduce synchronizations effectively. In addition, we design a fully asynchronous,fine-grain, and pipelining runtime system, which is named Zipper. Zipper is a multi-threaded distributed runtime system and executes in a layer below the simulation and analysis applications. To further reduce the simulation application’s stall time and enhance the data transfer performance, we design a concurrent data transfer optimization that uses both HPC network and parallelfile system for improved bandwidth. The scalability of the Zipper system has been verified by a performance model and various empirical large scale experiments. The experimental results on an Intel multicore cluster as well as a Knight Landing HPC system demonstrate that the Zipper based approach can outperform the fastest state-of-the-art I/O transport library by up to 220% using 13,056 processor cores.
KEYWORDS
High performance computing, performance analysis and optimiza-tion, in-situ/in-transit workflows
1 INTRODUCTION
As high end supercomputing systems are evolving from petas-cale to exaspetas-cale, data generated from extreme-spetas-cale modeling and simulation applications reach a scale of hundreds of terabytes or ∗This material is based upon research supported by the Purdue Research Foundation and by the NSF Grant# 1522554.⋄Corresponding author: Fengguang Song. Permission to make digital or hard copies of all or part of this work for personal or classroom use is granted without fee provided that copies are not made or distributed for profit or commercial advantage and that copies bear this notice and the full citation on thefirst page. Copyrights for components of this work owned by others than ACM must be honored. Abstracting with credit is permitted. To copy otherwise, or republish, to post on servers or to redistribute to lists, requires prior specific permission and/or a fee. Request permissions from [email protected].
HPDC ’18, June 11–15, 2018, Tempe, AZ, USA © 2018 Association for Computing Machinery. ACM ISBN 978-1-4503-5785-2/18/06...$15.00 https://doi.org/10.1145/3208040.3208049
even petabytes. The grand challenges confronted by today’s scien-tific computing community hence include not only computation-intensive simulations, but also data-computation-intensive analyses that need to process the huge amount of computed results generated from the simulations [7, 31, 44]. Today, it is even challenging to answer certain basic questions such as: Did any unusual phenomena hap-pen or not during the simulation? When and where did they occur? With the new advanced big data analytics techniques, it is more and more popular and appealing to combine modeling/simulation with big data analysis to create a virtuous cycle that amplifies their collective effects [16, 35, 37].
However, it is exceedingly challenging to achieve high perfor-mance for an integrated workflow with both simulation and data analysis applications particularly at extreme scales. There exist workflow solutions that target high productivity. Workflow middle-ware such as Kepler [28] and Pegasus [10] has been widely used in different scientific domains. They provide orchestrating, executing, and monitoringcoarse-grain stepsin a workflow. Each step runs an application program or web service [17]. Also, those participant steps are oftenloosely coupledsuch that the resultant workflows have higher latencies (i.e., milliseconds or much more) than the MPI-based HPC applications (i.e., microseconds).
In this paper, we seek to achieve the microsecond-level HPC performance on scientific workflows. Achieving high performance workflows requires we solve the following issues.First, what could be the minimum end-to-end time-to-solution and how can we achieve it?Second, simulation and data analysis applications work as an interactive producer-consumer system, then how can we re-duce the simulation stall time if the analysis is slow?Third, how can we reduce the I/O time between simulation and analysis appli-cations? The third issue of I/O bottleneck has been well recognized and studied by many researchers. For instance, in-situ/in-transit approaches, data-staging approaches, and a number of high-level I/O libraries have been developed to reduce the I/O bottleneck. Sec-tion 2 will briefly introduce a few state-of-the-art I/O transport libraries.
Instead of focusing on the I/O bottleneck only, we bring on an end-to-end approach to optimizing a scientific workflow’s time-to-solution, which is comprised of simulation time, data analysis time, and I/O time. We use the latest high-level I/O libraries such as MPI-IO [45], ADIOS [27], DataSpaces [11], DIMES [50], Decaf [13], and Flexpath [9] to “glue”standalonesimulation and analysis appli-cations in a workflow. We have developed seven different workflow implementations to combine a lattice Boltzmann method [20] based computationalfluid dynamics (CFD) simulation with a turbulence
flow analysis application. Each workflow implementation employs a different I/O transport method (in total, seven methods). From the
Simulation Application
Analysis Application
Zipper Runtime System
High-level I/O and Communication Lib Parallel File System and Network
buffering, pipelining, scheduling concurrent message&file data transfers
Combined Execution of Simulation with Analysis
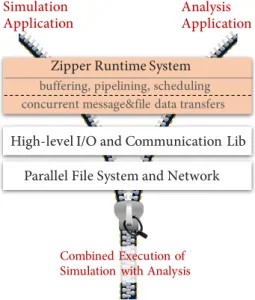
Figure 1:The Zipper runtime system.
experimental results, wefind that these workflows’ end-to-end time is significantly larger than the essential simulation time or analysis time (shown in Section 3). Detailed performance analysis then iden-tifies a set of performance inefficiencies such as synchronization with centralized servers, coarse-grain critical sections, interlock between applications, barriers, network bandwidth contention, and application stalls.
In order to solve the performance inefficiencies, we devise a new approach, which usesfine-grain data blocks, task parallelism, and pipelining parallelism to tightly interleave simulation and analysis applications. The new approach is driven by data availability, and has no artifactual data dependency (e.g., barriers) between tasks. A runtime system calledZipperis designed and developed to enable the new end-to-end approach, as shown in Figure 1. Zipper is lo-cated below the application layer, and above the high-level I/O and communication libraries. The Zipper runtime system itself has two strata: 1) The upper stratum provides the functions of buffering data in memory, pipelining data blocks from simulation to analy-sis applications, and scheduling data transfer operations and data analysis tasks; 2) The lower stratum is an optimization layer, which can transport computed results by two concurrent channels: low-latency HPC network andfile-based parallelfile system. Section 4 will introduce the Zipper runtime system. In addition to the par-allel framework implementation, we also build an analysis model to evaluate the Zipper system. With this performance model, we are able to estimate a combined workflows’s time-to-solution, and provide an insight into which component should be improved to achieve the fastest end-to-end time.
We conduct experiments with synthetic applications, a computa-tionalfluid dynamics (CFD) application, and a LAMMPS application on two supercomputing systems. The CFD application is coupled with an online statistical turbulence analysis, and the LAMMPS application is coupled with the Mean-Squared Displacement (MSD) data analysis. The paper shows three types of experiment: The
first type of experiment is used to validate the analytical perfor-mance model; the second type is used to show that the concurrent dual-channel data transfer optimization can reduce data transfer time as well as the simulation application stall time; and the third type validates the scalability of the Zipper system. Based on the experimental results, using Zipper can outperform the fastest state-of-the-art I/O transport library by up to 2.2 times on 13,056 cores. The performance benefits have been studied and analyzed by col-lecting and comparing different workflow implementations’ traces. To the best of our knowledge, this work makes the following contributions:
• Detailed performance analysis and comparison between an
arrange of state-of-the-art I/O transport libraries designed for implementing high performance scientific workflows.
• An end-to-end approach to combining the pipelining
paral-lelism and the asynchronous task paralparal-lelism, at afine-grain task level, to create the new Zipper runtime system for min-imized workflow end-to-end time.
• Introducing the concurrent data transfer optimization to reduce I/O time and simulation stall time with in-depth per-formance analysis.
• Application of the Zipper runtime system to large-scale CFD
and molecular dynamics. The experimental results demon-strate Zipper provides better performance than the existing work. Zipper’s end-to-end time has also been verified by a performance model and detailed traces.
In the remainder of the paper, the following section introduces different state-of-the-art I/O transport libraries. Section 3 shows performance analysis of scientific workflows using the I/O transport libraries. Section 4 introduces the Zipper runtime system, its parallel implementation, and an analytical performance model. Section 5 compares the existing work with our work. Finally, Sections 6 and 7 present the experimental results and summarize the paper.
2 BACKGROUND OF EXISTING I/O
TRANSPORT LIBRARIES
Integrating simulation and data analysis applications into a
work-flow requires efficient data transport libraries. In this section, we briefly introduce six high performance software packages that we deploy to combine simulation with data analysis applications: 1) MPI-IO, 2) DataSpaces, 3) DIMES, 4) Flexpath, 5) ADIOS, and 6) Decaf.
(1) MPI-IO is a parallelfile I/O interface that allows multiple processes of an MPI program to write or read parts of a shared commonfile [19, 45]. It can map I/O reads and writes to message-passing sends and receives to improve the I/O performance. Unlike the followingfive software packages, MPI-IO is a low-level I/O library that can support each in-dividual MPI application’sfile I/O. Also, coupling different applications with MPI-IO requires writing code to let a con-sumer application know when new data is available in a
file.
(2) DataSpaces offers an abstraction of virtual shared space that is distributed across a number of dedicated data servers [8, 11]. It can support data coupling at runtime. In DataSpaces, each participant application is launched by its ownmpirunor
apruncommand such that there are multiple failure domains. If one application fails, the other applications can still survive. DataSpaces providesputandgetfunctions that use RDMA to write/read data to/from the dedicated data servers. It also provides reader-writer locks to coordinate accesses to shared data among different applications.
(3) DIMES is another data staging library that is provided by the DataSpaces project [8, 50]. Similar to DataSpaces, it supports runtime data coupling, and has multiple failure domains. However, DIMES stores data in RDMA memory buffers lo-cated in the simulation application’s nodes directly. This way data staging becomes as fast as copying data to main mem-ory. Althoughdata-storageservers are not needed, DIMES requiresmetadataservers to manage where data are located and provide locking services to collaborating applications. (4) Flexpath implements a publisher/subscriber communication
mechanism to combine simulations with componentized data analyses [9, 14]. With Flexpath, different software com-ponents can be connected by event channels and source-to-sink event communications at runtime. Each publisher or subscriber is executed as an independent application by run-ningmpirunoraprun. Hence, Flexpath has multiple failure domains. To transfer data, a publisher uses an output epoch (i.e., open, write, close) to save data to its buffer. Later on, a subscriber sends to each of the event publishers a fetch message to request its desired data. Flexpath provides the ADIOS interface (see below) as its own interface.
(5) The Adaptable IO System (ADIOS) supports a range of I/O transport methods [1, 27]. It can be configured to make use of different data-staging libraries such as DataSpaces, DIMES, and Flexpath. In the paper, we call it the “ADIOS/name” trans-port method if we use ADIOS’s interface and use the specific I/O method ofname. Otherwise, we call it a “native” method for which we use the intrinsic I/O library directly.
(6) Decaf is a dataflow system for parallel communication of participant applications in workflows [13]. It can be regarded as a “coupling service”, which allows users to describe nodes and links as serial entities while Decaf takes care of their parallelism. It provides a simple put/get API that utilizes MPI, and can implement a workflow system by using a Python API. Different from the above DataSpaces, DIMES and Flexpath, Decaf creates a singleMPI_Comm_Worldfor all the partic-ipant applications. Data coupling between applications is defined during the compile time. Also, it requires existing MPI-based programs to replace their MPI_COMM_WORLD by the communicator provided by Decaf. Therefore, there is a single failure domain in Decaf workflows.
Next section will compare the performance differences between different workflows that use the above I/O transport libraries.
3 PERFORMANCE ANALYSIS OF
WORKFLOWS WITH STATE-OF-THE-ART
I/O LIBRARIES
We use the I/O transport libraries of MPI-IO, Flexpath, ADIOS DataSpaces, native DataSpaces, ADIOS DIMES, native DIMES, and Decaf to implement a scientific workflow. The workflow application
uses a Lattice Boltzmann method (LBM) based CFD simulation to generate steps of simulation data, which are read and processed by a coupled parallel n-th moment turbulence data analysis applica-tion [34, 39]. LBM is a numerical method to solve Navier-Stokes equations and simulate complexfluidflows. It considersfluid as a collection of particles, each of which has random motions [20].
Collisionandstreamingare two phases in each simulation time step.
Collisionhappens when each particle updates its own distribution
function using its local information, andstreaminghappens when a particle exchanges its local information with its neighbors.
We perform workflow experiments on theBridgessystem from the Pittsburgh Supercomputing Center.Bridgeshas 752 (regular) compute nodes, each of which has two Intel Haswell 3.3 GHz 14-core CPUs and 128GB memory (more detailed system information is provided in Section 6).
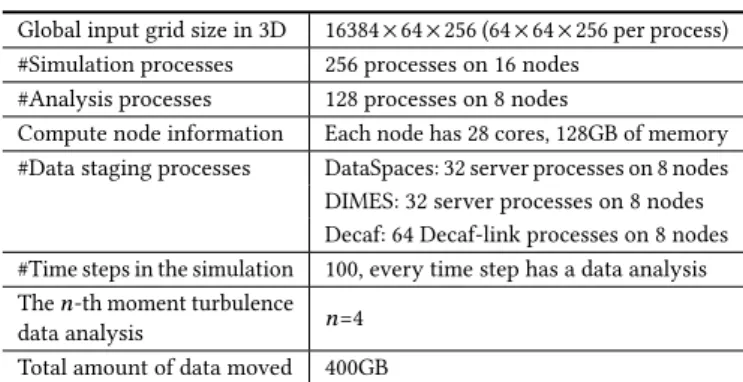
Figure 2 shows the various end-to-end time of the CFD workflow experiments using different I/O libraries. Table 1 also presents the experimental setup information of the workflow experiments. On
0 50 100 150 200 250 300 350 400 En d to End Tim e (se cond s) 176.9 157.2 281.6 96.1 83.4 140.9 104.9 39.2 48.4
Figure 2:Performance of the CFD workflow application using 7 different I/O transport libraries, in comparison with the simulation time and analysis time.
Table 1: Experimental setup of the CFD workflow experi-ments shown in Figure 2.
Global input grid size in 3D 16384×64×256 (64×64×256 per process) #Simulation processes 256 processes on 16 nodes
#Analysis processes 128 processes on 8 nodes
Compute node information Each node has 28 cores, 128GB of memory #Data staging processes DataSpaces: 32 server processes on 8 nodes DIMES: 32 server processes on 8 nodes Decaf: 64 Decaf-link processes on 8 nodes #Time steps in the simulation 100, every time step has a data analysis Then-th moment turbulence
data analysis n=4 Total amount of data moved 400GB
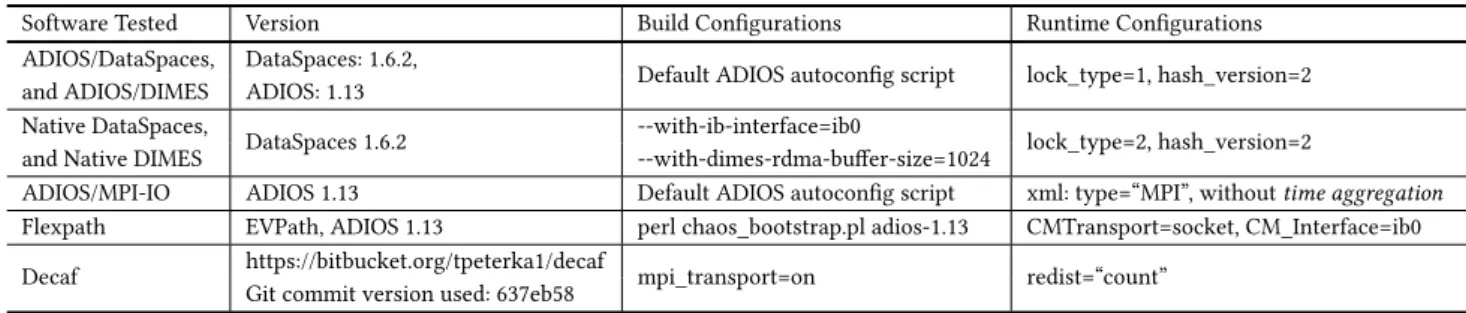
Table 2: Configurations of different I/O transport libraries that have been used to generate Figure 2. Software Tested Version Build Configurations Runtime Configurations ADIOS/DataSpaces, DataSpaces: 1.6.2, Default ADIOS autoconfig script lock_type=1, hash_version=2 and ADIOS/DIMES ADIOS: 1.13
Native DataSpaces, DataSpaces 1.6.2 --with-ib-interface=ib0 lock_type=2, hash_version=2 and Native DIMES --with-dimes-rdma-buffer-size=1024
ADIOS/MPI-IO ADIOS 1.13 Default ADIOS autoconfig script xml: type=“MPI”, withouttime aggregation
Flexpath EVPath, ADIOS 1.13 perl chaos_bootstrap.pl adios-1.13 CMTransport=socket, CM_Interface=ib0 Decaf https://bitbucket.org/tpeterka1/decaf mpi_transport=on redist=“count”
Git commit version used: 637eb58
Bridges, we build all the software and libraries with gcc 4.8.5 and the Intel MPI library (2017 Update 3). Table 2 particularly lists the software versions and configuration options we use to install and build the tested software systems. Furthermore, we perform large scale experiments using the MPI-IO, Flexpath and Decaf libraries on 13,056 cores as shown in Section 6.3 (see Figures 16 and 18).
Ourfirst attempt tried to use four I/O transport libraries (i.e., ADIOS/{DataSpaces, DIMES, MPI-IO, Flexpath}). Among all the transport methods, MPI-IO performs the worst: it gives the longest and most variational end-to-end time. This is anticipated because MPI-IO writes data to afile system, which is also shared by many other users. However, MPI-IO in the fastest case can still achieve a performance that is comparable to the in-memory methods (e.g., ADIOS/DataSpaces), which had surprised us.
To investigate the problem and enhance the performance of ADIOS/DataSpaces, we turn to thenativeDataSpaces and DIMES libraries. This brings on a significant speedup of 1.3 times for DataS-paces, and a speedup of 1.5 times for DIMES. The reason for the speedup is as follows. ADIOS introduces a uniform interface for all transport methods. However, to achieve this goal, low-level details in certain transport methods have to be hidden in this common interface. For instance, native DataSpaces provides a customized light-weight lock strategy to enforce synchronizations among ap-plications (e.g., dspaces_lock_on_write). The native lock strategy is not exposed by the ADIOS interface. Therefore, we use multiple native DataSpaces locks to implement bothnativeDataSpaces and DIMES workflow experiments.
As shown in Figure 2, among all the libraries, Decaf achieves the best end-to-end time of 83.4s, followed by ADIOS/Flexpath of 96.1s. All of our workflow implementations have been designed to overlap simulation with analysis time steps to obtain the best performance. For instance, Figure 3 illustrates how our workflow implementation can hide the analysis time when the simulation time is greater than the analysis time. A similarfigure can also be drawn when the analysis time is greater than the simulation time (omitted here). By using such a software design, either the simulation time or the analysis time can be totally hidden from the workflow execution time.
However, the experimental results in Figures 2 show that the workflow execution time is still much larger than the simulation time or analysis time. To investigate why and where the perfor-mance is lost, we use TAU [41] and Intel Trace Analyzer and Col-lector (ITAC [23]) to collect traces of the experiments. Due to the
Step 1 Step 2 Step 3 Step 4 Step 5 Simulation
Analysis
…
… Step n
Figure 3:Our workflow implementations can overlap simulation and analysis using I/O transport libraries. In this example, we as-sume data analysis is faster than simulation for each time step.
space limit, here we only show the performance analysis results for the three fastest methods (i.e., the native DIMES, Flexpath, and Decaf) to reveal major performance inefficiencies.
Figure 4 shows the trace for the CFD workflow implementation that uses the native DIMES library. In this workflow, simulation needs to synchronize between metadata servers and computing processes, and then inserts results into the DIMES buffer. Notice that there is a lengthy “lock” period, when the simulation is performing data insertions. We use the type-2 customized lock of DIMES, which is a collective lock and enforces strict synchronization between producers and consumers. To better overlap simulation with data analysis, and efficiently utilize the RDMA memory in DIMES, our DIMES workflow uses multiple locks.
The DIMES implementation is presented as follows: we use
(step%num_slots)as the lock name so that we keep reusing a
circu-lar queue of multiple locks with afixed size ofnum_slots, where stepis the time step index of the CFD simulation, andnum_slotsis
the number of slots the CFD simulation can use to buffer its output data in a FIFO manner. When the analysis application is slower, the simulation application will be stalled in order to make sure the previous data are not overwritten. This scenario is shown in Figure 4 where the application stall time is almost equal to one step of simulation time. As a result, the end-to-end workflow time nearly doubles.1
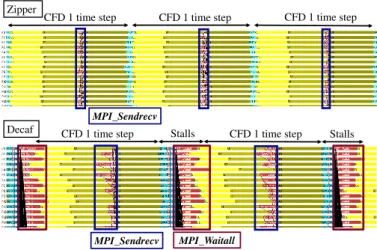
Next, we present the TAU trace for the Flexpath-based workflow implementation in Figure 5. In thefigure, we display a snapshot of length of three seconds for two different cases: 1) running sim-ulation alone, and 2) running the Flexpath workflow. The orange stripes represent the time to execute the MPI_Sendrecv function, which performs the inter-process communication in the streaming phase of the LBM simulation. We can see that after adding the 1Workflow implementations with DIMES can be further optimized by using an ad-ditional thread in the consumer application to fetch newer version of data while the main thread is analyzing the data of previous time steps.
lock_on_write CFD 1 step CFD 1 step ST CL UD MPI_Barrier PUT lock_on_write MPI_Barrier unlock_on_write
Figure 4:A trace of native DIMES with a snapshot of 2 seconds. CFD-only
Flexpath
1 step 1 step 1 step 1 step 1 step 1 step 1 step
CFD 1 step CFD 1 step CFD 1 step CFD 1 step
MPI_Sendrecv MPI_Sendrecv
Figure 5:Comparison between running CFD simulations only and running Flexpath based workflows. Thisfigure shows a snapshot of 3 seconds.
Flexpath data staging, the MPI_Sendrecv time in the LBM simu-lation takes much longer, which results in increased end-to-end time. Because both LBM’s streaming operation and Flexpath’s event channel involve intensive communications, Flexpath’s data-staging operations will compete with the simulation’s MPI communication. In particular, when staging a large slab of simulation data (e.g., 16 MB per time step per process in this workflow experiment), the chances to have communication interferences are much higher.
Finally, we compare the fastest workflow implementation that uses the Decaf method (whose performance is shown in Figure 2) to the experiment that runs simulation only. We are not able to use TAU for the tracing purpose, because the latest TAU library (version 2.27) cannotfilter out the huge number of inline Boost serialization function calls made by Decaf. The inline function calls make the tracefiles too large to generate. We have reported the problem to TAU developers, and they are working on it. To circumvent the tracing problem, we manually instrument the workflow source code, and use the Intel Trace Analyzer and Collector (ITAC) software to collect execution traces.
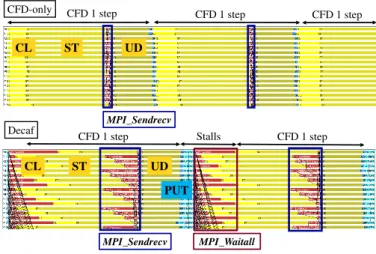
Figure 6 shows the two traces for CFD simulation only, and Decaf-based workflow, respectively. In the CFD simulation only trace, each time step contains three major computation kernels: collision (CL), streaming (ST), and update (UD). In a trace snapshot for 0.9 seconds, CFD simulation itself can execute 3 time steps. Note that all time steps have the similar performance pattern. By contrast, in the lower Decaf-based workflow trace, there is an additional PUT function invoked by simulation processes to transfer output data to
CFD-only Decaf CFD 1 step CFD 1 step CFD 1 step CFD 1 step Stalls CFD 1 step ST CL UD PUT ST UD CL MPI_Waitall MPI_Sendrecv MPI_Sendrecv
Figure 6:Comparison between running CFD simulations only and running Decaf-based workflows. Thisfigure shows a snapshot of 0.9 seconds.
link nodes via Decaf. We observe that the PUT function utilizes a collective “MPI_Waitall” function, during which time all simulation processes stall. This is because Decaf has to make sure data is safely stored in the link nodes before it can proceed to the next step. We also observe that the “MPI_Sendrecv” time (within the streaming ST phase) increases significantly after Decaf is added. This indicates that using Decaf has affected the MPI communication performance of the original simulation application.
4 THE ZIPPER RUNTIME SYSTEM AND
IMPLEMENTATION
From the above performance analysis, wefind multiple performance issues and optimization opportunities as follows: 1) The staging-server access cost including the staging-server query, data movement and locking service can be reduced (e.g., DataSpaces and DIMES have such a cost); 2) the enforced global barriers for all writer processes and all reader processes can be reduced (e.g., Decaf and Flexpath have such barriers); 3) the data transfer time between consecutive simulation steps can be hidden by computation time, and decreased by an early-startfine-grain pipelining approach (e.g., we will in-crease the degree of task-level parallelism and use pipelining to overlap all simulation, analysis, and I/O tasks); and 4) asynchro-nousfine-grain-block data transfers have a more balanced network traffic, which can have a less interference with the original ap-plication’s communication time than a burst of large data block transfers (e.g., Decaf and Flexpath have experienced increased MPI communication time in the original simulation application).
The rest of this section will introduce a new runtime system calledZipperto improve the above identified performance ineffi -ciencies.
4.1 System Overview
In our system design, both simulation and analysis applications are executed in parallel using different compute nodes of an HPC system. For instance, we allocatemcompute nodes to execute the
Buffers
Simulation Process Analysis Process
Zipper library
Producer runtime module Consumer runtime module Zipper library
Buffers low-latency network
Parallel file system servers
Zipper Scientific Workflow
high-performance file I/O
Figure 7:Architecture of the Zipper workflow framework to inte-grate a parallel simulation application with a parallel analysis ap-plication.
simulation application, and allocatencompute nodes to execute the
data analysis application simultaneously. The analysis application is driven by data-availability. At the same time, the simulation application pushes data to the analysis application continuously (i.e., using two-sided data transfers). Whenever a new data block arrives, the analysis application will immediately read and process it.
The architecture of the Zipper system is shown in Figure 7. Both simulation process and analysis process use theZipper li-braryto output or input data, respectively. The interface provided by the Zipper library is simple: Zipper.write(block_id, void* data, block_size) and Zipper.read(block_id, void* data, block_size). The Zipper.write() method passes data to theProducer Runtime Module. The producer runtime module is multi-threaded and provides the essential functionalities of buffer management, asynchronous I/O, data prefetching, communication with consumers, and the concur-rent data transport optimization. On the other side, the analysis application works as a consumer. Each analysis process uses Zip-per.read() to interact with itsConsumer Runtime Moduleto get data constantly. Both producer and consumer runtime modules can uti-lize low-latency HPC network and high-performance parallelfile system to transport and store computed results.
The Zipper system offers two modes to users:Preservemode and
No Preservemode. A user may choose thePreservemode to keep the computed results for future analysis, validation, and verification. On the other hand, one may choose theNo Preservemode to save storage space and perform faster experiments.
4.2 Implementation
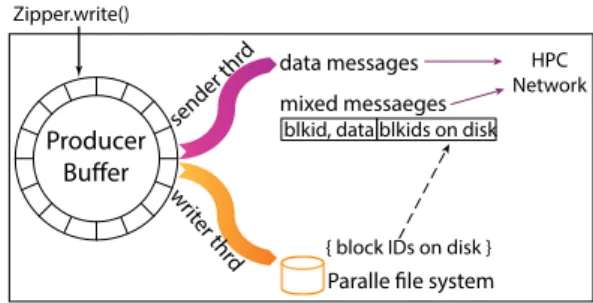
Figure 8 shows the producer runtime module. It consists of a pro-ducer buffer, a sender thread, and a writer thread. The sender thread is responsible for sending data to the consumer processes via the HPC network. The writer thread is responsible for storing com-puted results to a parallelfile system. More specifically, the sender thread checks whether there are blocks stored on disks, and then appends the on-disk block IDs to form amixed message. Notice that
Producer Bu�er data messages sender thr d wr iter thr d mixed messaeges
blkid, data blkids on disk
Paralle �le system
{ block IDs on disk } HPC Network Zipper.write()
Figure 8:The producer runtime module.
even when the analysis application is slower than the simulation, the simulation application will not be blocked or stalled since the writer thread is also moving data to the parallelfile system. In Subsection 4.3, we will describe how the writer thread can help the sender thread to increase data transfer rate by using a concurrent dual data-path method.
Figure 9 shows the consumer runtime module, which consists of a consumer buffer, a receiver thread, a reader thread, and an output thread. The receiver thread gets a mixed message from the HPC network, and divides it into a data block and a list of block IDs. The data block will be moved to the consumer buffer and the block IDs will be copied to an array of “block IDs on disk”. The reader thread will read the block from the parallelfile system and put it to the consumer buffer. The data block itself contains all the necessary information that the analysis application will need, which includes the time step index, the process ID that sends the block, and the position of the data block in the global input domain. This way the consumer process knows which specific block it receives and can apply appropriate data analysis to it.
The output thread in Figure 9 is dedicated to supporting the
Preservemode. It constantly fetches data blocks from the consumer buffer. If the fetched data block has aflag ofon_disk = false, the
output thread will store the data block to thefile system. A data block in the consumer buffer can be freed from the system only if the block has been both analyzed by the analysis process and stored to thefile system by the output thread. Note that the output thread will not be created by the runtime system in theNo Preserve
mode. Consumcer Bu�er reader thr d rec eiv er thr d mixed messaeges blkid,data blkids on disk
Paralle �le system
{ block IDs on disk } HPC Network Zipper.read() output thr d (1) (2) (3)
4.3 Optimization of Concurrent Message and
File Data Transfers
The Zipper runtime system relies on two data paths to transport data: 1) message passing via a low-latency HPC network, and 2) parallel I/O via a parallelfile system. We use the parallelfile system because we need it to alleviate the simulation stall time when the analysis application is relatively slow such that the simulation application is blocked.
On the other hand, using two data paths has the potential to increase the data transfer rate if a portion of the data movement work is offloaded to parallelfile I/O. Figure 10 explains how a con-current transfer optimization may work. The top part shows that all data blocks are sent by network. The bottom part shows that most blocks are transferred by network while a few blocks are trans-ferred by parallelfile I/O. Considering that emerging HPC systems will deploy much faster non-volatile memory (NVM) technologies, future HPC systems will benefit more from this optimization.
Ourconcurrent data transfer optimization methodis implemented as awork-stealingalgorithm, which allows data blocks to be sent through the parallelfile system path only when it is necessary. The writer thread in the producer runtime module works like a helper. When detecting the producer buffer is almost full (defined by a “high water mark” threshold), the writer thread will fetch a data block from the buffer and send it to thefile system. Algorithm 1 shows the pseudocode of the adaptive writer thread. This strategy can automatically adapt to either the message-passing-only method or the mixed network&file-IO method depending on how full or empty the producer buffer is. For instance, if the buffer is constantly near-empty, Zipper will always use the fastest HPC network to send data to the analysis application (Section 6 shows the experiments and effect of using the concurrent data transfer optimization).
We use hardware performance counters to monitor network traffic and verify the cause of the speedup by using the concurrent data transfer optimization method. If an HPC system has two sepa-rate networks (i.e., one for message passing and the other for I/O traffic), we expect the proposed concurrent data transfer optimiza-tion will increase the data transfer rate. If an HPC system does not have a segregation of communication traffic and I/O traffic (such as the Bridges system and the Stampede2 system used in Section 6), the concurrent data transfer optimization may not be able to reach its highest potential. Nevertheless, we still observe a signifi -cant speedup on Bridges and Stampede2 (detailed experiments are shown in Section 6). Here, we briefly introduce the reason. Since both InfiniBand and Omni Path Architecture (OPA) networks have
… … w r w r w r w r Simulation Simulation Analysis Analysis
1. Data blocks sent via network
2. Data blocks sent via network and file I/O
Figure 10:The concurrent data transfer method can reduce the data transfer time by converting a portion of message passing time to certain overlapped parallelfile I/O time.
Algorithm 1Writer Thread Work-stealing Algorithm 1: whiletruedo
2: block←StealBlock(ProducerBuffer) 3: store theblockto the parallelfile system
4: place theblock’s ID into the in-memory data structure of block IDs on disk
5: end
6: functionStealBlock(ProducerBuffer) 7: whiletruedo
8: acquire thelockof ProducerBuffer
9: if#Blocks in ProducerBuffer>Thresholdthen
10: fetch theaddressof thefirst block in ProducerBuffer
11: release thelockof ProducerBuffer
12: returntheaddressof the block
13: else
14: wait on a condition variable and release thelock
15: /* Note: the computation thread will produce data and signal the condition variable when #Blocks in ProducerBuffer>Threshold. */
network congestion control mechanisms, when many simulation processes try to send data to many analysis processes simultane-ously, network congestion control in network switches will play a key role in performance. Our concurrent data transfer optimization method is more efficient in working with the congestion control mechanism because our dual paths allow messages (i.e., the data blocks) to arrive out of order and take different network paths, to ease network congestion and take advantage of multiple network links/switches for improved bandwidth. In-depth performance anal-ysis will be presented in Subsection 6.2.
Brief summary of Zipper’s features: In summary, 1) Zipper usesfine-grain data blocks and creates a higher degree of task parallelism to accelerate the pipeline execution. The other in-situ workflow systems often generate one big data block per time step. 2) Zipper does not impose strict barriers between time steps, and deploys a dataflow-driven approach to minimizing application stalls. The other workflow systems often force using strict writer-reader interlocks and collective global operations (e.g., wait_wall, global locks). 3) There is no server overhead involved, which is different form DataSpaces and DIMES. 4) Zipper supports multiple failure domains (similar to DataSpaces, DIMES, and Flexpath). And 5) Zipper supports both Preserve mode and No-Preserve mode, and introduces a concurrent data transfer optimization, which is based on an adaptive work-stealing algorithm.
4.4 Performance Model
To evaluate the efficiency of Zipper, we use a simplified analytical performance model to estimate the workflow end-to-end time. The analytical model uses the following notation. A number ofP
pro-cessor cores are used to compute simulation, and a number ofQ
processor cores are used to analyze results. The total amount of simulation data generated isD. Given afine-grain data block of
sizeB, there would benb=DB blocks. In the experiments, we use block sizes that are between 1MB and 8MB.
To keep our analytical model simple, we assume that each simu-lation processor core computesnb
P blocks, and each analysis pro-cessor core analyzes nb
Q blocks. Nevertheless, the model can be adapted to support load imbalance situations by considering the process with the maximum workload. The analytical model is based upon the time spent on each data block. Since we use the pipelining parallelism to couple applications, a data block will go through different stages: Simulation→Transfer result→Analyze result.
Lettc,tm, andtadenote the time to compute a data block, trans-fer a block, and analyze a block, respectively. We model the parallel computation timeTcompastc×nPb, and model the parallel analysis timeTanalysisasta×nQb. Because each pipeline stage works inde-pendently from any other stage, the end-to-end time-to-solution can be expressed as follows:Tt2s =max(Tcomp,Ttransfer,Tanalysis). We assume that the number of data blocks is much greater than the number of pipeline stages for which we can ignore the pipeline
startuptime anddrainagetime. In the paper, we use the analytical model to show the end-to-end time is almost equal to the time of one stage. A more detailed model that can accurately predict performance would require modeling the time to compute a block, transfer a block, and analyze a block (for any data block size from small to large), as well as network contention/congestion given a block size and different numbers ofPandQ. Our future work will
study how to build a more detailed performance model.
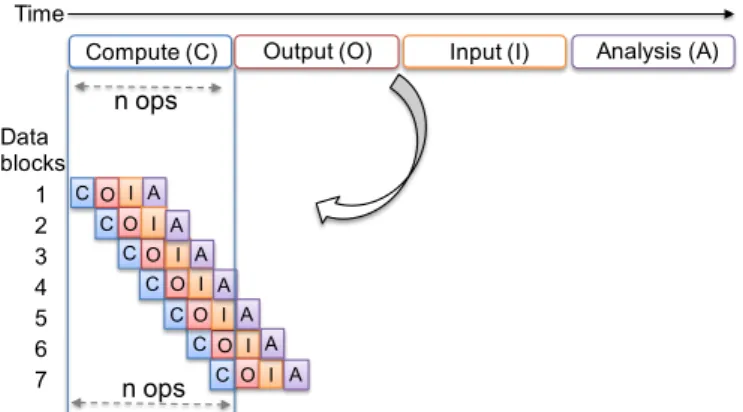
The simplifiedTt2sformula can be easily derived from a pipeline diagram. For instance, as shown in Figure 11, different stages are overlapped such that the end-to-end time is almost equal to the time of the slowest stage. Based upon the model, if the simulation appli-cation and analysis appliappli-cation are scalable, the Zipper workflow can scale well accordingly.
Note that the data transfer time ofTtransfercan be controlled by the frequency to output the simulation data (e.g., one data output perktime steps) to reduce the I/O time. In Section 6, we will perform
a variety of experiments to verify the model.
Compute (C) Output (O) Input (I) Analysis (A)
CO I A C C C C C O O O O O I I I I I C O I A A A A A A n ops n ops Time Data blocks 1 2 3 4 5 6 7
Figure 11: Non-integrated design (upper) vs. integrated de-sign (lower).In the (lower) integrated design, at any time, four stages (C, O, I, and A) are working on four distinct data blocks. The four data blocks could be sequentially dependent, but can still be processed in parallel due to the data pipelining parallelism.
5 RELATED WORK
In the conventionalpost data processingmethods [21, 32, 42], a simulation application computes and stores computed results to
files. Next, an analysis application is launched to perform various data analyses. Due to the post-processing methods’ expensive I/O cost,in-situapproaches are introduced to analyze data when the data are still in memory [4, 5]. For instance, Paraview/Catalyst [15] and VisIt/Libsim [47] can be used to perform in-situ analysis and visualization on large datasets in memory. Paraview/Catalyst defines an interface between simulation and visualization appli-cations, which requires developers implement three subroutines: initialize, coprocess, andfinalize. Similar functions are also provided by VisIt/LibSim to support in-situ visualization.
As an alternative to in-situ approaches,data stagingapproaches can enable co-analysis pipelines by using a loosely coupled integra-tion model. ADIOS [1], PreDatA [51], GLEAN [46], DataStager [2], DataSpaces [11], DIMES [50], and Flexpath [9] leverage advanced I/O infrastructure to reduce the I/O cost. In particular, PreDatA [51] realizes in-transit data processing along a dataflow. It moves data from compute nodes to staging nodes through two passes: thefirst pass of sending data-fetch requests to the staging nodes, followed by the second pass ofpullingpacked data chunks from the compute nodes. We use a single pass to move data to the analysis processes rapidly. DataSpaces [11] and DIMES [50] allow different applica-tions to store data to and extract data from dedicated servers (or metadata servers) simultaneously. Our Zipper system does not use dedicated servers and has no accompanying server access overhead. Sun et al. [43] use DataSpaces and asynchronous coupling of
work-flows as a user case to develop scheduling polices for placing data to different staging cores. GLEAN [46] and DataStager [2] deploy a data staging service on analysis nodes of a cluster to support in-situ processing. FlexIO [52] uses local memory and RDMA to support co-analysis either on the same compute nodes or on diff er-ent staging nodes. Our research shares the data-staging philosophy of theses libraries (e.g., data coupling at runtime and multiple fail-ure domains), but usesfine-grain data blocks, asynchronous task parallelism, and holistic end-to-end level pipelining to minimize application idle time, reduce network contention, and overlap all workflow stages (i.e., simulation, data write, data read, and data analysis).
Our concurrent data transfer optimization method improves the communication throughput by taking advantage of the network congestion control and multiple switches and links. Our deployed network congestion measurement is inspired by the work of Alali et al. [3], which conducts a study to understand whether network congestion occurs on production HPC systems. There are also stud-ies that investigate how to use Quality of Service (QoS) mechanisms to enhance communication. Reinemo et al. compare a list of QoS capabilities on InfiniBand, Advanced Switching, and Ethernet [38]. Gonsiorowski et al. create a model to analyze the use of QoS lanes to reduce the impact of the RAIDrebuildtraffic by assigning dif-ferent traffic quotas to read, write, and rebuild operations. [18]. Kim et al. design an OpenSM (Open SubnetManager) based scheme to adjust the QoS level dynamically by considering the estimated bandwidth and requirement to increase the overall bandwidth of multiple concurrent traffics [25].
Workflow systemssuch as Pegasus [10], Kepler [28], Taverna [48], and Condor/DAGMan [24] usefiles to communicate data and target coarse job-level meta-scheduling. Decaf [13] is a workflow middleware that uses multiple overlapping MPI communicators and a special staging area called “link” to transfer data between a producer and a consumer. The communication among Decaf producer, link, and consumer are inter-locked, and all data must arrive in link before they can be forwarded to the next application. Also, slower consumers will block the producers from running. Swift/T [49] uses a Swift-Turbine compiler to translate a Swift program to an ADLB [30] MPI program, and executes it with a master-worker model. Differently, we targetfine-grain tasks and asynchronous computing, and use data-staging to minimize the workflow latency.
6 PERFORMANCE EVALUATION
This section evaluates the performance model, concurrent message andfile transfer optimization, and scalability of the Zipper system on two different supercomputers:BridgesandStampede2.
TheBridgessystem from the Pittsburgh Supercomputer Cen-ter (briefly mentioned in Section 3) has 752 regular nodes (128GB memory each), 42 large shared-memory nodes (3TB memory each), and 4 extreme shared-memory nodes (12TB memory each). Each node has 28 Intel Haswell cores. Bridgesdeploys a 100 Gbps Intel Omni-Path Architecture, which connects all compute nodes with a 10PB high performance Lustre parallelfile system.
TheStampede2system in the Texas Advanced Computing Center entered full production in August 2017. It has 4,200 Knights Land-ing nodes. Each node has a self-bootLand-ing Knights LandLand-ing (KNL) processor (68 cores), 96GB of DDR memory, and 16GB of MCDRAM (Multichannel DRAM), and peak performance of 3 Teraflops per node. Stampede2uses an Intel Omni-Path Architecture and has a 30PB Lustre parallelfile system.
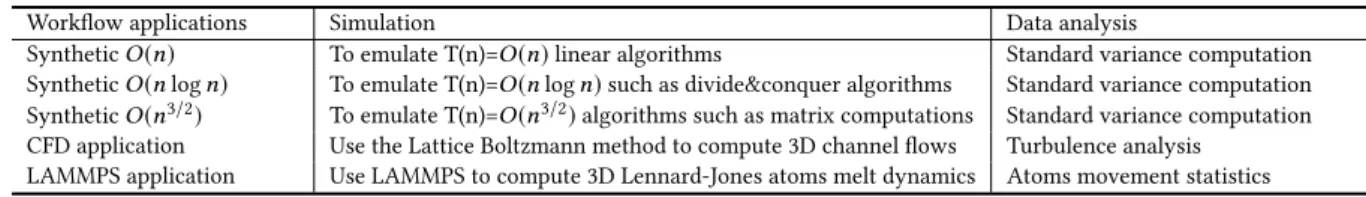
We perform experiments with three synthetic applications and two real-world scientific computing applications. Information of the applications is presented in Table 3.
6.1 Evaluation of the Performance Model
We describe an analytical performance model in Section 4.4 showing that the Zipper system ideally should obtain end-to-end time ofT =max(Tcomp,Ttransfer,Tanalysis). Ourfirst experiment is intended
to verify whether the performance model conforms to the actual Zipper workflow’s performance. The experiments were performed onBridgesusing 1,568 CPU cores for simulation and 784 CPU cores for data analysis in bothNo PreserveandPreservemodes. In the
experiments, a total amount of 3,136GB of data are transferred from simulation to analysis.
Figure 12 shows theNo Preservemode’s time breakdown for three synthetic applications (i.e., theO(n),O(nlogn), andO(n3/2)
applications listed in Table 3) using two block sizes of 1MB and 8MB. In the synthetic workflow, each data block is analyzed and its standard variance is reduced to one double-precisionfloating point value. For each block size (i.e., 1MB and 8MB), we show the measured simulation time, data transfer time, and analysis time, as well as the workflow’s end-to-end time.
2.1 22.2 64.0 1.8 34.6 99.1 38.2 38.2 14.9 37.9 37.9 3.1 23.6 23.2 28.9 22.2 30.5 20.5 40.7 41.6 69.8 38.8 38.7 99.1 0 20 40 60 80 100 120
1MB (O(n)) 1MB (O(nlgn)) 1MB (O(n3/2)) 8MB (O(n)) 8MB (O(nlgn)) 8MB (O(n3/2))
T
im
e
(s)
Block size (Synthetic application's time complexity) Simulation Data Transfer Analysis End-to-end time
Figure 12:Time breakdown of the execution time for three diff er-ent synthetic applications in theNo Preservemode.
As depicted in thefigure, given the same block size, as the applica-tion’s time complexity T(n) increases, the dominant stage switches from data transfer time (in red color) to simulation time (in blue color). However, regardless of the distinct synthetic applications, the workflow’s end-to-end time is always close to the maximum stage time, which empirically validates our performance model.
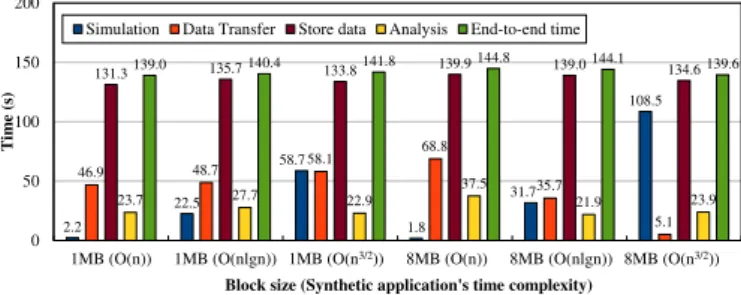
Next, we do the same experiments using thePreservemode. Fig-ure 13 shows the corresponding time breakdown and total time. The experiments show that the end-to-end workflow time is almost equal to the time spent on storing computed results to thefile sys-tem. Since all processes have generated a total amount of 3,136 GB of data, storing data to disks takes the longest time.
2.2 22.5 58.7 1.8 31.7 108.5 46.9 48.7 58.1 68.8 35.7 5.1 131.3 135.7 133.8 139.9 139.0 134.6 23.7 27.7 22.9 37.5 21.9 23.9 139.0 140.4 141.8 144.8 144.1 139.6 0 50 100 150 200
1MB (O(n)) 1MB (O(nlgn)) 1MB (O(n3/2)) 8MB (O(n)) 8MB (O(nlgn)) 8MB (O(n3/2))
T
im
e
(s)
Block size (Synthetic application's time complexity) Simulation Data Transfer Store data Analysis End-to-end time
Figure 13:Time breakdown of the execution time for three diff er-ent synthetic applications in thePreservemode.
Moreover, we evaluate the performance model with two real-world applications of CFD and LAMMPS. Their results are shown together with the weak-scalability experiment (in Subsection 6.3). For the CFD and LAMMPS applications, their workflow end-to-end time is nearly the same as the dominant simulation time.
6.2 E
ff
ect of the Concurrent Message and File
Transfer Optimization
Our second experiment will evaluate the effect of using the concur-rent message andfile data transfer optimization.
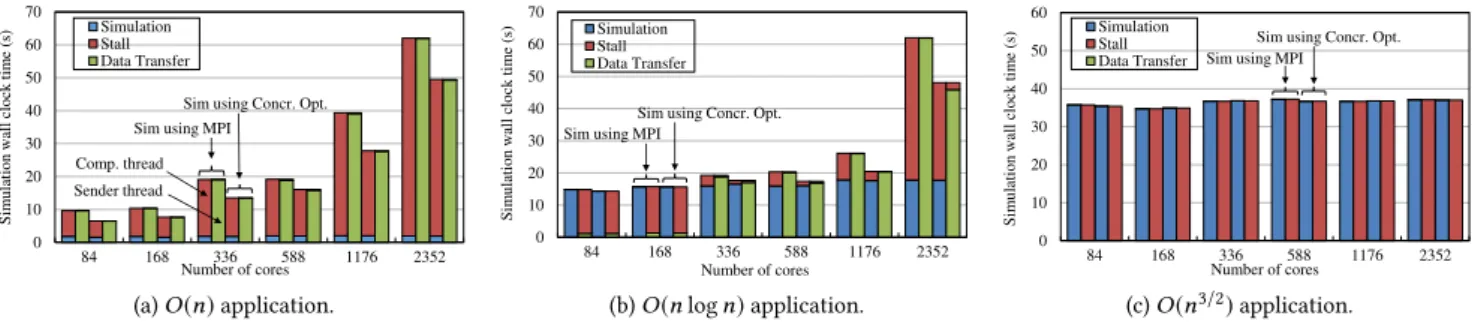
The three synthetic applications in Table 3 are used to do exper-iments onBridges. We instrument the applications’ source code, and measure the time spent on two parallel threads of each simula-tion process: the computasimula-tion thread, and the sender thread. The computation thread will be either computing simulations or stalled due to a full producer buffer (represented as stackedsimulation
Table 3: Description of the applications used in our experiments.
Workflow applications Simulation Data analysis
SyntheticO(n) To emulate T(n)=O(n)linear algorithms Standard variance computation SyntheticO(nlogn) To emulate T(n)=O(nlogn)such as divide&conquer algorithms Standard variance computation SyntheticO(n3/2) To emulate T(n)=O(n3/2)algorithms such as matrix computations Standard variance computation CFD application Use the Lattice Boltzmann method to compute 3D channelflows Turbulence analysis
LAMMPS application Use LAMMPS to compute 3D Lennard-Jones atoms melt dynamics Atoms movement statistics
sending messages or waiting for new data (represented as stacked
data transferandstall).
As seen in Figure 14, we increase the number of CPU cores from 84 to 2,352 to perform weak scaling experiments. For each specific number of cores, we compare the implementation that uses the message-passing-only method to the implementation that uses the concurrent message&file transfer optimization. Givenncores, there
is a group of four columns in thefigure. The left two columns show the performance of the message-passing-only implementation, and the right two columns show the performance of the concurrent transfer optimization.
In Figure 14.a for theO(n)application, from 84 to 2352 cores,
the simulation application’s wallclock time has been reduced by 32.4%, 26.3%, 29.2%, 16.1%, 29.4% and 20.2%, respectively. This im-provement is mainly due to the reduced stall time. For thisO(n)
application, the data generation rate from each compute node is 56GB/s, while the point-to-point network bandwidth for each port is 10.2GB/s. As a result, the sender thread cannot move data out in time, and the producer buffer becomes full and the simulation thread is blocked. In this case, our work-stealing writer detects that the threshold is reached and starts to steal blocks (stolen 47%∼62.4% of total blocks) in the above cases.
In Figure 14.b for theO(nlogn)application, the concurrent
trans-fer optimization has reduced the simulation stall time and data transfer time by 8.1%, 14.2%, 21.7%, and 22.5%, from 336 to 2352 cores, respectively. Our work stealing doesn’t improve the two smaller cases of 84 and 168 cores because the producer buffer is mostly empty and there is nothing to steal during the execution.
Figure 14.c shows the time for the computation-intensiveO(n3/2)
application. Since this application has the slowest data generation rate, the producer buffer is almost always empty such that the work-stealing in the writer thread is never activated. In this case, the concurrent transfer optimization falls back to the message-passing method.
Based on the performance results in Figure 14, we canfind that the concurrent optimization method is always as good or better than the message-passing-only method. The reason is that the concurrent optimization deploys an adaptive stealing-based approach such that it lends a hand only if there exist appropriate opportunities to steal. If there is no stealing opportunity, its performance will be the same as the original performance.
6.2.1 Why the concurrent optimization can improve performance. The HPC system ofBridgesuses the Intel Omni Path Architecture (OPA) network, where each compute node is connected to a leaf edge switch (42 ports, 12.5 GB/s each) and then all leaf switches are connected through a set of core edge switches [6]. Atfirst glance, it
seems to be impossible to gain any benefits by using the concurrent transfer optimization because there is only one link from a compute node to one port of a leaf switch.
To dig into the reason, we use the PAPI network component [36] and OPA network analysis tools to measure network related perfor-mance events. We measure the perforperfor-mance counters ofXmitData, XmitPkts,RcvData,RcvPkts, andXmitWaitwhen we compare the message-passing only method and the concurrent method. Since users do not have privileges to access the counters on switches, we can only collect the performance counters on the network adapter on each compute node.
Among all the network events, wefind that theXmitWaitcounter shows the biggest difference between using the message-passing only method and using the concurrent method. The specificXmitWait counter is used to count the number of events (in FLIT2) when any virtual lane had data but was unable to transmit [22], for reasons such as no transmission credits available, or the link was busy send-ing non-data packets. Hence, this counter is often used to measure the extent of network congestion [3].
We use the Linux command “opapmaquery -o getportstatus” to collect the values of the counters on each compute node periodi-cally. Whenever 10% of the total number of blocks are generated, our sender thread will query the counters and calculate the dif-ference between the current query and the previous query. This measured difference indicates how many messages are attempted to send out but rejected due to the network congestion control mechanism. The larger theXmitWaitvalue is, the more times the network adapter is unable to transmit, and the more congested the network is.
We use the measuredXmitWaitcounter to show the relationship between the degree of the network congestion and the data transfer time. As shown in Figure 15.a dedicated for theO(n)application,
we observe that the counter ofXmitWaitusing message-passing-only is larger than that using the concurrent method by 80%, 21%, 13%, 13%, 13%, and 24% from 84 to 2,352 cores, respectively. This suggests that when we use the message-passing-only method, more messages are not able to transmit than when we use the concurrent method. SinceXmitWaitis an indication of the degree of network congestion, we can say that the concurrent method has less serious congestion than the message-passing-only method. Also due to the reduced network congestion, the concurrent method can send data more quickly and has shorter transfer time, which is confirmed by Figure 14.a correspondingly.
2In Omni Path, the Link Transfer (LT) layer segments the end-to-end Fabric Packets (FPs) into 64 bit Flow Control Digits (FLITs), and groups 16 FLITs into a Link Transfer Packet (LTP) to reliably transport FP FLITs and control information on the link[6].
84 168 336 588 1176 2352 0 10 20 30 40 50 60 70 Number of cores Si m ul at io n w al l cl ock ti m e (s ) Simulation Stall Data Transfer
Sim using MPI Sim using Concr. Opt.
Sender thread Comp. thread (a)O(n)application. 84 168 336 588 1176 2352 0 10 20 30 40 50 60 70 Number of cores Sim ul ati on w all clo ck tim e (s) SimulationStall Data Transfer
Sim using MPI
Sim using Concr. Opt.
(b)O(nlogn)application. 84 168 336 588 1176 2352 0 10 20 30 40 50 60 Number of cores Si m ul at io n w al l cl ock ti m e (s ) Simulation Stall
Data Transfer Sim using MPI Sim using Concr. Opt.
(c)O(n3/2)application. Figure 14:Effect of the concurrent data transfer optimization using different number of cores on three synthetic applications.
0.00E+00 2.00E+09 4.00E+09 6.00E+09 8.00E+09 84 168 336 588 1176 2352 Xm itW ai t Number of cores Message Passing Concr. Opt. (a)O(n)application. 0.00E+00 2.00E+09 4.00E+09 6.00E+09 8.00E+09 84 168 336 588 1176 2352 X m itW ai t Number of cores Message Passing Concr. Opt. (b)O(nlogn)application. 0.00E+00 2.00E+06 4.00E+06 6.00E+06 8.00E+06 1.00E+07 84 168 336 588 1176 2352 X m itW ai t Number of core Message Passing Concr. Opt. (c)O(n3/2)application.
Figure 15:Network Congestion of the concurrent data transfer optimization using different number of cores on three synthetic applications. XmitWaitcounts the number of occurrences when any virtual lane had data but was unable to transmit.
Measurement of theXmitWaitcounter for theO(nlogn)
appli-cation is shown in Figure 15.b. On 84 and 168 cores, theXmitWait counter is less than 0.5×10⁹, which implies a light network
conges-tion and all data can be sent out rapidly without waiting. The other sign of a light network congestion is that the producer’s message buffer is almost empty all the time. Therefore, our writer thread does not steal any data blocks such that the concurrent method be-comes the message-passing-only method. Hence, Figure 14.b shows equal data transfer time on 84 and 168 cores. However, for larger scales starting from 336 cores, theXmitWaitcounter rises up signif-icantly (i.e., 3 times to 12 times bigger than that on 168 cores). This suggests a higher degree of congestion, and the producer’s buffer becomes full and the writer thread starts stealing and eases the congestion again. The reduced congestion also justifies the shorter data transfer time by using the concurrent method from 588 to 2352 cores (see Figure 14.b).
In Figure 15.c, for the slowestO(n3/2)producer application, the
value of theXmitWaitcounter is around 106(i.e., three orders of magnitude less than the previous two applications). The congestion degree is constantly low for all different numbers of cores, and the producer’s buffer is almost empty such that the concurrent method falls back to the message-passing-only method. Therefore, the corresponding Figure 14.c shows that the message-passing-only and concurrent methods have equal data transfer time.
6.3 Scalability Performance
The last experiment is to evaluate the scalability performance of the Zipper system. We perform experiment with two real-world
applications of CFD and LAMMPS on the largerStampede2system.
Bridgesonly allows 4,704 cores per job.
The CFD application uses the Lattice Boltzmann method to com-pute 3-D simulations of viscous incompressiblefluid sliding down 3D hydrophobic microchannel walls [20, 53]. Its corresponding analysis component computes the n-th moment of the velocity distribution:E(u(x,t)n), where u(x,t)is the velocity at a spatial
pointxat timet. The statistics can help scientists understand the
properties of the turbulentflow with highReynoldsnumbers. When all n-th moments are available, the probability density function of
u(x,t)can be evaluated to give the complete information of the velocityfluctuation of a turbulentflow [29, 40].
The LAMMPS application simulates clusters of Lennard-Jones atoms. We use the application to study the melting process of ma-terials from a low-energy solid structure at low temperatures to a set of higher energy liquid structures at high temperatures. The Lennard-Jones model is a mathematical model for approximating interactions between neutral atoms or molecules. The counterpart data analysis application will compute MSD (mean squared displace-ment). MSD calculates the deviation time between the position of a particle and a reference position, in order to analyze the spatial extent of random motions.
Remark: The reason we select the CFD and LAMMPS workflows to do experiments is thatsimulation-time data analysesare com-mon in scientific and engineering domains, and achieving high performance is crucial to most domain scientists [12, 26, 33]. The data analysis application in our workflows receives data blocks and analyzes them accordingly, followed by asynchronous reduction
operations. Our future work will add a simplified programming interface (e.g., an application interface similar to MapReduce) to Zipper to simplify parallel programing of big data analysis.
6.3.1 The CFD application.In the CFD workflow experiments, each simulation process is allocated with afluid subgrid of dimen-sion 64×64×256. When doubling the number of CPU cores, the total
input size also doubles (i.e., weak scaling). Among the total number of cores, two thirds of the cores are used for CFD simulations and one third are used for the n-th moment analysis.
Figure 16 shows the end-to-end time using MPI-IO, Flexpath, Decaf, and Zipper, as well as the simulation-only time in theNo Pre-servemode. On Stampede2, when the number of compute nodes is larger than 8, DataSpaces and DIMES aborted with “rpc_bind_addr” error in the DataSpaces/DIMES initialization function. The error is related to “an issue related to OPA and KNL processors”, and has been confirmed by the DataSpaces team. Hence, we could not test DataSpaces/DIMES on Stampede2. Nevertheless, the fastest library is Decaf, which we choose to compare with Zipper.
Simulation-only time is the time spent only by the simulation program’s computational kernels (excluding any I/O, idle time, and data staging related cost). It works as a lower bound of the workflow end-to-end time. As depicted in Figure 16, we can see that using MPI-IO is not scalable: as the number of cores increases from 3264 to 13,056, larger MPI-IO experiments take too long tofinish. On the other hand, Flexpath and Decaf scale well from 204 cores to 3,264 cores. However, Flexpath and Decaf crashed with software faults on 6,528 and 13,056 cores. In particular, Decaf has segmentation faults due to integer overflows. We have reported the issue to Decaf developers and they have confirmed the error. Flexpath terminated with segmentation fault when the number of cores reaches 6,528. We have also reported the problem to Flexpath developers.
In order to show complete experimental results for Flexpath and Decaf, we assume that both methods have perfect scalability on 6,528 and 13,056 cores, and show their ideal end-to-end time (denoted by dotted lines). As shown in Figure 16, Zipper’s end-to-end time is almost equal to the simulation-only time, and is 11.5 times faster than Flexpath, and 1.7 times faster than Decaf.
One might wonder why Flexpath is slow. We conducted a set of investigations tofind out the reason. Based on our experiments, Flexpath’s data transfer time becomes significantly slower as we increase the number of processes per node (each process uses Flex-path to transport data). Ourfinding is that Flexpath does not have optimized support for multiple processes per node. Flexpath utilizes a socket interface and all communications (even within the same node) have to go through the socket interface. However, the com-munication between processes on one node can use shared memory to achieve higher performance (e.g., MPI uses this optimization). In order to show theidealperformance of Flexpath, we attempt one-process-per-node to rerun the 204-core experiment (although wasting many cores on each node). In the new experiment, Flexpath using 102 processes on 102 nodes (i.e., 6,936 cores) only takes 46 seconds, but is still slower than Zipper using 102 processes on 3 nodes (i.e., 204 cores) by 16.8%. Besides using a smaller number of processes per node, another Flexpath optimization is to use a “Mas-ter” process on each node to aggregate data from all processes of
0 100 200 300 400 500 600 204 408 816 1632 3264 6528 13056 End -to-end tim e (s) Number of cores MPI-IO Flexpath Decaf Zipper Simulation-only 1.7X 1.4X
Figure 16: Scalability performance of the CFD workflows using MPI-IO, Flexpath, Decaf and Zipper, respectively.
Zipper
Decaf
CFD 1 time step CFD 1 time step CFD 1 time step
CFD 1 time step Stalls CFD 1 time step Stalls
MPI_Waitall MPI_Sendrecv
MPI_Sendrecv
Figure 17:Trace comparison between Zipper and Decaf for the CFD application on 204 cores. Thisfigure shows a snapshot of 1.3 seconds when using 204 cores, which is taken from the experiment shown in Figure 16.
the node to reduce the communication cost. However, this method requires significant code modifications.
In order to illustrate why Zipper is faster than Decaf, Figure 17 displays Zipper and Decaf’s traces within a time interval of 1.3 seconds on 204 cores. To take the snapshot, we zoom in the entire trace, and then cut out a trace segment of 1.3 seconds. Note that showing the entire trace all at once will make thefigure too dense to view any details. During the same interval, Zipper is able to run three simulation steps, while Decaf is able to run two steps with a significant amount of stall time. This speedup of 1.4 times is almost the same as the speedup shown in Figure 16 on 204 cores.
The reason for the performance inefficiency is as follows (also reported in Section 3): 1) Decaf has significant simulation stall time caused by MPI_Waitall, and 2) the simulations application’s MPI_Sendrecv time becomes longer due to Decaf’s interference. Since Zipper uses smaller data blocks and asynchronous pipelin-ing data transfers, both the network traffic interference and the collective MPI cost have been reduced.
2.2X 0 200 400 600 800 1000 1200 204 408 816 1632 3264 6528 13056 End -to -end tim e (s) Number of cores MPI-IO Flexpath Decaf Zipper Simulation-only
Figure 18:Scalability performance of the LAMMPS workflows us-ing MPI-IO, Flexpath, Decaf and Zipper, respectively.
6.3.2 The LAMMPS application.Figure 18 shows the experi-mental results for the LAMMPS workflow application. Again, we perform weak scaling experiments. Figure 18 shows that Flexpath scales well from 204 to 3,264 cores but is 7.1 times slower than Zipper. Because the data size in LAMMPS does not reach the inte-ger limit, we are able to execute Decaf on 6,528 and 13,056 cores successfully without integer overflows. From thefigure, we can see that Decaf scales greatly from 204 to 1,632 cores, but becomes 128% slower from 1,632 to 6,528 cores. Eventually, its end-to-end time increases by 177% from 6,528 to 13,056 cores.
To study why Decaf is 2.2 times slower than Zipper in the largest experiment, we specifically collect two very large traces for Decaf and Zipper using 13,056 cores, respectively. Visualizing the large-scale trace itself requires us to use a dedicated compute node from theStampede2HPC system for 2 hours.
Figure 19 shows a snapshot of the two traces in an interval of 9.1 seconds. During the same time interval, LAMMPS using Zipper runs around 4.4 time steps. On the other hand, LAMMPS using Decaf runs around 2 time steps. Notice that the Decaf trace has a significant stall time at the end of each step. Also, the LAMMPS simulation time using Decaf becomes much longer than that using Zipper. In this LAMMPS workflow experiment, each LAMMPS pro-cess generates approximately 20MB of data in each time step. While Decaf directly sends a message of 20MB to destination processes, Zipper divides the contiguous 20MB data into many small blocks of size 1.2MB. Such an asynchronousfine-grain-block data transfer method has managed to keep network traffic more balanced with lesser interference to the LAMMPS simulation processes.
7 CONCLUSION
This work studies the important class of scientific workflows that combine large-scale simulations with big data analysis by carrying out performance analysis and optimization on the present I/O and data transfer libraries. Our trace analyses reveal that there are sig-nificant performance inefficiencies in the current practice (such as remote server and metaserver read/write time, coarse-grain critical sections, interlock between applications, barriers, and application stalls). With the aim of minimizing the end-to-end time of scientific
Zipper
Decaf
LAMMPS 1 step LAMMPS 1 stepLAMMPS 1 step LAMMPS 1 step
LAMMPS 1 step Stalls LAMMPS 1 step Stalls
Figure 19:Trace comparison between Zipper and Decaf for the LAMMPS application on 13,056 cores. Thisfigure shows a snapshot of 9.1 seconds when using 13,056 cores, which is taken from the ex-periment shown in Figure 18.
workflows, we propose to combine the abstraction of pipelining par-allelism with the abstraction offine-grain task parallelism to totally intertwine the simulation and analysis applications such that the time-to-solution is merely one stage of time. A new Zipper runtime system has been designed and implemented. Supported by both an analytical performance model and empirical experiments, we show that the Zipper system can obtain the fastest end-to-end time, which almost reaches the lower bound of the simulation-only time. In addition, the concurrent data transfer optimization can reduce the stall time of the simulation application when the simulation is coupled with a relatively slow data analysis. Our experiments with the real-world CFD and LAMMPS workflows show that the Zipper approach is able to outperform the Decaf method — which is the fastest one among seven modern methods — by up to 2.2 times. A set of subsequent traces also reveal that the reduced idle/stall time, the lesser interference with the simulation time, and the full overlapping of all workflow stages have contributed the most to Zipper’s enhanced end-to-end workflow time.
ACKNOWLEDGMENT
This work used the Extreme Science and Engineering Discovery Environment (XSEDE), which is supported by the NSF Grant# ACI-1548562. It is also supported by the NSF Grant# 1513201. We thank Dr. Luoding Zhu for providing the parallel CFD application. We also thank the DataSpaces team and the Flexpath team for their support of using their software. In particular, we would like to thank our shepherd, Dr. Gerald Lofstead, for providing many suggestions and guiding the revision of our paper.
REFERENCES
[1] H. Abbasi, J. Lofstead, F. Zheng, K. Schwan, M. Wolf, and S. Klasky. 2009. Extend-ing I/O through high performance data services. InIEEE International Conference on Cluster Computing and Workshops (CLUSTER’09). IEEE, 1–10.
[2] H. Abbasi, M. Wolf, G. Eisenhauer, S. Klasky, K. Schwan, and F. Zheng. 2010. Datastager: Scalable data staging services for petascale applications. Cluster Computing13, 3 (2010), 277–290.
[3] Fatma Alali, Fabrice Mizero, Malathi Veeraraghavan, and John M Dennis. 2017. A measurement study of congestion in an InfiniBand network. InNetwork Traffic