1
Erasmus University Rotterdam Faculty of History and Arts
Master Programme Cultural Economics and Cultural Entrepreneurship
Simeng Chang 366644
Art as an investment: return, risk and
portfolio diversification in Chinese
contemporary art investment
First reader / master thesis advisor: Marilena Vecco Second reader: Erwin Dekker Rotterdam, August, 2013
2
Acknowledgements
Special thanks to those who made this thesis possible.
I am grateful to my thesis supervisor, Professor Marilena Vecco, for her constant encouragement and guidance. She supports me through all stages of this thesis by networking with scholars and supplying with reference material of great value. Her instructive comments and inspiring advice improve my research skills and prepare me for future study.
In addition, I would like to express my gratitude to Dr. Di Benedetto. Dr. Di Benedetto is the esteemed colleague from the Politecnico of Turin. His expertise in data processing and knowledge in financial portfolio help me a lot in improving my research data and methodology. Without his instructive suggestions, this thesis would not have reached its present form.
Finally, I also owe my sincere gratitude to my friends and my fellow classmates who always encourage me and help me out of problems during my work on thesis.
3
Art as an investment: return, risk and portfolio
diversification in Chinese contemporary art investment
Abstract. This thesis intends to evaluate how does the Chinese contemporary art perform as stand-alone investment as well as in a mixed- asset portfolio. Based on Artron artist index, the weighted average method is conducted to estimate the return and risk of Chinese contemporary art investment. Additionally, optimal portfolio consisting of stock, government bond, corporate bond, gold and Chinese contemporary art is constructed using Mean-Variance Model. The results of this thesis suggest that Chinese contemporary art is worth investing. More specifically, during the period of 2003 and 2011 Chinese contemporary art outperforms stock, corporate bond and government bond with return and risk taking into consideration. With low and even negative correlation with the traditional financial investment tool, result of Mean-Variance Model suggests that Chinese contemporary art is eligible to diversify an investment portfolio as long as the expected semi-annual return does not exceed 9%.
Keywords: art investment; return and risk; portfolio diversification; Chinese contemporary art.
4 Table of Contents Table of Contents ... 4 Index of Figures ... 6 Index of Tables ... 6 1 Introduction ... 8 2 Literature Review ... 13
2.1 Art Price Indices ... 13
2.1.1 Repeat-Sales Regression (RSR) ... 14
2.1.2 Hedonic Approach ... 15
2.1.3 Naïve Price Indices ... 16
2.2 Art Investment: Return Rate and Risk ... 16
2.2.1 General Review ... 16
2.2.2 Representative Studies ... 17
2.3 Correlation with Financial Markets ... 25
2.4 Chinese Art Market ... 27
3 Portfolio Diversification ... 29
3.1 Modern Portfolio Theory ... 29
3.1.1 Expected Return ... 30
3.1.2 Risk ... 30
3.1.3 Correlation ... 30
3.2 Mean-Variance Model ... 31
3.3 Efficient Frontier ... 32
5
4.1 History and Development ... 33
4.2 Market Performance of Chinese Contemporary Art from 2004 to 2012 34 5 Data and Methodology ... 36
5.1 Data 36 5.2 Artist Index ... 36
5.3 Financial Assets Index ... 38
5.4 Methodology ... 39
5.4.1 Estimate Return Rate of Chinese Contemporary Art ... 39
5.4.2 Estimate Return Rate of Financial Assets ... 40
5.4.3 Mean-Variance Model ... 41
6 Empirical Result ... 42
6.1 Return Rate and Risk ... 42
6.2 Portfolio Diversification ... 45
6.2.1 Preliminary Results ... 46
6.2.2 Different Simulations ... 48
6.2.3 Highlights of Empirical Findings ... 54
7 Conclusion ... 56 8 Limitations ... 57 8.1 Data Limitations ... 57 8.2 Methodology Limitations ... 57 9 Recommendations ... 59 10 References ... 60 11 Appendix ... 65
6
Index of Figures
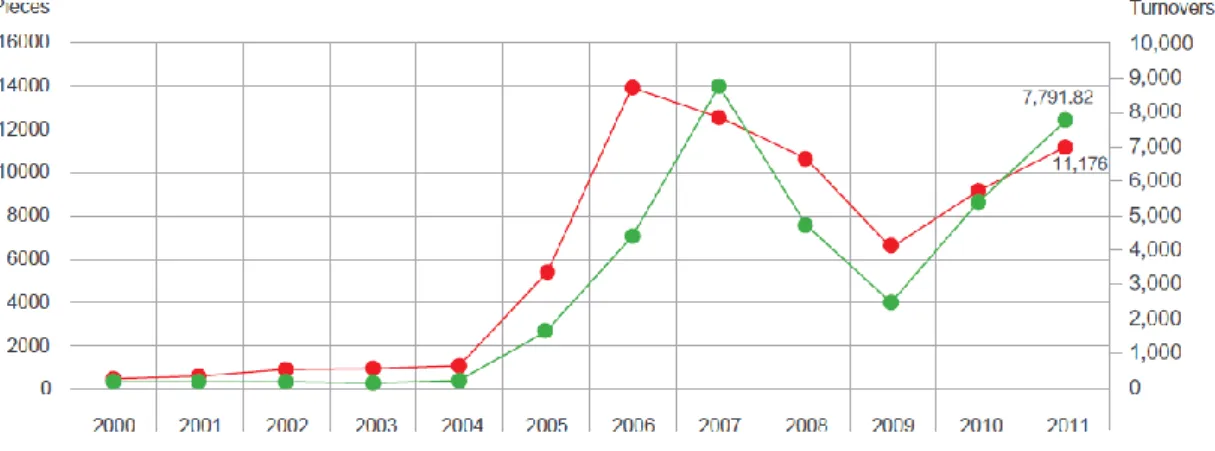
Figure 4.1 Auction turnover and number of lots of contemporary art in China,
2000-2011 ... 35
Figure 6.1 Return Performances of Art and Financial Assets, 2003-2012 ... 43
Figure 6.2 Risk and Return Trade-off, 2003-2012 ... 45
Figure 6.3 Efficient Frontier ... 48
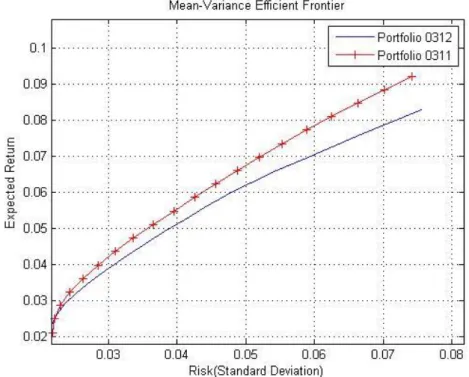
Figure 6.4 Efficient Frontier of Portfolio with Art (0311 vs 0312) ... 52
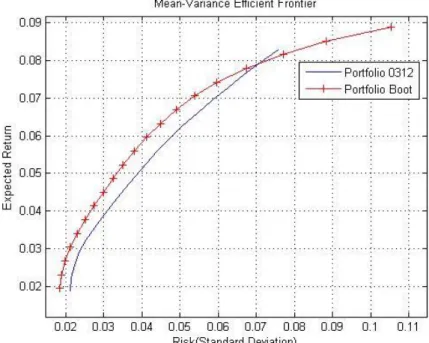
Figure 6.5 Efficient Frontier of Portfolio with Art (0312vs Bootstrap) ... 54
Index of Tables Table 2.1 Estimated Fine Art market performance as reported by various academic papers ... 21
Table 6.1 Summary of Semi-annual Return Rate, 2003-2012 ... 42
Table 6.2 Descriptive Statistics of Art and Financial Assets, 2003-2012 ... 44
Table 6.3 Return per Unit of Risk for Art and Financial Assets ... 44
Table 6.4 Correlations between Art and Financial Assets, 2003-2012 ... 46
Table 6.5 Optimal Portfolios without Contemporary Art, 2003-2012 ... 47
Table 6.6 Optimal Portfolios with Contemporary Art, 2003-2012 ... 47
Table 6.7 Descriptive Statistics of Art and Financial Assets, 2003-2011 ... 50
Table 6.8 Return per Unit of Risk for Art and Financial Assets ... 50
Table 6.9 Correlations between Art and Financial Assets, 2003-2011 ... 50
Table 6.10 Optimal Portfolios with Contemporary Art, 2003-2011 ... 51
Table 6.11 Bootstrapping Optimal Portfolios with Contemporary Art ... 53
Appendix 1 Sample Artist List ... 65
Appendix 2. Shanghai Stock Exchange Composite Index (000001) ... 71
7
Appendix 4 Corporate Bond Index (000013) ... 75 Appendix 5 COMEX Gold Index ... 77
8 1 Introduction
Past decade has witnessed the expansion of Chinese marketplace for art auction at an accelerated speed. Flourishing with the prosperity of China’s art market, Chinese contemporary art captures spotlight in global art market with continuous astonishing auction records. In 2006, Chinese vanguard artists represented by Zhang Xiaogang, Yue Mingjun broke the 1 million dollar record one after another, consolidating their stages at global auction market. In 2007, the Chinese contemporary art continued to grow, which accounted for 24% of global contemporary auction sales, with 75 pieces exceeding 1 million dollars and 36 artists included in the “Contemporary Top 100 list” by Artprice (Artprice, 2007). With 41.4% of global art auction revenue in 2011, China was winning market share from USA which took up 23.5% share, establishing its domination in global art market (Artprice, 2011). What’s more, statistics in 2011 from Artprice confirms that China appeared to be the markets that supply and demand for contemporary art was the most appropriately matched. Beijing became the world’s second marketplace for contemporary art auction sales for the first time (Artprice, 2011).
Obviously these figures indicate that Chinese contemporary art has increased dramatically in value and caught a lot attention from investors. Nowadays it is commonly believed that the art market yields larger profits in comparison to the conventional investment markets. More and more corporates and wealthy investors begin to allocate part of their investment for art in their investment portfolio. In 2007, China Minsheng Bank launched China’s first art investment fund--- “art investment schemes No.1”, which opened up a precedent of public art investment fund in China. Art as a new popular investment region, it raises the interest of investors to see how it performs as an alternative investment.
9
During my research, I found limited number of empirical studies on Chinese art investment, not to mention the specific research on Chinese contemporary art investment. Previous studies on investment in arts largely focused on western art markets and major art schools. The imbalance between public interest and academic focus originates the motivation of this thesis. My interest towards Chinese contemporary art comes from two aspects: on one hand, I am curious for whether the record-breaking sales are representative for the performance of the whole contemporary art market or whether it is just a notable exception which is over exposed by the media, nourishing the widespread belief that Chinese contemporary art is a lucrative investment. Through empirical research I try to verify the argument that Chinese contemporary art investment generates extraordinary monetary gains. On the other hand, with the ever growing interest among investors, enterprises and security funds tend to include art into investment portfolio to enhancing diversification. It may be the right moment to examine whether Chinese contemporary art diversifies an investment portfolio and if it does, to what extent.
Consequently, the aim of this thesis is to investigate financial performance of Chinese contemporary art as stand-alone investment as well as in a mixed-asset portfolio. To further look into the issue, sub-questions are developed as follows:
a) Whether does Chinese contemporary art outperform traditional financial assets in terms of return rate and risk?
b) How is the correlation between Chinese contemporary art market and financial market? To what extent does Chinese contemporary art investment fits into an investor’s portfolio?
Additionally, I will try to tackle the problem that most studies are subjected to--- neglecting transaction cost and taxation when calculating return rate. As Frey (1995)
10
stated, extremely high costs in art transaction significantly influences return rate of art investment. Considering that no domestic empirical study seriously takes transaction cost into account when calculating return rate of art investment, in my research commission fee and tax will be estimated and deducted to approach closer to real return rate of Chinese contemporary art investment.
In general, this thesis provides an overview of previous researches on art as alternative investment in the academic field and gives empirical results on financial performance of Chinese contemporary art investment in the past 10 years. Since Chinese contemporary art market merges with relatively short developing time, little empirical studies have been conducted in academic field. The obtained outcomes will hopefully contribute to the present academia for emerging markets, as well as fill in the blank of existing literatures on Chinese contemporary art investment. What’s more, this thesis distinguishes itself from previous empirical studies in the following aspects: first, a new dataset—Artron artist indices— are employed to estimate financial performance of Chinese contemporary art investment. 201 Chinese contemporary artists are selected into a sample list. Return rate is calculated for each painter based on artist indices. After that a composite return rate of Chinese contemporary art investment is derived from the 201 artist return rates. Second, different from mainstream studies in which return rate is estimated on a gross basis, my study adjusts for commission fee and taxes while calculating return rate. Consequently, result conclusions drew from my research show the net return rate of art investment, which better reflects the practical situation. In addition contributing to present academic field, empirical results are also instructive to those investors and institutions intending to hold art investment exclusively as well as desiring to include art into mixed asset portfolios.
11
In Chapter 2, we will see how art as investment has been studied by cultural economists through previous and present centuries. Main issues such as methods of constructing art price indices and empirical results of financial performance of art investment are discussed. In addition, representative studies addressing investing in Chinese painting are in depth analyzed. Review on literature gives general characteristics of art as an alternative investment which facilitates further research on Chinese contemporary art investment.
Chapter 3 describes the description of theories on portfolio diversification. Modern Portfolio Theory and Mean-Variance Model are introduced to offer a theoretical approach to the research question of how Chinese contemporary art performs in a mixed portfolio.
Chapter 4 provides readers a brief description of history of Chinese contemporary art and the tendency of domestic auction turnover from 2004 to 2012. Through this chapter readers form a macro view of development history and price movement of Chinese contemporary art market, which is necessary for better understanding the empirical study in the following chapters.
Chapter 5 donates to the data and methodology employed in the empirical research. In this chapter, choice of dataset and methodology of return rate estimation are explained.
Chapter 6 shows results obtained in the empirical research. Here the research questions raised in the beginning of the thesis are answered. Financial performance of Chinese contemporary art is evaluated by comparing return rate and risk with traditional financial assets. What’s more, optimal portfolio compromising Chinese contemporary art, stock, bond and gold is constructed to demonstrate how Chinese contemporary art fits into investment portfolio.
12
Chapter 7 and 8 present the conclusions and limitations of the thesis. Here I point out major findings as well as pitfalls of my research. Chapter 9 wraps up the paper with suggestions for future research.
13 2 Literature Review
Intensive empirical researches on examining financial performance of artwork investment have been undertaken since 1960s. Due to different methods, various data sources and sample periods, specific results differ widely among return rate and risk. Most of the studies discover that artwork investment results relatively lower monetary return and higher risk comparing to conventional investments such as stocks, bonds and gold. However, this does not necessarily mean that artwork investment is not attractive to investors. Monetary return is only one of the benefits to investors since more and more research discovers that artwork investment enjoys capacity for diversifying risk in investment portfolios (Pesando, 1993; Mei and Moses, 2002; Campbell, 2005; Campbell and Pullan, 2006 and Horowitz, 2010).
In this chapter, I focus on the empirical findings of how artwork performs as being a form of financial investment. First, I discuss art price index which is the prerequisite of measuring financial performance artwork investment. Then I briefly introduce the main methodologies of constructing art price indices as well as valuation of each method. Second, comprehensive analysis on empirical findings from the return rate and portfolio diversification is presented. Lastly I will focus on studies on performance of Chinese art investment to give in-depth knowledge of how academic research proceeds into the emerging market.
2.1 Art Price Indices
Constructing art price indices lays the foundation for measuring return rate and risk of artwork investment. Normally data are collected from auction houses and secondary market. Considering artwork is acknowledged as heterogeneous and illiquid, developing art price indices is relatively more difficult and problematic compared to traditional standardized investment products. Three main methodologies are
14
proposed and widely adopted to overcome these obstacles. In the following subsection, each method is discussed, underling the advantage as well as limitations.
2.1.1 Repeat-Sales Regression (RSR)
Introduced by Anderson (1974) from real estate elevation, repeat-sales regression is also known as “double sales method”. It is based on gross investment return and price pair of the same paintings. By regressing the price change of each observation on a bundle of dummy variables, single price change is aggregated then price indices for all the observations in each time interval are developed.
The main advantage of the RSR is that it largely overcomes the quality difference of each artwork, which means the obstacles of quality specification and measurement are bypassed during the indices construction. It is suggested that when the number of repeat-sales pairs is large and the time frame is longer than 20 years RSR is a more favorable mean (Ginsburgh et al, 2006).
The major disadvantage of RSR method is it significantly narrows down the sample size since a prerequisite of this method is the observed painting has to be sold at least twice during a time interval. The restricted sample choice further leads to selection bias which mainly comes from the following concerns: first, Holub et al. (1993) comments that principally when re-sale period is long, for example, longer than twenty years, the latter sales tend to be omitted. Second, Horowitz (2010) points out that there exists an upward bias in price indices estimation since successful transactions are likely to happen when a seller or auction house perceives higher return. In other words, only those works added in value are shown in the repeat sales. Selection bias, to some extent, makes the results less representative for the whole market. (Goetzman, 1993 and Ginsburgh et al, 2006)
15 2.1.2 Hedonic Approach
Hedonic technique is proposed to adjust the difference in quality among artworks. It is based on the assumption that value of artwork is determined by several characteristics with an implicit price (Ginsburgh et al, 2006). Artwork prices can be split up into different implicit prices reflecting those standardized and non-temporal heterogeneous features, also known as hedonic attributes. Main hedonic attributes are considered to be the size, provenance and medium of artwork, artist’s status and signature and sales or re-sales records offered by the auction house (Horowitz, 2010; Collins et al., 2009). The idea of the hedonic approach is to control the hedonic attributes and capture the price alteration during a time interval. In a hedonic regression, an art price index is constructed on the residuals of regression between artwork price and hedonic attributes.
One of the advantages of the hedonic approach to constructing art indices is that all sales data are included when proceeding estimation. Unlike repeat-sales regression, those artworks with only one selling record can be included into the hedonic approach. Therefore, hedonic regression covers more sales records than repeat-sales regression. Additionally, since the hedonic elements are identified and separated in the regression, the approach allows further investigation on how different characteristics affect the value of an artwork (Chanel et al, 1996). Comparisons between repeat-sales regression and hedonic methods have been conducted by Chanel et al (1996). Results show that there exist discrepancies in estimated results between different methods. However, discrepancies tend to decrease as the time interval becomes long enough. Ginsburgh et al. (2006) finds out that when sample size is small, hedonic approach is able to give more adequate estimation than repeat-sales regression.
The main challenge of the hedonic approach lies in the determination of hedonic characteristics. Results vary according to individual knowledge and arbitrary choice.
16
Some scholars even argue that true quality is never captured precisely by hedonic characteristics (Pesando and Shum, 2008).
2.1.3 Naïve Price Indices
Naïve price indices are constructed by average price or geometric mean of the sample. Different from a simple average of artwork price, geometric mean shows a central tendency of a set of data, thus gives better reliance in representing market performance of a certain school of art in a given time period. Stein (1977) and Renneboog and Van Houtte (2002) are the representatives of conducting naïve price index method in the empirical research.
Main advantage of this method is that it includes all sales data and is easy to manage. It is applicable when the price movement tends to be stable over time.
Biggest drawback of the method is that it ignores the heterogeneous nature of artworks and assumes that they are close substitutes for each other. It is problematic that the indices reflect changes of heterogeneous elements rather than price movement brought by demand and supply. Kraüssl and van Elsland (2008) comment that naïve price indices tend to magnify the price movement where masterpieces exist, leading upwards bias in estimation.
In conclusion, the strong and weak points I stress in different estimation method demonstrate that the perfect method does not exist.
2.2 Art Investment: Return Rate and Risk 2.2.1 General Review
17
when Reitlinger (1961, 1963 and 1970) published his three-volume compendium The Economics of Taste. In his studies Reitlinger encompasses 5,900 auction sales data from 1760 to 1960, laying foundation for following empirical study. Based on Reitlinger’s data, systematic studies on profitability of artwork investment are carried out by early scholars (Anderson, 1947; Stein, 1977 and Butler, 1979). In the context of great art boom, publication of Baumol’s (1986) work is considered to be the starting point of growing interest in art investment among academics. Different from the first wave studies right after Baumol’s work (Frey and Pommerehne, 1989; Goetzmann, 1993), a growing number of researches turn to look into the return rate in different sub datasets divided by time period, schools or countries (Buelens and Ginsburgh, 1993; Mok. et al., 1993; Agnello and Pierce, 1996; Higgs and Worthington, 2005). As regional art markets continue to grow, a new trend in academic field turns to focus on regional markets (Mok, et al, 1993; Agnello and Pierce, 1996; Agnello, 2002; Renneboog and Van Houtte, 2002). Summary statistics of artwork investment performance from 17th to 21st centuries are provided in Table 2.1.
2.2.2 Representative Studies
In this subsection, representative research on return rate and risk of artwork investment is discussed to give in-depth knowledge of empirical findings.
Combing data from Reitlinger (1961, 1970) and Mayer International Auction Records (1971), Anderson (1974) undertakes research on yielding rate of oil paintings as well as elements contributing to the price movement. By constructing hedonic price indices from 1780 to 1960, Anderson estimates a nominal annual return rate of 3.3% and discovers that variables such as time, size, and artist’s status have significant influence on price. By controlling the quality difference in the time period between 1653 and 1970, Anderson performs repeat-sales regression and estimates a
18
nominal annual return rate of 4.9%. In the meanwhile, he finds that those lower price paintings tend to achieve a higher return than those expensive ones. Considering art return rate substantially underperforms the common stock, Anderson concludes that unless the consumption value of artwork investment is taken into account, yielding of painting will not be attractive to investors.
Controlling for a fixed underlying distribution, Stein (1977) develops geometric mean price indices on auction records of the works whose artists die before 1946. He estimates annual nominal return rate of 10.47% on the US market and 10.38% on the UK market during the time period 1946- 1968. After comparing the financial asset, artwork investment again yields a lower return. Corresponding to the consumption value issue raised by Anderson (1974), Stein classifies the benefits of artwork investment into two parts: monetary return and “viewing pleasure”. He uses renting payment to measure the “viewing pleasure” and estimates a gaining rate of 1.6% annually. Even taking the “viewing pleasure” into account, Stein concludes that artwork investment with high risk is still not lucrative enough to outperform the stocks and bonds.
On refining Anderson’s (1974) study, Baumol (1986) constructs a data set of transaction prices of the best known art works from 1652 to 1961 in London. Using repeat-sales regression, result shows an annual return of 0.55% in real terms with high risk. Statistics also reveal that art price fluctuates and floats rather aimlessly. Therefore, Baumol concludes that there is little evidence showing that art investment generates profit for investors in the future.
Revisiting Baumol’s study, Frey and Pommerehne (1989) enlarge the data set by extending the time period to 1987 and including auction sales from European countries. In addition, they further eliminate the previous limitation by accounting transaction cost in return estimation. Applying repeat-sales method, Frey and
19
Pommerehne estimates an annual real return rate of 1.50% for the entire period, which is again much lower than traditional financial investment. The authors agree with Baumol that artwork investment is less attractive for investors.
In contrast to mainstream findings that artwork is an inferior investment comparing to conventional financial assets, Goetzmann (1993), Buelens and Ginsburgh (1993) and Mei and Moses (2002) are the few exceptions that hold an optimistic opinion. Applying repeat-sales regression on a combination of data from Reitlinger and Mayer International Auction Records, Goetzmann estimates an average annual return rate of 3.2% during 1716-1986, which is higher than the stock return but still lower than bonds. He further claims that artwork investment can achieve a high return rate in the long term. Buelens and Ginsburgh (1993) revisit Baumol’s study and reconstruct the dataset by including those resale records separated more than 20 years. To give a better estimation, Buelens and Ginsburgh divide the data into different schools time periods and examine the return rate respectively. Results show that except the period of war and general insecurity, paintings achieve higher return rates than financial assets. Another sound conclusion in this study is that hedonic approach and repeat-sales method produce comparable results in return rate estimation. This finding contributes a lot to empirical study since hedonic approach offers advantage of including much larger data sets, which can be an ideal choice when sample size is limited. Unlike previously research, Mei and Moses (2002) construct a completely new data set by assembling sales records in New York Public Library and Watson Library at the Metropolitan Museum of Art in the period of 1875-1999. Adopting repeat-sales regression, Mei and Moses develop general price indices as well as 4 school indices (American, Old Master, Impressionist and modern paintings). For the entire period, an annual real return rate of 4.9% is estimated which is outperforming certain fixed-return securities while underperformed stocks.
20
to various regional markets. Among them Mok, et al (1993), Agnello and Pierce (1996), Agnello (2002) and Worthington and Higgs (2006) are representable ones in terms of data choice, method and fruitful outcomes. Since my research target is the Chinese market, I will not go deeply into other regional markets here, but summarize results of these studies are presented in Table 2.1. For a detailed discussion on Chinese fine art investment, see section 2.4.
21
Table 2.1 Estimated Fine Art market performance as reported by various academic papers
Authors Sample
(number of works)
Dataset Period Method
(index) Annual nominal rate of return on art Annual real rate of return on art Standard Deviation
Anderson (1974) Paintings in general# Reitlinger’s dataset 1780-1960 1780-1970 1653-1970 Hedonic RSR RSR 3.3% 3.7% 4.9% 2.6%* 3.0%* Stein (1977) Paintings in general# Author
elaboration 1946-1968 Average price (Geometri c mean) 10.47%
Baumol (1986) Paintings in general(640 repeat sales) Reitlinger’s dataset 1652-1961 RSR 0.6% Frey and Pommerehne (1989) Paintings in general(1,198 repeat sales) Reitlinger’s dataset 1635-1987 1635-1949 1950-1987 RSR RSR RSR 1.5% 1.4% 1.7% 5.00% Ginsburgh and Schwed (1993) Flemish-Dutch, French, #
Italian Old Master drawings Author elaboration 1980-1991 Hedonic 10.5% 14.0% 9.0% Buelens and Ginsburgh (1993) Paintings in general(1,111 repeat sales) Reitlinger’s dataset 1700-1961 1780-1970 Hedonic RSR 3.70% 0.91% 3.00%*
22
Authors Sample
(number of works)
Dataset Period Method
(index) Annual nominal rate of return on art Annual real rate of return on art Standard Deviation Goetzmann (1993) Paintings in general(3,329 repeat sales) Reitlinger’s dataset 1716-1986 1850-1986 1900-1986 RSR RSR RSR 3.2% 6.2% 17.5% 2.0% 3.8% 13.3% 5.65% 6.50% 5.19% Mok et al. (1993) Modern Chinese
paintings (20 repeat sales) Author elaboration 1980-1990 Geometric RSR 52.9% 71.8%
Pesando (1993) Modern prints # Picasso prints Author elaboration 1977-1992 RSR 1.51% 2.10% 19.94% Agnello and Pierce
(1996) 19th-century American paintings(15,216) Author elaboration 1971-1992 1971-1979 1980-1992 Hedonic 9.3% 6.3% 14.3% 3.25%
Chanel et al. (1996) Paintings in general# Author elaboration 1780-1970 1855-1969 1855-1969 RSR Hedonic RSR 3.70% 3.0% 4.90% 5.00% Fase (1996) 19th Century European
paintings# Author elaboration 1946-1966 1972-1992 1982-1992 Modified composite (basket) 11.0% 10.6% 8.6% 7.5% 1.1% 2.9% Goetzmann (1996) Paintings in general# Author
elaboration
1907-1977 RSR 5.0%
Pesando and Shum (1996)
Picasso prints# Author elaboration
23
Authors Sample
(number of works)
Dataset Period Method
(index) Annual nominal rate of return on art Annual real rate of return on art Standard Deviation
Agnello (2002) American paintings# Author elaboration
1971-1996 Hedonic 4.2% -1.2% Mei and Moses
(2002)
American,
Impressionist and Old Master paintings(4,896 repeat sales) Author elaboration 1875-1999 1900-1999 1950-1999 1977-1991 RSR RSR RSR RSR 4.9% 5.2% 8.2% 7.8% 4.28% 3.55% 2.13% 2.11% Goetzmann and Spiegel (2003) Contemporary,
Impressionist and Old Master paintings# Author elaboration 1985-2003 Repeat sales -1.2%
Candela et al. (2004) Modern and Contemporary, 19th Century,
Old Master paintings#
Author elaboration 1990-2001 Quality-ad justed price 2.52% 1.80% 2.06% Edwards (2004) Latin American
paintings# 1981-2000 Hedonic 9% Hodgson and Vorkink (2004) Canadian paintings (12,821) Author elaboration 1968-2001 Hedonic 7.6% 2.3% Worthington and Higgs (2004) Paintings in general# (6 sub-markets) 1976-2001 Average price 3.03%/ 2.54% Campbell (2005) Paintings in general,
American paintings# Author elaboration 1976-2004 1976-2004 Average price Average price 6.11% 8.16% 1.44% 3.66% 8.27% 8.73%
24
Authors Sample
(number of works)
Dataset Period Method
(index) Annual nominal rate of return on art Annual real rate of return on art Standard Deviation Higgs and Worthington (2005) Australian paintings (37, 605) Author elaboration 1973-2003 Hedonic 6.96% 0.40% Campbell (2008) Paintings in general# 1980-2006
1990-2006 2000-2006 Average price 6.56% 1.26% 3.56% Worthington and Higgs (2006) Contemporary Australian paintings# Author elaboration 1973-2003 Hedonic 4.82% Kraüssl and van
Elsland (2008) Zhao and Huang (2008) German paintings in general# Chinese paintings in general (482 repeat sales) Author elaboration Author elaboration 1985-2007 1994-2007 2-step Hedonic RSR 3.8 % (in$) 1.3 % (in €) 10.1% 5.03%
Source: Own elaboration. on studies above as well as Ashenfelter and Graddy (2003)
*Real returns estimated additionally by Ashenfelter and Graddy (2003)
#
25
2.3 Correlation with Financial Markets
Besides return rate and risk, attention has also been drawn to investigate the correlation between the art market and other markets in the academic field. Researchers are motivated to see whether artwork is eligible enough to enhance the diversification of investment portfolio (for more detailed discussion on portfolio theory see Chapter 3).
Opinions on whether art is superior vehicle for diversification purpose are mixed. Researches leaded by Goetzmann (1993), Goetzmann and Spiegel (1995), Chanel (1995), Tucker et al. (1995) and Pesando and Shum (2008) reveals that the stock market has a strong influence on art price movement. Consequently, a strong correlative relationship between financial market and art market is detected. Therefore, these authors believe that artwork adds little value in diversifying investment portfolio.
Goetzmann (1993) performs correlation analysis between art and financial market during 1716-1986. By comparing art return with return of UK stock and bond, Goetzmann estimates correlation rate of 0.78 and 0.54 respectively, showing a relatively strong correlative bond between two markets. In addition, statistics also indicate that in the period of 1900-1986 there exists a strong lagged relationship between art and growth the share price in London Stock Exchange. Subsequently, the author concludes that art is a poor vehicle to be included into an investment portfolio.
Chanel (1996) confirms Goetzmann’s findings. Based on Reitlinger’s data in the period of 1855-1969, Chanel observes a strong causal relationship between stock and art market. He suggests that the bull stock market is the sign of capital flow towards art market since investors tend to re-allocated the gains of financial market to art investment. He further claims that the time lag between the stock market and the art market is approximately one year.
On the contrary, studies carried out by Pesando (1993), Tucker, Hlawischka and Pierne (1995), Mei and Moses (2002), Campbell (2005, 2008), Campbell and Pullan
26
(2006) and Horowitz (2010) detect relatively low or even negative correlative relationship between the financial market and the art market, holding favorable attitude towards art diversification.
Pesando’s (1993) study on art price of modern prints between 1977 and 1992 shows that the art market exhibits low correlation (0.3) with the stock market and a negative correlation (-0.73) with bond market. He concludes that art assets could be included into the investment portfolio to enhance benefit by reducing the risk of portfolio. In addition, he demonstrates that an optimal investment portfolio with 6% in art and 94% in bonds can gain a higher return rate on the same level of risk than a portfolio without art. However, Pesando clarifies that art is not suitable for those investors who expect a return rate exceeding 3% from portfolio.
Tucker, Hlawischka and Pierne (1995) use Sotheby indices in 1981-1990 for estimating return on art and test the correlative relationship with stock, bond and gold. Statistics show that art exhibits a negative correlation with stock and bond and a relatively low correlation with gold. Using Mean-variance model, authors construct an optimal investment portfolio: art (36.49%), government bonds (55.62%) and stock (7.89%). Results show art is an ideal vehicle for diversifying an investment portfolio.
On refining his previous studies Campbell (2008) enlarges the art index data set by combing Mei & Moses All Art Indices and Art Market Research Indices. In order to better reflect the violent price movement of the art market, Campbell conducts desmoothing process on art indices. What’s more, he diversifies the proxy price indices for financial market by including Morgan Stanley Capital Indices, Lehman Brothers Aggregate Corporate Bond Index and North American Real Estate Investment Trust Index. In the period of 1980-2006, the results show that correlation coefficient remains rather low between fine art and financial market and suggests a proportion of 21.43% for art in an optimal portfolio. In conclusion, Campbell confirms the diversification potential of art investment in portfolio management.
Distinguished from above studies, Worthington and Higgs (2004) hold back permissive attitude on art in portfolio diversification even though they detect low correlation between artworks and financial assets.
27
Worthington and Higgs (2004) employ art indices from Art Market Research in the period of 1976-2001, encompassing art markets on Contemporary Masters, French Impressionists, Modern European, 19th Century European, Old Masters, Surrealists, 20th Century English and Modern US paintings. By comparing the financial market comprising US Treasury bills, corporate and government bonds and small and large company stocks, the authors find a low correlation of returns between art markets and financial markets. However, while low correlation tends to suggest portfolio diversification potential for art, the result of Mean-Variance Model shows that no diversification benefit is added by including art into an investment portfolio. Worthington and Higgs suggest that this might be due to the fact that risk-return attributes of art are rather inferior to financial assets.
2.4 Chinese Art Market
Since the Chinese art market is emerged at an accelerated speed, transaction data is rather dispersed and inadequate. Few empirical studies can be found. Mok et al (1993) and Zhao and Huang (2008) are the most representative ones.
Mok et al. (1993) use Sotheby’s and Christie’s auction records during 1980-1990 to study financial performance of Chinese modern painting market. Among 4000 auction sales records, 20 paintings which have been sold twice are selected as the sample of artwork return estimation. To measure return-risk attributes of three regional financial markets, authors employ Singapore’ s Strait Time Market Index (STI), Hong Kong’s Hang Seng Stock Market Index (HSI) and Taiwan’s Weighted Index (TWI) as proxies. In the study, the authors estimate an average yielding rate of 52.9% on art, outperforming the HIS and STI but undeforming TWI. While taking risk into consideration, art investment significantly underperforms three financial markets (STI:1.9559; HIS:1.333;TWI:1.4036) with a return rate of 0.7368 per unit risk. In addition, with an average holding period of shorter than 4 years the study indicates a strong speculative attribute in investing in Chinese paintings.
Zhao and Huang (2008) collect sales records of 482 Chinese paintings which are sold more than once from auction houses in China. Using repeat-sales regression, the authors construct a series of semiannual art indices from 1994 to 2007 and estimate
28
an average return rate of 10.1% with 5.03% standard deviation, which outperforms stock market during the same period (average return rate: 8.01%; standard deviation: 22.5%). What’s more, a negative correlation (-0.51) between the art market and the stock market is detected, suggesting an opportunity of portfolio diversification on Chinese artwork. The authors further construct an optimal investment portfolio with 82% artwork and 18% stock, with an inflation element taken into consideration. Since the transaction cost of art investment is neglected, the authors suggest a higher proportion which ranges between 85% and 90% in art after including transaction cost. Again, the authors discover that Chinese art market exhibits strongly speculative with 2.5 years in average holding time.
29 3 Portfolio Diversification
Since one of my research questions is to figure out how Chinese contemporary art fits into an investment portfolio, diversification attributes of Chinese contemporary art need to be defined and measured. The purpose of this chapter is to lay out a theoretical basis for discussing the portfolio diversification as well as constructing an optimal investment portfolio.
Concepts as portfolio diversification, Mean-Variance optimization and the efficient frontier help investors evaluate the tradeoff between risk and return and offer potential means of minimizing risk while maximizing return towards investment portfolio. The following subsections discuss each of these building blocks.
3.1 Modern Portfolio Theory
First introduced by Harry Markowitz in his paper “Portfolio Selection” in 1952, Modern Portfolio Theory provides a theoretical framework for assets allocation, within which investors make sensible decisions on what assets to include and in what proportion.
Assets allocation begins with portfolio construction, which is known as the old adage ‘don’t put your eggs in one basket’. In practice, investors spread their money on different holdings in order to bring down the risk of lost when betting on only one holding. In the meanwhile, they also tradeoff between risk and return of different holdings to get higher collective return within the risk they are prepared to take. This insight leads to two key assumptions on which the Modern Portfolio Theory is built (Markowitz, 1952):
All investors are rational and accept risk commensurate with return.
All investors are risk averse and always to optimize investment choice by maximizing return while minimizing risk.
According to Modern Portfolio Theory, three main factors determine the choice of asset allocation: expected return, risk of individual asset class and the correlation of
30 return movement between any two asset classes.
3.1.1 Expected Return
Expected return is the future return of an asset predicted by investors. It shows the central tendency of return earned by an asset class. Generally, the expected return is calculated based on past, historical mean return of an asset class, with appropriate adjustments on supply-demand factors and investors’ expectation (Darst, 2008). Portfolio expected return is the weighted average of return on each asset class. The weight of an individual asset is the fraction invested in a portfolio.
3.1.2 Risk
The risk of an asset class measures how much the actual return deviates the expected return. Statistically, standard deviation is used to measure the variability or volatility of actual return series around the expected return. In general, higher standard deviation of an asset class return implies higher possibility that the actual return will differ from expected return, thus indicating higher risk of holding such asset class. Theoretically, risky asset tends to have a higher return, since investors need to be compensated on higher risk. Investor tradeoffs between risk and return based on individual risk aversion characteristics. According to theory, portfolio risk is the function of square of individual proportion invested and variance on individual asset. As number of component assets increased, proportion of each asset class is decreased as well as the portfolio risk. When number of component asset goes extremely large, the portfolio risk can be significantly reduced (Edwin, 2011).
3.1.3 Correlation
Correlation measures the degree of association between return movements of two asset classes. Positive correlation means the return moves the same general direction from each other at the same time. While negative correlation indicates that the return goes oppositely with each other. A zero correlation implies that returns of two asset classes are unrelated to each other. One of the main contributions of Modern Portfolio Theory is that it points out that portfolio risk is reduced not merely through an
31
increased number of asset classes but through including various distinct patterns of returns by different asset classes, which is known as portfolio diversification (Darst, 2008). Diversification helps to reduce the risk exposure of individual asset class and the same portfolio expected return while reducing the risk. Not perfectly positively correlating with other components within portfolio indicates the potential diversification attribute of a certain asset class (Shipway, 2009).
In a word, Modern Portfolio Theory describes that how the risk and return characteristics of a portfolio can be derived from those of individual asset class. It models the asset allocation decision that aims at selecting a collection of investment assets to minimize the collective risk for a given level of expected return. By examining expected return, risk and correlation of each asset class, Modern Portfolio Theory explains the best way to diversify a portfolio.
3.2 Mean-Variance Model
Mean-Variance Model is the quantitative method of calculating optimal risk and return of a portfolio. In other words, through optimization technique, investors can project and simulate the highest possible expected return of an investment portfolio for a given level of risk or, alternatively, to carry the lowest degree of risk for a given level of return.
Assumptions of Mean-Variance Model are presented as follows (Darst, 2008):
The investor’s primary objects are to maximize return and minimize risk;
Asset returns are normally distributed;
Standard deviation is a reasonable measure of the risk of an asset;
The correlation coefficient of two assets’ returns describes the relationship between the pair assets;
All taxes and transaction costs are ignored;
All component assets can be divided into any size.
For an investment portfolio p which is consisted with N component assets, formulas of return and risk for the portfolio are stated as follows:
32
𝑅𝑝 = 𝑅̅̅̅̅𝑝=∑𝑁𝑖=1𝑋𝑖𝑅̅𝑖
σ𝑝2 =Var (𝑅
𝑝) =∑𝑁𝑖=1∑𝑁𝑗=1𝑋𝑖𝑋𝑗𝜎𝑖 𝜎𝑗𝜌𝑖𝑗
Where 𝑅𝑝 is the return of portfolio p; 𝑋𝑖 , 𝑋𝑗 is the proportion of asset i and j allocated in the portfolio; σ𝑝2 is the variance of portfolio p; 𝜎𝑖 , 𝜎𝑗is the standard deviation of asset i and j ; 𝜌𝑖𝑗 is the correlation coefficient between asset i and j.
Find optimal portfolio by minimizing the portfolio variance at given level return:
Min σ𝑝2=∑𝑖=1𝑁 ∑𝑗=1𝑁 𝑋𝑖𝑋𝑗𝜎𝑖 𝜎𝑗𝜌𝑖𝑗
Subject to the following constraint:
s.t { 𝑅𝑝 = 𝛿
∑𝑁𝑖=1𝑋𝑖 = 1
Where 𝛿 is given level of portfolio return.
3.3 Efficient Frontier
With a certain value of portfolio return, Mean-Variance Model identifies a minimum portfolio risk, which refers to portfolio standard deviation (square root of portfolio variance). The collection of optimal return and risk of a portfolio are plotted and generates a curved line known as the Efficient Frontier. Whether portfolio A is better than portfolio B on the Efficient Frontier depends on the investor’s risk tolerance and desire for increased return (Darst, 2008).
The degree of curvature of the Efficient Frontier is determined by the correlations of each pair component assets; as well as the number of individual assets included in the portfolio (Edwin, 2011).
33 4 Chinese Contemporary Art Market
To provide an adequate background for the study of Chinese contemporary art investment, an overview of Chinese contemporary art market is presented. Through the following subchapters readers can have a general understanding of Chinese contemporary art history and the market performance of the past ten years.
4.1 History and Development
It has been widely accepted that Chinese contemporary art merged in late 1970s, with the symbol of the first unofficial art exhibitions held in public in mainland China (Hung, 2010). In contrast to official art, which is created by artist with revolutionary ideology and used as political propaganda, unofficial art is produced by a new artistic generation who saw themselves as cultural pioneers, fighting for social reform and rebelling against the past (Sullivan, 1999). During 1984 and 1986, the appearance of unofficial art groups across 23 provinces in mainland China was recognized as the ‘85 New Art Wave’ in Chinese contemporary art history (Hung, 2010).
In the context of economic reform and open door policy in 1980s, Chinese contemporary art witnessed important developments. Along with open policy and economic prosperity, post-war western art was introduced into China and placed significant influence on the younger generation of Chinese contemporary artists. In seeking artistic independent and self-identity, new groups such as the New Wave, Shanghai Artists Group and New Space Group are established. In the same time, various art movements such as Scat Art, School of Realism, and Chinese Abstraction were conducted, taking Chinese contemporary art into flourished period (Sullivan, 1999).
Owing to the first batch of prominent overseas Chinese artists who gradually gained their recognition in the international art market, Chinese contemporary art was introduced to western art community (McAndrew, 2009). As more and more Chinese artists are accepted by international audiences, an increasing number of exhibitions featuring Chinese avant-garde artists were held by Hong Kong, Taiwan and western curators. Early 1990s saw the globalization of Chinese contemporary art. From 2000
34
to now, Chinese contemporary artists continuous fetch a high price in international auctions, attracting attention world widely (Zhao, 2008).
4.2 Market Performance of Chinese Contemporary Art from 2004 to 2012
Beneficial to global art market boom beginning in the early 21st century, Chinese contemporary art market grew at an accelerate speed and developed faster than any other art market (Artprice, 2007). In 2004, due to notable high auction turnover, China was first recognized as one of the major emerging market in the global art market by Artprice. Signed by the surge in the price, boom of Chinese contemporary art started.
2005 was the year when contemporary art and photography became most popular in global art auctions. The price of contemporary art and photography increased 12.5%, much higher than any other segments in terms of auction records (Artprice 2006). In the period from 2005 to 2007, Asian art market’s rapid growth shifted the global art market motor from West to East. In 2007, China first replaced France for the third place in the global fine art auction market. With overall rise in price, Chinese contemporary art stepped into a staggering period: in 2006, 10 best auction prices increased more than 10 times in the previous year. With eight Chinese artists ranking in top 20 contemporary artists, Chinese artists began to exceed western artists in terms of value and fame (Artprice Asia, 2009/2010).
While contemporary art is by nature of ‘hot’ market, the constant up going price attracts many speculators who reallocate capital from the stock market and property to reap speculative benefit in the art market. As more and more ‘pure investors’ accumulated in the art market, speculative bubbles in contemporary art continued to grow until it plugged from the peak contaminated by the global financial economic crisis. According to Artprice Asian Contemporary Art Market Report 2009/2010, the price index for Chinese contemporary art increased 500% from 2004 to 2008 and suffered significant shrink after hit by the global financial crisis. In 2008 and 2009, Chinese contemporary art lost 63% of its auction revenue.
35
While western auction houses are trapped by financial crisis, with strategic sales tactics Chinese auction houses showed strong market performance and recovered at a faster speed than anywhere else. In 2010, taking up a share of 33% of global fine art market, China ranked at the first art marketplace by taking down the United States, which had been the grand master of the global art market since 1950s. Excellent market performance has also been seen in Chinese contemporary art. In the first half year of 2011, China generated 41.6 percent of global sales, overtaking the United State and becoming the leading market for contemporary art auctions (Artprice Asia, 2010/2011).
Influenced by reduction liquidity and change of macro-economic policy, Chinese contemporary art auction sales decreased by 37.14% in 2012, signing the end of 3 year continuous boom. However, in view of the art market monitors the cooling down in Chinese contemporary art market should be seen as an opportunity instead of market shrink since the market is experiencing rational restructuring of sales pattern. A series of regulations is being undertaken by Chinese Government, aiming to readjust the artificially inflated price and lead the market towards a general stabilization (Artprice, 2012).
Figure 4.1 Auction turnover and number of lots of contemporary art in China, 2000-2011
36 5 Data and Methodology
5.1 Data
To measure financial performance of Chinese contemporary art, this paper employs a new data set of artist indices, based on which return rate and risk of Chinese contemporary art is estimated. Data is semi-annual since China art auction sales are held in Spring and Autumn season every year. Stock, bond and gold are selected as comparable financial classes and component assets for investment portfolio. Considering data sets for constructing bond market index are only available from 2003, all data sets employed in the paper start from 2003 in order to be comparable. The observation period covers the years between 2003 and 2012.
5.2 Artist Index
Due to the fact that price index solely concerning Chinese contemporary art is not available at the time I am performing my research, I decide to construct a new data base for estimating contemporary art return. Data collection on Chinese contemporary art market appears to be a real challenge. Since the segmented market has not been investigated intensively, data is not available or just closed for public approach. Having looked up from all public sources through various ways, I target Artist Index in Artron.1
Artron is a leading research center dedicated to monitor and analyze Chinese art market. Based on China’s first and most comprehensive database, Artron index is the most widely used art index on Chinese art market, covering all domestic auction sales records from 1993 till now (Artprice, 2012). In 2000, Artron began to release artist index of Chinese modern and contemporary art. By now, number of sample artists reaches 576, not only including the most influential modern and contemporary artists in China but also covering all schools and material. Artist index is calculated based on the average price per square feet of a certain artist across major domestic and Hong
1
37 Kong auction sales2 in every auction season.
The artist index is comprised of Chinese modern and contemporary artists. Due to the research subject of this paper, I first exclude the modern artists from the dataset in order to get a sample of contemporary artists. However, there exist different opinions on defining Chinese contemporary artist. According to western academic view, contemporary art refers to those artworks created by artists who were born after 1945. However, China’s contemporary artistic transition was suspended by political and social upheavals in 1960s. It was until 1970s when Chinese contemporary art emerged (Hung, 2010). Undergoing a delayed modernization period, many young artists during 1960s and 70s still saw their practice as modern art. According to China art historians, modern Chinese art began in the first and second Opium Wars (1839-1842, 1856-1860) when Chinese art underwent intense contact with the western world. Modern Chinese art continued to develop and covered the period of republican (1911-1949) and Maoist years (1949-1976).3 Different boundaries on dividing modern and contemporary art between China and the west increase the difficulty in selecting sample artists. Since a comprehensive list of modern Chinese artists is not available, I take two steps to exclude modern Chinese artist from Artron artist indices. First I refer to the top 50 modern Chinese artists in 2012 Autumn Auction Report offered by Artron. I exclude those artists in the list of top 50. Then, I further exclude the artists who were born before 1945 among the rest. By these two steps, I largely remove the price effect made by modern artist indices and get ready for further selection of basket artists.
After selecting artists for contemporary art, a sample for estimating market return and risk needs to be constructed. In order to get a sample pool which can be compared
2
Auction houses list: Beijing Poly international, Beijing ChengXuan, Beijing HanHai, Beijing Huangchen,Beijing Kuangshi, Beijing Rongbao, Beijing Yongle,Chieftwon Auction, Guangzhou Huangyi,Shanghai Duoyunxuan, Shanghai Hongsheng, Shanghai Tianheng, Shanghai Daoming, Xilian Auction, Ravenel Auction, Sungair International, China Guardian, HK Christie’s, HK Sotheby’s. Retrieved from:
http://amma.artron.net/index_detail.php#yb, Jun 13th, 2013. 3
Source retrieved from: http://library.stanford.edu/guides/chinese-art-modern-and-contemporary, Jun 26th ,2013.
38
across different time period, artists in the sample list should have continuous transaction records in each auction season. Thus, I filter the artists with at least one lot sold in each auction season. Finally, I get a dataset of 201 artists with total 194,601 lots traded in the period of 2003 -2012.
5.3 Financial Assets Index
In my research, stock, bond and gold are selected as proxies of financial assets. For stock, I choose Shanghai Stock Exchange (SSE) composite index as a proxy for China stock market, since it is the most widely used indicator to track price movement of the overall market. Developed on Dec.19th 1990, Shanghai composite index is capitalization-weighted index with a base value of 100, tracking daily performance of all A-shares and B-shares listed on the Shanghai Stock Exchange. In terms of bond market, I choose SSE corporate bond index as indicator. Shanghai corporate bond index is computed from the price of selected eligible corporate bonds with good representation from the domestic corporate bond market. The base day of SSE corporate bond index is Dec.31st, 2002. With base value of 100, the index is weighted by amounts of outstanding. The index was launched by the Shanghai Stock Exchange on Jun.9th, 2003. Besides, I use SEE government bond index as the proxy of risk-less asset. SEE government bond index is calculated on weighted average price of all government bonds listed on the Shanghai Stock Exchange. All listed government bonds mature over one year with fix interest rate. The base day of SSE government bond index is Dec.31st, 2002. With base value of 100, the index is weighted by amounts of outstanding and was launched by Shanghai Stock Exchange on Jan.2nd, 2003. As for the gold market, a composite index for China market is not available. Since most investors benchmark gold price in New York Commodity Exchange (COMEX), here I use gold index lunched by COMEX as indicator for China gold price.
To estimate the return rate and risk of financial assets, I employ closing price indices on the last transaction day of each month as data set. Data cover the time period of 2003-2012.
39 5.4 Methodology
My empirical research will be conducted with quantitative method. Return rate and risk of Chinese contemporary art investment will be calculated based on artist index derived from Artron. Return rate means semi-annual yielding rate of Chinese contemporary art investment and risk is referred to standard deviation of the return rate.
5.4.1 Estimate Return Rate of Chinese Contemporary Art
Calculate semi-annual return rate 𝑟𝑖,𝑡 by artist with commission fee, wealth tax deducted: 𝑟𝑖,𝑡={ 𝑃i,t×(1−𝑟)−𝑃i,t-1 𝑃i,t-1 × (1 − 𝑇), 𝑟i,t> 0 𝑃i,t×(1−𝑟)−𝑃i,t-1 𝑃i,t-1 , 𝑟i,t≤ 0
Where 𝑟𝑖,𝑡 is semi-annual return rate of the i artist in time period t; 𝑃i,t is the
artist index for the i artist in the time period t; r refers to the rate of commission fee in art auction. According to "2011 Performance Analysis of Chinese Auction Industry and 2012 outlook" released by the Department of Commerce and National Auction Association, the average rate of commission fee for Chinese Auction houses in 2011 is 11.8%. Considering previous data on commission fee rate is not accessible, here I take 11.8% for calculation; T is wealth tax rate for auction, here I take 20% for calculation according to Chinese tax law.
Get continuously compounded return rate 𝑅𝑖,𝑡,
𝑅𝑖,𝑡=log (1+𝑟𝑖,𝑡)
Assign a weight 𝑋𝑖,𝑡 to each compounded return rate :
𝑋𝑖,𝑡=𝑉𝑉𝑖,𝑡 𝑀,𝑡
40
total transaction volume for all selected artists in time period t.
Calculate semi-annual return rate for contemporary art market 𝑅𝑡:
𝑅𝑡=∑201𝑖=1𝑋𝑖,𝑡× 𝑅𝑖,𝑡
Reasons for adopting artist indices as data set and using weighted mean to estimate market return rate are presented as below:
On one hand, although Chinese contemporary art market is growing at an accelerate speed, relatively short observation time limits the development of market index targeting contemporary art. By the moment of my research, no well-rounded price index for contemporary art is available. Therefore, new data set has to be constructed. Considering Artron artist index is the only reliable second hand resource focusing on Chinese contemporary art, I adopt artist index as the main source for estimating market return.
On the other hand, while sample artists are given, with no access to collect subsequent successful repeat sales records for sample artists, attempt on using repeat sales regression has to be abandoned. What’s more, information for performing hedonic approach such as artwork dimension, style, technique and artist status is rather disperse and incomplete, which makes it less favorable for using the hedonic approach. With incomplete information and time constraint, using weighted mean method to estimate market return is the most feasible method. Based on 201 weighted values of representative artists with 194,601 total lots, weighted mean method is able to smooth the data series and gives relatively well reflection on market price tendency.
5.4.2 Estimate Return Rate of Financial Assets
∆𝑝𝑖,𝑡=ln𝑝𝑝𝑖,𝑡
𝑖,𝑡−1× 100
Where ∆𝑝𝑖,𝑡 denotes the rate of change of 𝑝𝑖,𝑡; 𝑝𝑖,𝑡 is the average value of monthly closing price indices of i financial asset in half year time interval. Since financial index is not available in semi-annual term, I use average value of every six monthly
41
closing price indices for proxy of semi-annual index of financial asset. In terms of transaction cost, considering the cost of trading financial assets, which is mainly consist of commission fee and stamp tax, takes no higher than 0.3% of transaction value, I neglect the cost while estimating the return rate of financial assets.
5.4.3 Mean-Variance Model
In Modern Portfolio Theory, given a certain level of expected return, a collection investment asset with a low or negative correlation mutually gives lower risk than any individual asset (Markowitz, 1952). In other words, if art investment results low or negative correlation with traditional investment asset then there exists positive evidence to include art into an investment portfolio. Accordingly, correlation test between art assets and financial assets will be performed. To further research to what extent Chinese contemporary art diversifies investment portfolio, I use Mean-Variance Model to construct the optimal portfolio. Before employing Mean-Variance Model, I need to make an assumption about expected the return distribute of asset classes. Since prediction for the future is based on historical distribute of returns, in my research, I use average return estimated during the period of 2003-2012 to proxy the expected return for all assets classes.
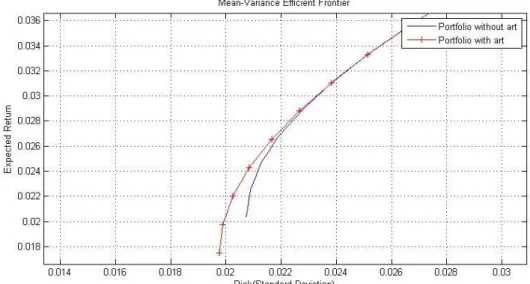
To get more straightforward comparison, efficient frontiers of portfolio without art as well as with art included will be plotted.
42 6 Empirical Result
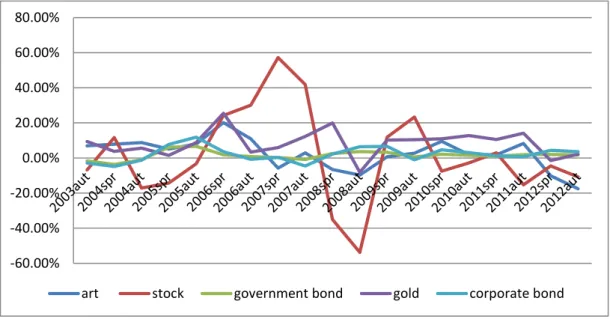
6.1 Return Rate and Risk
Table 6.1 shows semi-annual return rate of Chinese contemporary art and financial assets during the time period of 2003-2012 based on the data set and methodology mentioned in Chapter 5. To show the return rate in terms of tendency, Figure 6.1 is given. Simply seen from the graph, stock fluctuates most violently comparing to other assets.
Table 6.1 Summary of Semi-annual Return Rate, 2003-2012
Year Art Stock Government bond Gold Corporate bond
2003aut 6.97% -6.79% -1.67% 9.42% -2.86% 2004spr 7.83% 11.63% -3.76% 3.74% -4.80% 2004aut 8.82% -17.14% -0.90% 5.62% -1.28% 2005spr 5.06% -14.30% 6.15% 1.48% 7.75% 2005aut 7.92% -3.28% 6.66% 8.79% 11.81% 2006spr 20.15% 24.26% 1.79% 25.43% 3.55% 2006aut 10.90% 30.13% 0.75% 3.34% -0.77% 2007spr -5.76% 57.23% 0.28% 5.95% 0.40% 2007aut 2.98% 41.82% -0.88% 12.23% -4.54% 2008spr -6.59% -35.05% 2.50% 19.95% 2.25% 2008aut -9.72% -53.78% 3.70% -8.06% 6.46% 2009spr 0.68% 11.90% 3.24% 10.24% 6.67% 2009aut 2.70% 23.31% 0.56% 10.39% -1.05% 2010spr 9.45% -7.45% 2.14% 10.97% 4.66% 2010aut 1.81% -2.82% 1.54% 12.81% 3.10% 2011spr 1.81% 2.99% 1.05% 10.56% 1.21% 2011aut 8.22% -15.26% 1.88% 14.12% 0.67% 2012spr -10.17% -4.56% 1.98% -1.49% 4.36% 2012aut -17.53% -10.73% 1.72% 2.12% 3.51%
43
Figure 6.1 Return Performances of Art and Financial Assets, 2003-2012
Source: Own elaboration.
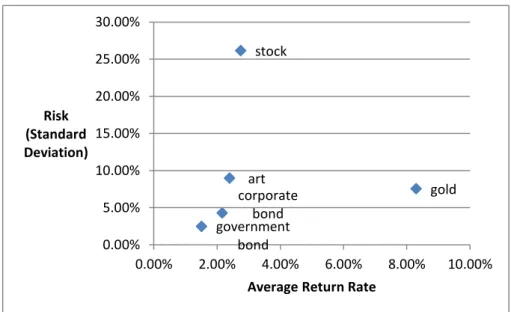
Table 6.2 reports the descriptive statistics of art and financial assets, by which we can have a comprehensive observation and comparison on performance of art and financial assets. On average, the auction of Chinese contemporary art brings a semi-annual rate of return of 2.4%, which is higher than return of government bond and corporate bond, whereas lower than return of stock and gold. Among them, gold market, with a return rate of 8.3% semi-annually, enjoys the highest return rate, which is over 5 times of government bond. Contemporary art achieves proximate level of return with stock and corporate bond, which generate semi-annualized return rate of 2.75% and 2.16% respectively. The positive financial return supports that Chinese contemporary art is beneficial capital assets.
-60.00% -40.00% -20.00% 0.00% 20.00% 40.00% 60.00% 80.00%