ISSN 1450-216X Vol.27 No.4 (2009), pp.620-627 © EuroJournals Publishing, Inc. 2009
http://www.eurojournals.com/ejsr.htm
Link Processing for Fuzzy Web Pages Clustering and
Classification
Amir Masoud Rahmani
Islamic Azad University, Science and Research branch, Tehran, Iran E-mail: [email protected]
Zahra Hossaini
Islamic Azad University, Science and Research branch, Tehran, Iran E-mail: [email protected]
Saeed Setayeshi
Islamic Azad University, Science and Research branch, Tehran, Iran E-mail: [email protected]
Abstract
Clustering and classification are two ways of arranging objects in related groups, according to their similarities, different groups, have different characteristics. Large volume of web pages in World wild web, need to be arranged in a way that make users comfortable, and clustering is an efficient way of grouping. Fuzzy as a flexible method could be used to find similarities, by means of membership functions. For web page clustering and classification, usually fixed size vectors of words/weights, become extracted from HTML form of web pages. Those kinds of vectors ordinarily are long and need so much time to process. To avoid this here, word are gathered from <a> tag, which gives shorter vectors, with most of useful information that could be obtained from other parts. These vectors have variable size. This method gives acceptable clusters and almost precise classes, with 89.76% precision rate, and also reduces processing time.
Keywords: Clustering, Classification, Fuzzy, <a> tag
1. Introduction
Clustering is an unsupervised method, that can finds hidden relations between data, and arranges them in internally related groups, and classification is a supervised method of grouping data in a way, that more similar elements come together in the same group [1], [2].
Excessive number of web documents need to be ordered in related groups to ease using them. Clustering and classification have been used in different approaches, for a long time to order, uncategorized data, K-means is a popular method of clustering, but it needs to knows the number of clusters a priori [8], [10]. Most of clustering approaches use fixed size vectors in their classifier [12], [13], which cost, long time for processing unnecessary elements, that have zero weight in representative vector. To avoid the problem, variable sized vectors are used in this application, so useless elements processing time will be bypassed.
A web page usually is shown with a vector structure, that become extracted from HTML form of the document [13], the vector consists of a series of word and a coefficient that is the frequency of the word in that document. Coefficient could be 1 or take a weight according to tags that a word appears on it [11], [13] or even could be size of document or etc. This is a good method but final vectors are still too long, so in order to have, shorter but still effective vectors, <a> tag is used. Since most of the times links show web pages, which have near concepts to current page, they can give useful vectors that are shorter, but do not decrease discriminating ability.
After all, a fast, precise clustering method is needed, and fuzzy is a complete match. Fuzzy is used for clustering in [5], [6], but those works used fixed size vectors, in [3] variable size vectors is used, but cluster centers are too long, and importance of appearance place of word does not considered.
In this paper, variable size vectors, which become extracted from <a> tag is used in a fuzzy clustering method, and it gives acceptable clusters and a low percent of misclassified pages. A data dictionary is used to avoid unrelated words, such as those, which come in advertisement links. Through the next sections the algorithm will be explained in details.
Sections arrangement is as following. In section 2 related concepts are explained, used algorithm and steps of this method will be explained in section 3 and section 4 is about experimental results and finally section 5 concludes the paper.
2. Related Concepts
2.1. K- means and ClusteringIn pattern recognition a group of related data is called a cluster. This kind of relationship usually is specified by a distance function. A data belongs to a group, when it has minimum distance with the center of that group.
K-means algorithm is a simple and effective method of clustering, and most of other methods are inspired by it. K-means algorithm starts with a random choose of a data as first cluster center, then finds other data distances from this center and clustered them in or out, according to their desistance from the center. Outer data are considered as new canters and the algorithm continues with those new centers until some conditions, such as a time limit, iteration number limit and so on.
2.2. Data Dictionary
Data dictionary is a pool of words, which let us prevent using unrelated words to a class, it could be useful to eliminate irrelevant words, such as those, which appear in advertisements and some parts of the page, that have other links. In this process for each class a sub dictionary is provided. Those sub dictionaries start with some related words to their category and during the learning process, high weight words will be added to them.
2.3. Fuzzy Logic
A fuzzy system is a rule based system that has a knowledge base inside, some if/else rules makes this knowledge base effective for different applications, so defining those rules is an important step.
The rules use some words that their values should be defined by membership functions, because they are linguistic words, and real world values need to be mapped on them. Fuzzy could be used for clustering, because, usually data that need to be clustered, do not distribute well, so structures could not be defined exact. Also by this way, a data could be clustered in different groups with different membership values.
3. Proposed Method
The clustering method consists of two main parts: first part is link processor and second, is fuzzy cluster maker.
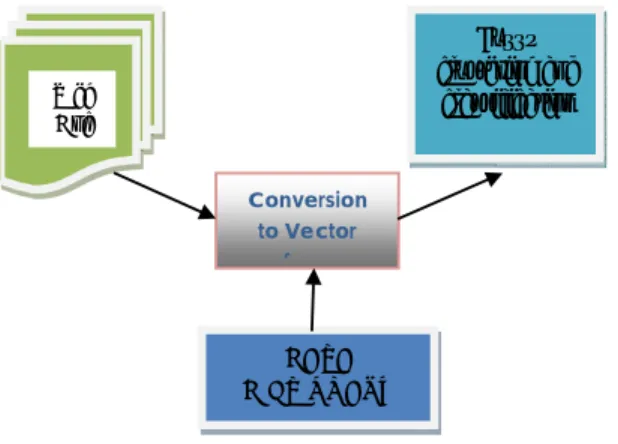
Figure 1: Diagram of clustering and classification steps
Conversion to Vector form Web Doc Fuzzy clustering and classification DATA DICTIONARY
Figure 1 shows a simple diagram of performed method, each part will be explained through this section.
3.1. Link Processor
First of all a web document should be converted to a processable structure, vector is a common and simple form that is used in different applications. These kinds of vectors consist of some words and their related weights, those words and weights, become extracted from HTML form of documents.
Weight, usually is the number of occurrence of word in a page or term frequency or TF, or could be TF divided by number of all words in the document, or other possible values [], it also could be multiplied by a value according to importance degree of the tag that the word appears in, for example words in <title> tag are more important than those in <p> tag. By using this way, the achieved vector could be too long, and take a lot of time to be processed, so it seems sensible to use a(some) tag(s) that gives a shorter vector, which still has most of necessary words. Most of the times <a> tags, make links to other pages, which have the same content as this page, or extra information about some important concepts, and they have valuable information about the subject of link in their structure, so by extracting this kind of information, a shorter but still useful vector could be constructed, and precision of process does not have perceptible decrease.
A link could be shown in some different ways, make an inner anchor, by means of a text, make a link to another page via a text or make a link via a picture.
1. <a href="#end">
This text is a link to a part on this page </a>. 2. <a href="http://www.somepage.com/">
This text is a link to a page on the World Wide Web </a>. 3. <a href="http://www.somepage.htm">
<img border="0" src="buttonnext.gif" width="65" height="38" alt= "a link"></a>.
In two first way, italic text shows subject and reason of link, and has some useful keywords, and in third one alt=”…” has some extra information about the subject of the link on the other hand <a> tag could have some explanatory properties such as name, title or id, which could give a lot of keywords.
<a href="../images/fuzzy.gif"
title="GIF image of a fuzzifier">
So after finding keywords, TF of each word will be calculated, and get weight. Weight of word/term i (ti) in document j is defined as following:
Wij=
α if ti is in title or name part of <a>tag
β if t i is in id part of <a> tag
γ if ti is in rel part of <a> tag
1 if ti is in descriptive part (>…<)
(1)
Where α , β , γ >1
For example suppose word “fuzzy” appears three times in <title> and 5 times in descriptive part so its weight become 3*α+ 5
Before finding TFs a data dictionary could be used to eliminate unrelated words. Data dictionary is constructed according to documents in a training set, and has been completed during the extraction process.
After this, all weighted TFs are become normal, Suppose p different words had been extracted from a document and ri is the number of appearance of word i in that document, or the word redundancy (TF), and R be the vector of ris then norm(ri) is defined as:
Norm(ri)= (ri-min(R))/(max(R) – min(R))
i=1:P (2) Then final vector is ready for entering to fuzzy part, to be clustered, the vector structure is
shown in figure 2.
Figure 2: Document vector structure after analyzing
t1j t2j … tpj
W1j W2j … Wpj
Length of each vector could be variable, so unnecessary appearance of words that are related to category but do not exist in documents can be ignored.
3.2. Clustering and Classification by Fuzzy Logic (CCFL)
K-means as a method of clustering, choose a random or some random data points as its first cluster center, and then finds the similarity between other data points and this centers, data point is placed in a cluster, which have the most similarity (or minimum distance) with its center. If the maximum similarity value that the point achieved be smaller than a threshold, this point will become a center in next run.
Similarity value could be found as a fuzzy membership value, because, this value could be supposed as an average function that has values between zero and one and it could be written in the form fuzzy if /else rules.
Suppose there are n web pages in our data set di is the ith document in vector form, which have
mi terms, and cj is the jth center that have lj terms, then distance between these two vectors could be
shown by equation 3 [11].
dist(di,cj)=1-[((nc*[∑k=1mi x(tk)*μ(tk)]r) / lj] (3)
Where nc is number of common words between document i and center j, x(tk) is importance degree of kth term in document j and μ(tk) is the frequency of word tk in cluster cj and r>0.
Equation 3 makes a S-shaped membership function for output values. So rules can be written in this way:
• If nc/li=high and x(tk)=high and μ(tk)= high then distance is very low. • If nc/li=high and x(tk)=high and μ(tk)= medium then distance is low.
• If nc/li=low and x(tk)=low and μ(tk)= low then distance is too high.
Now question is that, what x(t) and µ(t) are.
Suppose that mth term in document i is t and has frequency of ft, then the importance degree of t for cluster j is:
x(t)=
(ft/favg,)p , if ft<favg,j
1-[(ft-favg,j)(1-q)/(fmax,j- favg,,j)] ,
if ft≥favg,j , fmax,j>favg,
(favg,j/ft)p , if ft≥favg,j , fmax,j=favg,j (4)
This is a Triangular-shaped membership function where p>0, 0<q<1 and favg,j is the average
weight of term t, in all documents of cluster j, that have term t in their vector, or in the other word, suppose p documents, of l documents, in cluster j, have the term t1 and v(1:p) is the vector of the
correspond weights, then
favg,j = (∑i=1pv(i))/p (5)
fmax,j is maximum value of term t in these documents. So a cluster center has a structure like figure 3.
Figure 3: Cluster center structure
t1j t2j … tlj
Wavgj W2avg … Wlavg
W1max W2max … Wlmax
Another important factor is the percentage of documents in cluster, which have a certain term. It would help to increase inner compactness of a cluster.
µ(t)= number of documents in cj that have t / number of documents in cj (6) this is a S-shaped membership function.
Now suppose there are k cluster, and n documents should be clustered in, document i or di
belongs to cluster j (cj) where:
djϵ cj where for i=1:k dist(di,ck)>dist(di,cj) and
k≠j dist(di,cj)< defined threshold (7)
When a document becomes a member of a cluster, cluster center should be changed, for other runs. The average and maybe the max value of common words in the cluster center and the document should be recalculated, considering new weight. Then to make this new member more effective, and also not increasing the center size so much, some high weight uncommon words of the document will be added to cluster center. The best value for this number is achieved by trial and error.
Another important factor in clustering is threshold of membership value, or distance, at first runs, choosing this value so close to zero may increase cluster centers in vain, this value could have become smaller in every run.
The whole process could be explained as following:
1. Choose a/some data point(s) as first cluster center(s), usually the first data will be chosen.
2. Find distance between other points and these points, if minimum distance is smaller than the threshold value, data belongs to correspond cluster; else data will become center in next run.
3. Change the center of each cluster, average and max value if required. 4. Change the threshold value.
5. Check stop condition, if it is met stop the process, else go to step 1 with new centers. If a cluster center does not have any member, it could, not to be center in next run.
Stop condition could be some defined number of runs, or until cluster’s boundary do not change any more or any other acceptable condition.
For classification, the class of training set data should be known, each data point gets the class of its center, the correctness of this classification, should become a part of stop condition, it means, that if the acquired class is the same as real class, cluster gets a positive point, if number of misclassifications become higher than a value, the cluster is acceptable, so test data could use this classification method.
4. Experimental Results
For experimental purposes, over thirty hundred and fifty related web pages to have been downloaded from BBC.com, Yahoo.com, and also google.com. The pages belong to four classes. About 12 pages do not have normal HTML structure and some have XML format. By ignoring them, remaining web pages are about thirty three hundred. Two hundred and fifty of these pages have been chosen as training data and reminders for test.
Best values for p, q and r, are 1.5-2.5, 0.4-0.7 and 1-2 respectively.
In The best form the algorithm will continued until classification error become less than 9% and cluster’s boundaries do not change or have minimum change, compared with the previous time, this minimum is not always the same, because it sometimes does not find any intersection with the first condition.
The threshold value for the first run as 0.2 and every run it lose 0.01 of its value.
Table 1 shows result of this kind of clustering and classification, the value of r considered 1 all the time.
Table 1: Accuracy table for training data
p q # Misclassified Data #Found Clusters Classifying Accuracy
1.5 0.6 15 12 94%
1.5 0.8 21 12 91.6%
1 0.5 32 14 86.4%
3 0.9 44 9 83.2%
2 0.7 16 11 93.6
Table 1 shows that increasing values of p and q make clusters more compact, because it decreases the similarity value, and obviously increasing both values make clusters looser.
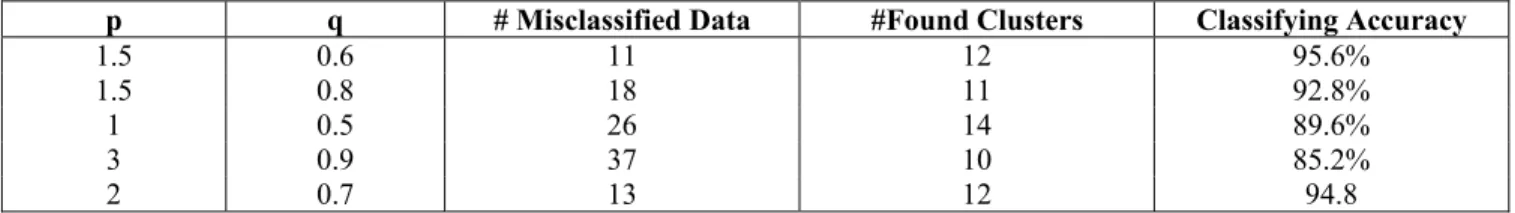
Table 2 shows the same algorithm, performed on vectors that become extracted from other tags in, HTML documents, those tags are <title>, <meta> tags and <p> inside body of text (TMP).
Table 2: Accuracy table for training data obtained from other tags
p q # Misclassified Data #Found Clusters Classifying Accuracy
1.5 0.6 11 12 95.6%
1.5 0.8 18 11 92.8%
1 0.5 26 14 89.6%
3 0.9 37 10 85.2%
2 0.7 13 12 94.8
The average precision rate by using vectors that become extracted from TMP tags is 91.6, and for <a> tag is 89.76, so <a> tag could be a good representative structure for documents clustering purposes, it also reduce the processing time, cause vectors are much more shorter and need less time to be processed. But even TMP data need less processing time than fixed size vectors and make the processing time more acceptable without decreasing of precision.
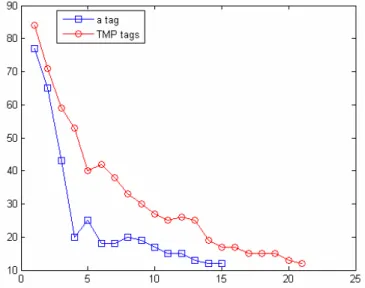
Figure 4 shows the behavior of these two different kinds of vectors, in this figure the number of produced clusters during process iterations is shown, until algorithm arrives to stop criteria.
Figure 4: Comparing results of <a> exteracted vectors with TMP exteracted vectors
Found vectors by means of <a> tag not only reduce the number of iterations, but also reduce whole processing time.
Figure 5 shows the distance value of a data point from centers in an iteration, at this time 17 clusters center are available and data point belongs to 14th data center or cluster.
Figure 5: Distance values of a vector from centers
table 3 show accuracy results of testing data for correspond rows in table1. Table 3: Accuracy table for testing data
#Misclassidied Acuuracy 7 91.25% 9 88.75% 13 83.75% 18 76.5% 8 90%
5. Conclusion
Clustering is a way for arranging related objects in the same groups, without any prior knowledge, and classifying is also another method of grouping according to some known patterns. In these paper <a> tag and fuzzy clustering used to gather, in order to find good clusters, in short time, that could be used in real time applications, without too much losing of precision rate. It is obvious that <a> tag could not have all related data, but it still can act as a useful structure and using fuzzy clustering could improve the correctness of results.
For increasing correctness and diversity of results, the proposed method could also be combined with genetic algorithms, and make a genetic-fuzzy clustering me.
References
[1] Chin Wen cheong , V.Ramachandran, “Genetic Based Web Cluster Dynamic Load Balancing in Fuzzy Environment”, ieee conference, pp.714-719,2000.
[2] Daniel T.Larose Discovering Knowledge in Data an Introduction to Data Mining, Wiley corporation,pp.90-107 ,2005.
[3] Dehu Qi, Bo Sun, “A Genetic K-means Approaches for Automated Web Page Classification”, Information reuse and integration conference, pp. 242-246, 2004.
[4] G.S. Tomar,Shekhar Verma, Ashish Jha, “Web Page Classification using Modified NaïveBayesian Approach”,2006.
[5] Esteban Meneses, “Vectors and Graphs,Two Representations to Cluster Web Sites Using Hyperstructure”, Fourth Latin American Web Congress (LA-WEB'06), 2006.
[6] Ho Tu Bao, Introduction To Knowledge Discovery and Data Mining, Institute of Information Technology National Center for Natural Science and Technology, pp. 10-28,6-79.
[7] Hui Zhang, Han-Tao Song, “Fuzzy Related classification Approach Based on Semantic Measurement for Web Document”, Sixth IEEE International Conference on Data Mining - Workshops (ICDMW'06),2006.
[8] Jiu-zhen Liang, “Chinese Web Page Classification Based on Self-Organizing MappingNeural Networks”, the Fifth International Conference on Computational Intelligence and Multimedia Applications (ICCIMA’03), 2003.
[9] Lin Yu Tseng and Shiueng Bien Yang, “Genetic Algorithms for Clustering, Feature Selection and Classification”, international conference on data publication, vol.3, pp. 1612-1616, 1997. [10] Manish Sarkar ,B. Yegnanarayana,”A Clustering Algorithm Using Evolutionary Programming,
”neural net conference, vol.2, pp. 1162-1167, 1996.
[11] Menahem Friedman, Abraham Kandel, Moti Schneider, Mark Last, Bracha Shapka, Yuval Elovici , Omer Zaafrany, “A Fuzzy-Based Algorithm for Web Document”, pp.524-527 2004. [12] Weimin Xue and Hong Bao Weimin Xue, Weitong Huang and Yuchang Lu, “Web Page
Classification Based on SVM”, 6th World Congress on Intelligent Controland Automation, pp. 6111-6114, 2006.
[13] Yaqin Zhao, Guizhong Tang, Dakuan Wei, Xianzhong Zhou, Guangming Zhang, “A Clustering algorithm Based on Probabilistic Crowding and K-means”, 6th World Congress on Intelligent Control and Automation, pp.5892-5895.
[14] Zhang Mao-yuan, Lu Zheng-ding, “A Fuzzy Classification Based on Feature Selection for Web Pages”, International Conference on Web Intelligence (WI’04), 2004.