Cost Analysis of Membrane Bioreactors to Reverse Osmosis Filters
Kevin Yeo
ABSTRACT
Recycled water is used for various purposes including industrial needs, agricultural irrigation, recharging aquifers, and use as potable drinking water. However, it is unclear which technology provides the greatest output of water for the lowest cost and least amount of drawbacks. The two most used technologies are membrane bio-reactors (MBR) and reverse osmosis (RO) filters as the final step in wastewater treatment. Data from 11 wastewater treatment plants which utilized MBR and/or RO in their wastewater treatment process was gathered and analyzed to show that MBR produced water costs $0.057 per gallon whereas RO produced water costs $0.048 per gallon. However, MBR has the capacity to produce 6,500 gallons of water a day, and RO only can produce 4,600 gallons of water a day. At maximum, RO can handle 50,000 gallons a day and MBR can handle 35,000 a day. New wastewater treatment plants must choose based on the capacity which they serve instead of cost.
KEYWORDS
INTRODUCTION
Historically people from around the world have recycled wastewater, which has been used and considered dirty (Asano and Levine 1996). This recycled water is used for various purposes including industrial needs, agricultural irrigation, recharging aquifers, and use as potable drinking water (Bixlo et al. 2005). A staggering 97% of the water on planet Earth is saltwater and undrinkable by humans. Of the remaining 3%, 2% is locked into ice in the form of glaciers, which means only a measly 1% can be easily accessed by the human population. With increasing demand for fresh water by industry, agriculture, and a growing population, it is clear that recycling water is a good method for dealing with these needs (Anderson 2003). Today in industrialized countries, the most costly treatment for sewage water is to make it potable, rather than making it suitable for industrial processes and agricultural irrigation (Grobicki and Gohen 1999). Modern technologies can provide high quality, efficient and safe methods of reclaiming wastewater
There are several methods for reclaiming wastewater, including membrane bioreactors (MBR), reverse osmosis (RO), and soil aquifer treatment (SAT) (Bixio et al. 2005). MBR and RO are the two main applications used for treating wastewater currently and SAT is the newest and least tested (Quanrud et al. 2003). All of these technologies require pretreatment of the wastewater, which removes solids and uses bacteria to digest some of the organic matter that is in the wastewater (Jolis et al. 1996). The pretreatment process is broken into two steps known as primary and secondary treatment and is followed by MBR and/or RO to produce water of
potable quality (Bixio et al. 2005). In primary treatment step, the wastewater is allowed to pass through a membrane which removes large solids such as trash and leaves. Next, the wastewater is undergoes a fixed-film system where bacteria which consume organic materials grows upon a media and the wastewater is allowed to flow over it for the bacteria to consume the organic material left in the wastewater (Mujeriego and Asano 1999). Afterwards, the wastewater
undergoes tertiary filtration in the form of nanofiltration or microfiltration where the membrane allows on very small particles pass through excluding bacteria (Jolis et al. 1996). This process is then followed by MBR or RO. As a result of a lack of comparative research, it is unclear which process is the most efficient or economical for producing water of potable quality. Evaluations
between specific new membrane technologies have been evaluated by Cote et al. (2005), but no study has compared RO and MBR in terms of financial costs, drawbacks, and output. Such a comparison will contribute to maximize water supplies and reduce costs.
Membrane bioreactors and reverse osmosis work by two different mechanisms. MBR combine the job of filtration with the sludge process, otherwise known as secondary treatment. The benefit of handling both secondary treatment and tertiary filtration at the same time is that the resulting water is cleaner due to higher efficiency rates of removal of soluble and
biodegradable materials (Gaglardo et al. 2001). An added benefit of membrane bioreactors is its ability to allow complete nitrification to occur or operated in denitrification mode, which allows the choice of leaving all the nitrogen in the sewage water or taken out (Gaglardo et al. 2001). Nitrogen is a nutrient needed by plants and this option allows the wastewater to be used for either drinking water or agriculture irrigation depending on the nitrogen content of the produced water. Alternatively, RO is the opposite of osmosis which forces water through a membrane from a region of high solute concentration to low solute concentration. The membrane of reverse osmosis vary in size of filtration, but is used mainly because it can filter solids up to 0.1
nanometer. For this reason, the water filtered by RO is used not only in wastewater processing, but also desalination of seawater and/or salt water (Mohsen and Al-Jayyousi 1999).
For my study, I analyze the differences between RO and MBR technologies in terms of financial costs, output, water quality and drawbacks. The main costs of concern are the initial purchase, operating and maintenance (O&M), and cost per gallon of processed water. I
hypothesize that MBR processed water will have a cheaper overall lifetime cost, but will produce less water than RO and the cost per gallon of water will be less expensive if wastewater is refined by RO. RO refined water will remove a greater percentage of undesirables such as bacteria and other waste products in the water compared to MBR
.
METHODS
I collected data from 11 different wastewater treatment plants across California. I had sent out 30 surveys requesting data and had a 36% response rate. I collected the following data: quality of sewage water and processed water, initial cost of technology, cost/output of
pretreatment, cost/output of final treatment step (MBR/RO), operating and maintenance (O&M) costs, and lifespan of the technology. The initial costs and lifespan of the technology will help me determine the lifetime cost per gallon of water processed by MBR and RO. The cost/output of pretreatment, O&M costs, and cost/output final treatment step contribute to finding the average cost per gallon of processed water.
Figure 1. General flow of MBR
As seen in figure 1, MBR consists of a main tank where tertiary filtration and secondary treatment take place. Sewage from the bar screen tank, which is basically primary treatment is delivered into the main tank where secondary treatment takes place and biological waste is removed. There are 2 parts to the main tank, the aerobic tank is where tertiary filtration takes place and is pumped out to another reservoir. Figure 2 shows the basic mechanism of RO. In the left side tank, a solution fill of solute is present and pressure is added to push only water through the semi-permeable membrane between the 2 tanks. This leaves solute to be carried out from the first tank and fresh usable water from the right side tank.
RESULTS
I was unable to obtain specific data on the quality of the untreated sewage water and the processed water also. Lacking this data, I am unable to determine whether MBR or RO have an advantage or disadvantage when it comes to the quality of the water after being processed. The same is true for the initial costs of RO and MBR being used and the cost and output of the pretreatment steps. Therefore, it is not possible to determine the theoretical costs per gallon of the technology over a lifetime as I had wished to better compare MBR to RO.
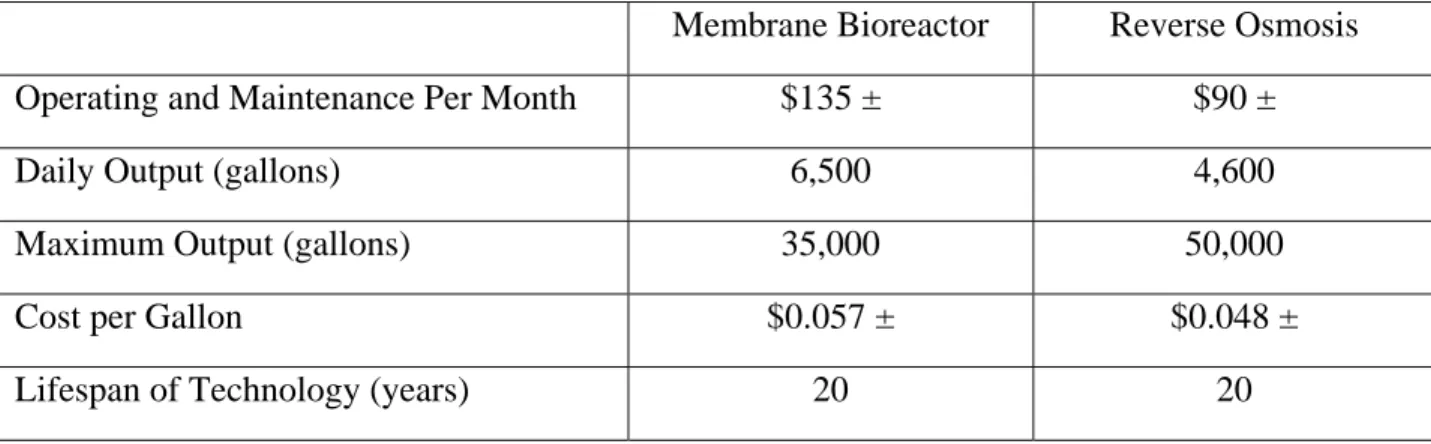
Table 1. Costs Analysis and Output. All data related to costs/output and lifespan.
Membrane Bioreactor Reverse Osmosis Operating and Maintenance Per Month $135 ± $90 ±
Daily Output (gallons) 6,500 4,600
Maximum Output (gallons) 35,000 50,000
Cost per Gallon $0.057 ± $0.048 ±
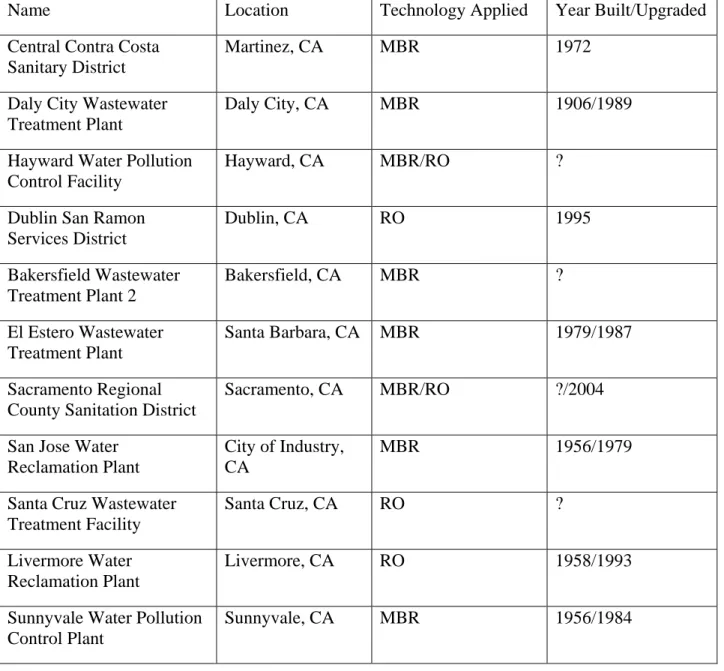
Table 2. Wastewater Treatment Plant Responses. Names of plants which responded to the survey along with technology used and year built and last upgraded.
Name Location Technology Applied Year Built/Upgraded
Central Contra Costa Sanitary District
Martinez, CA MBR 1972
Daly City Wastewater Treatment Plant
Daly City, CA MBR 1906/1989
Hayward Water Pollution Control Facility
Hayward, CA MBR/RO ?
Dublin San Ramon Services District Dublin, CA RO 1995 Bakersfield Wastewater Treatment Plant 2 Bakersfield, CA MBR ? El Estero Wastewater Treatment Plant Santa Barbara, CA MBR 1979/1987 Sacramento Regional County Sanitation District
Sacramento, CA MBR/RO ?/2004
San Jose Water Reclamation Plant
City of Industry, CA
MBR 1956/1979
Santa Cruz Wastewater Treatment Facility
Santa Cruz, CA RO ?
Livermore Water Reclamation Plant
Livermore, CA RO 1958/1993
Sunnyvale Water Pollution Control Plant
Sunnyvale, CA MBR 1956/1984
DISCUSSION
This study compared two currently used technologies in wastewater treatment plants in terms of financial costs, output, water quality, and drawbacks. Wastewater treatment plants are needed to help regulate freshwater which is a necessity to humans. Additionally, these plants are capable of recycling water for other uses which are also needed such as irrigation of agriculture
and cleaning/cooling of industrial machines. My hypothesis is correct based on the fact that RO cost per gallon is cheaper than MBR and RO can process greater amounts of water daily than MBR. The rest of my hypothesis cannot be answered by this study due to the lack of data.
According to the numbers in table 1, MBR cannot compete against RO in financial terms or output. However, T-test of the cost per gallon between MBR and RO results in not statistically different meaning the variance in price between the two technologies can be attributed to chance. Therefore, it is not possible to determine if MBR or RO process water for cheaper per gallon. It is clear that O&M costs for MBR are higher than RO meaning that replacement of parts or maintenance of parts in MBR are greater. Membrane fouling in MBR is a known issue and perhaps is the reason for the greater cost in O&M when compared to RO (Bouhabila et al. 2001). Another possibility is materials used to construct the filters of MBR are much more costly or that the filters of MBR are replaced much more frequently. Finding out the cost per replacement filter of MBR and RO would solve the issue. There is need for a deeper study into O&M costs
between RO and MBR.
RO comes out on top in regards to only maximum output. This shows that RO technology has a greater potential for handling larger loads of wastewater. Table 2 shows the year in which each of the wastewater treatment plants was last upgraded and/or built. All plants prior to 1990's utilize MBR and this might be the reason why the MBR capacity is lower than RO since all the RO plants were built/upgraded recently and with newer technology. Perhaps, new MBRs can match the output of RO. On the other hand, currently MBR seem to be handling a majority of the output compared to RO as seen in table 1. The daily output of MBR is greater than RO could mean that the plants favoring using MBR over RO, but that is not necessary the case. 8 of the 11 plants that responded to the survey use MBR and only 2 of 11 use both MBR and RO. In the 2 plants that use both, they used both MBR and RO in their process and the output is the same for both MBR and RO. The daily output is greatly affect by the fact that most of the plants use MBR all the time because that is the only tertiary filtration they have. The fact that MBR combines secondary pretreatment with tertiary filtration cannot be overlook in affect the daily output also because secondary pretreatment is a necessary step in the wastewater recycling. As a result, it is clear that if the plant wishes to maximize output, it should use a RO system instead of MBR.
There are many limitations to this study as data on water quality was not available for study and the initial costs of MBR and RO were also not available. Without the initial costs, I cannot compare the theoretical cost per gallon of treated water of MBR to RO. The costs and output of the pretreatment steps are also not available making the cost per gallon less accurate than it should be because of the MBR design of combining secondary pretreatment with tertiary filtration. There are also no identifiable drawbacks in either technology. The amount of
responses I received were also very little and not the sample size I wished to obtain in order to better discover which technology is superior in its job.
There are plenty of future studies to be done from this limited study of MBR and RO. An in depth study in O&M costs of MBR and RO to better determine the specific factor that creates the cost difference such as filter costs, wear and tire, membrane fouling, or something else
entirely. Another study would simply be to finish up where this study did not finish in finding the initial costs, pretreatment costs and output, and water quality of the untreated sewage and treated water and including a comparison with newer technology such as SAT which is the process of using soil to filter water naturally and then pump it back up to be used (Drewes et al. 2003). Cost per gallon of water might not have the best indicator in terms of financial costs between MBR and RO, perhaps a study that used a different parameter to judge the difference would have uncovered a different conclusion than this study.
This study shows that new wastewater treatment plants can only choose which
technology to use based on the capacity it needs to be able to handle instead of which technology costs the least. The capacity of the a plant is a critical factor in its use as a plant that cannot handle its load is eventually upgrade to be able to. Depending the region that the wastewater treatment plant serves and the acreage available for the plant to be built on, MBR can be utilized for space saving design, but a larger population would require greater output during times of heavy rainfall and perhaps RO would be better suited for the role. In table 2, all the newer plants are beginning to use RO as their method of tertiary filtration and this maybe a sign that RO with its lower O&M costs maybe really be cheaper in processing wastewater compared to MBR even though this study could not show that.
REFERNECES
Anderson J. 2003. The Environmental Benefits of Water Recycling and Reuse. Water Science and Technology: Water Supply 3: 1-10
Asano T., A.D. Levine. 1996. Wastewater Reclamation. Recycling and Reuse: Past, Present, and Future. Water Science and Technology 33: 1-14
Bixlo D., B. De heyder, H. Cikurel, M. Muston, V. Miska, D. Joksimovic, A.I. Schafer, A. Ravazzini, A. Aharoni, D. Savic, and D. Thoeye. 2005. Municipal Wastewater Reclamation: Where Do We Stand? An Overview of Treatment Technology and Management Practice. Water Science and Technology: Water Supply 5: 77-85
Bouhabila E.H., Aim R.B., and H. Buisson. 2001. Foul characteristics in membrane bioreactors. Separation and Purification Technology 22-23: 123-132
Cote P., S. Siverns, and S. Monti. 2005. Comparison of Membrane-Based Solutions for Water Reclamation and Desalination. Desalination 182: 251-257
Drewes J.E., Reinhard M., and P. Fox. 2003. Comparing microfiltration-reverse osmosis and soil-aquifer treatment for indirect potable use of water. Water Research 37: 3612-3621 Gagllardo P., S. Adham, R.P Merlo, R.S. Trussell, and R.R. Trussell. 2001. Water Reclamation
with Membrane Bioreactors. Water Science and Technology: Water Supply 1: 293-302 Grobicki A.M.W., B Cohen. 1999. A Flow Balance Approach to Scenarios for Water
Reclamation. Water S.A. 25: 473-482
Jolis D., Hirano R.A., Pitt P.A., Muller A., and D. Mamais. 1996. Assessment of Tertiary Treatment Technology for Water Reclamation in San Francisco, California. Water Science and Technology 33: 181-192
Mohsen M.S., O.R. Al-Jayyousi. 1999. Brackish water desalination: an alternative for water supply enhancement in Jordan. Desalination 163-174
Mujeriego R., T. Asano. 1999. The role of advanced treatment in wastewater reclamation and reuse. Water Science and Technology 40: 1-10