Technical Sciences Brassersplein 2 2612 CT Delft Postbus 5050 2600 GB Delft www.tno.nl T +31 88 866 70 00 F +31 88 866 70 57 [email protected] Internal TNO-report
SERCO project report
Detecting security attacks with SIEM
Report number TNO 2012 R11302
Datum December 2012
Auteur(s) R.J.G. van Paassen M.Sc., D.H. Hut, M.Sc, B. Boltjes Ph.D, Kostas Trichias M.Sc.
Aantal pagina's 37 Aantal bijlagen 0
Opdrachtgever Prof. dr. ir. Rob Kooij/VP VII Projectnaam SERCO
Projectnummer 055.01709
Alle rechten voorbehouden.
Niets uit deze uitgave mag worden vermenigvuldigd en/of openbaar gemaakt door middel van druk, foto-kopie, microfilm of op welke andere wijze dan ook, zonder voorafgaande toestemming van TNO.
Indien dit rapport in opdracht werd uitgebracht, wordt voor de rechten en verplichtingen van opdrachtgever en opdrachtnemer verwezen naar de Algemene Voorwaarden voor opdrachten aan TNO, dan wel de betreffende terzake tussen de partijen gesloten overeenkomst.
Het ter inzage geven van het TNO-rapport aan direct belang-hebbenden is toegestaan.
Contents
1 Introduction ... 5 1.1 Background ... 5 1.2 Objective ... 5 1.3 Scope ... 5 1.4 Outline ... 6 2 SIEM Concepts ... 72.1 Incident handling process ... 7
2.2 General capabilities ... 8
2.3 Business functions ... 8
3 SIEM market ... 9
3.1 Gartner Magic Quadrant ... 9
3.2 IBM and Q1 Labs ... 9
3.3 HP Arcsight ... 10
3.4 RSA enVision ... 10
3.5 Splunk ... 11
3.6 TripWire ... 12
4 SIEM test bed environment ... 14
4.1 Test bed network overview ... 14
4.2 Splunk as SIEM product ... 14
4.3 Sensors ... 14
5 Security incidents of interest ... 16
5.1 Tested security attacks and detection methods ... 16
5.2 Category 1: SYN Flood ... 17
5.3 Category 2: Destruction ... 18
5.4 Category 2: Corruption ... 19
5.5 Category 2: Leakage of classified information ... 19
5.6 Category 3: Malware and Virus infection ... 20
5.7 Category 13: Failed login attempts ... 23
6 Event detection, reporting and visualization ... 24
6.1 Splunk Alerts ... 24
6.2 Snort dashboard ... 25
6.3 Antivirus dashboard ... 26
6.4 File Integrity (tripwire) dashboard ... 27
6.5 Repetitive Failed Login (password guessing) dashboard ... 28
6.6 DDOS attack dashboard ... 29
6.7 Overview dashboard ... 30
6.8 Normalization & Correlation ... 31
7 Cyber simulation tooling ... 32
7.1 High Fidelity Cyber Simulation Environment: OPNET ... 32
7.2 OPNET Cyber simulation example ... 34
Management Summary
First half year summary:The SERCO project has spent the first half year investigating the research potential for a framework that helps in promoting robustness of vital infrastructures. This culminated in a round table meeting with industry representatives in May of 2012. The main findings of that meeting were:
Using the notion of “service recovery”, instead of the more common and better understood “business continuity management”, is not useful. More depth is required in the discussion in order to fully understand the
challenges of business continuity. High-level discussions (frameworks) do not add much value or give additional insights, given the complexities of (cyber)crisis situations. It is difficult to generalize.
The sectors recommended TNO to align with the industry ISAC’s, hosted by CPNI.NL
Relevant research topics for the industry participants were:
o The netcentric way of crisis management;
o The quick identification of new risks (“dynamic risk management”) and tooling to support this;
o A smart way to lessen the burden of documentation as evidence in audits.
Second half year summary:
The second half of the year was spent on experimenting with methods to detect security incidents using a ‘Security Information and Event Management’ (SIEM) product. We received a list of relevant security incidents from the Ministry of Defense and used these as a “challenge” in a TNO test bed network environment. From this list we implemented 6 security attacks in our test bed, we implemented detection algorithms for these attacks and we have built dashboards that display information on these incidents. We can detect security incidents inside a central SIEM component but we also built custom sensor modules that can detect security incidents on or near critical components like for example a webserver. These sensors also report their findings to the central SIEM component.
1
Introduction
1.1 Background
The ‘Critical ICT Infrastructures’ program managed by prof. dr. ir. Rob Kooij is a strategic research program that aims to improve the quality of ICT infrastructures. The red line for all projects within this program is quality and dependability for all information and communication technology. Especially for the Dutch national vital infrastructure, at least that part which is dependent on ICT, such as energy supply, telecommunications, and financial infrastructure, it is necessary to pay attention to the different aspects of quality and dependability because our society is becoming more and more dependent on ICT infrastructures and of companies that manage such infrastructures.
The work package ‘Technically Robust Infrastructures’ aims to develop robust ICT networks by using new network and security technologies. In general ‘Information Security’ typically looks at three aspects of quality and dependability: Confidentiality (C), Integrity (I) and Availability (A) of information and functionality. These three aspects are known as the “CIA” triad of information security.
The project ‘Service Recovery and Cyber Continuity’ (SERCO) is part of the ‘Critical ICT Infrastructures’ program and focuses on the detection and response phase of a security incident.
1.2 Objective
The project objective is to research the family of products known as ‘Security Information and Event Management’ (SIEM1
) tooling. SIEM technology can be used to collect security related events, correlate them and to present them in an
understandable and manageable way.
The following research questions are leading for this project: 1. What can current SIEM products do?
2. What are customer experiences with SIEM products?
3. How can such products be used in security management for our large corporate customers like KPN and the Ministry of Defense?
1.3 Scope
The following project scope has been agreed with the program manager:
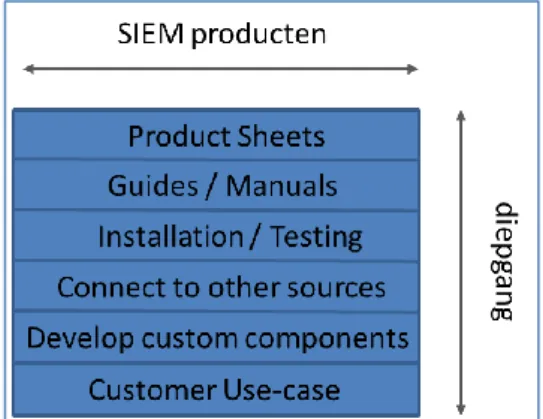
We do not want to develop only theoretical knowledge but we also wish to build practical experience with tooling in a lab environment.
We wish to reach a certain in-depth level in security knowledge for this particular subject to avoid the “a mile wide and an inch deep” problem (see Figure 1).
1
Figure 1: Scope
1.4 Outline
#
Chapter
Description
2 SIEM Concepts A description of SIEM concepts, i.e. what is it and what can it be used for.
3 SIEM Market What products are available in the Gartner Magic Quadrant.
4
SIEM test bed environmentAn overview of the TNO test bed used for
performing security attacks on a protected network as well as hosting a SIEM product.
5 Security incidents of interest
Narrow the scope down to a list of security incidents that are of particular interest for designing and building detection mechanisms.
6 Event detection, reporting and visualization
Detecting and visualizing security incidents with Splunk2. Splunk captures, indexes and correlates real-time data in a searchable repository from which it can generate graphs, reports, alerts, dashboards and visualizations.
7 Cyber simulation tooling A short discussion on the potential use of network simulation tooling in cyber security
8 Conclusions and recommendations
Provides conclusions and recommendations.
2
2
SIEM Concepts
A SIEM type of product is a combination of two types of functions:
“A security event manager (SEM) is a computerized tool used on enterprise data networks to centralize the storage and interpretation of logs, or events, generated by other software running on the network3”.
“Security information management (SIM) is the industry-specific term in computer security referring to the collection of data (typically log files; e.g. event logs) into a central repository for trend analysis4”.
SEM is especially useful for security operations while SIM is more tailored for policy compliance management, i.e. long-term data storage and reporting, for example for Sarbanes–Oxley Act (SOX5
) and the Basel Accords (Basel II6). 2.1 Incident handling process
To understand where SIEM tooling is useful and where it can be applied, it helps to first look at the phases of a security incident. The “Computer Security Incident Handling Guide” of the National Institute of Standards and Technology (NIST) outlines these steps (see Figure 2).
Figure 2: NIST Incident Handling Process
The NIST manual lists a number of potential information sources that can be used to detect different types of security attacks, for example:
Intrusion Detection & Prevention Systems (IDPS) AntiVirus / AntiSpyware / AntiSpam software File Integrity checking software
Operating system, service en application logs Firewall
…
All these sources can be integrated in a SIEM product to create a broad picture of an enterprise network and its network and computing systems, applications and services. Especially for the Detection and Analysis step a SIEM product has the potential to correlate real-time data from many different sources and products, even 3rd party products. This makes it possible to create and configure analysis and alerting components that span multiple sources, applications and services that would have been difficult to ‘integrate’ from a security perspective without a SIEM. 3http://en.wikipedia.org/wiki/Security_event_manager 4http://en.wikipedia.org/wiki/Security_information_management 5 http://en.wikipedia.org/wiki/Sarbanes%E2%80%93Oxley_Act 6 http://en.wikipedia.org/wiki/Basel_II
2.2 General capabilities
In general a SIEM product provides the following capabilities:
Data Aggregation: aggregate data from many sources, including network, security, servers, databases, applications providing the ability to
consolidate monitoring over data, infrastructure components, software and services.
Correlation: looks for common attributes, and links events together into meaningful bundles. This technology provides the ability to perform a variety of correlation techniques to integrate different sources, in order to turn data into useful information.
Alerting: the automated analysis of correlated events and production of alerts, to notify recipients of immediate issues. Alerting can be to a dashboard or sent via third party channels.
Dashboards: take event data and turn it into informational overviews to assist in seeing patterns or identifying specific activity.
Compliance: SIEM applications can be employed to automate the gathering of compliance data, producing reports that fulfill security, governance and auditing requirements.
Retention: employ long-term storage of historical data to facilitate correlation of data over time and to provide the retention necessary for compliance requirements. Long term log data retention is critical in forensic investigation's as it is unlikely that discovery of a network breach will be at the time of the breach occurring.
2.3 Business functions
With the listed general capabilities different business functions can be delivered to an organization, for example:
Log file consolidation. Instead of keeping log files at many locations, logs can be collected and maintained at a central location. The advantage of this approach is that log files are more accessible, that they may be better protected (file integrity) and that central storage enables making correlations.
Situational awareness. The notion of “situational awareness” indicates the existence of a correct and (near-) real-time understanding of a system’s current state. Because SIEM products have the possibility to display a dashboard with specific parameters, they can contribute to a better situational awareness.
Analysis. In a corporate environment enormous amounts of events are logged. With fast indexing, searching and an easy way of digging through events over multiple systems and services an analyst can get an overview as well as nitty gritty details whatever the situation requires.
3
SIEM market
This chapter gives a short description on the market of SIEM vendors: key players and most relevant products, with the purpose to gain a better understanding of SIEM products.
3.1 Gartner Magic Quadrant
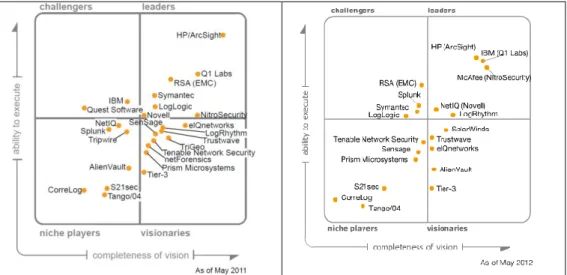
The figure below displays the Garner SIEM Magic Quadrant for May 2011 and May 2012.
Figure 3: Gartner SIEM Magic Quadrant 2011 and 2012
A comparison of the figures shows among others that the number of relevant players has drastically decreased. Also HP with Arcsight, IBM with Q1labs and McAfee are the players in the top right corner.
3.2 IBM and Q1 Labs
IBM took over Q1 labs in May 2011. IBM’s SIEM product is Tivoli Security Operations Manager and Q1 lab’s SIEM product is QRadar SIEM.
Figure 4: Q1 Labs high-level SIEM architecture
Note that a SIEM architecture needs many input data sources (see Figure 4) to provide an enterprise wide security picture across computing and network devices, software applications and services.
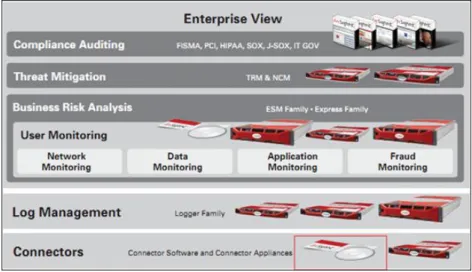
3.3 HP Arcsight
ArcSight ESM is the brain of the ArcSight SIEM platform. It analyzes and correlates every event that occurs across the organization, every login, logoff, file access, database query, etcetera, to deliver accurate prioritization of security incidents and compliance violations. The correlation engine of ArcSight ESM sifts through millions of log records to find the critical incidents that matter. These incidents are then presented through real-time dashboards, notifications or reports to the security administrator (see Figure 5).
Figure 5:Overview of HP ArcSight suite
3.4 RSA enVision
The RSA Envision platform provides a centralized log-management service that enables organizations to simplify their compliance programs and optimize their security-incident management. The RSA Envision solution facilitates the automated
collection, analysis, alerting, auditing, reporting, and secure storage of all logs (see
Figure 6
).Figure 6: RSA enVision architecture
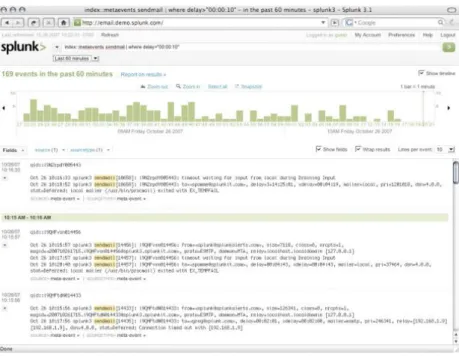
3.5 Splunk
Splunk is software to search, monitor and analyze machine-generated data by applications, systems and IT infrastructure at scale via a web-style interface. Splunk captures, indexes and correlates real-time data in a searchable repository from which it can generate graphs, reports, alerts, dashboards and visualizations. Splunk aims to make machine data accessible across an organization and identifies data patterns, provides metrics, diagnoses problems and provides intelligence for business operation. Splunk software collects, indexes and harnesses the massive volumes of valuable machine data generated by a complex IT infrastructure - physical, virtual and in the cloud. With Splunk one can troubleshoot problems and investigate security incidents or outages and gain real-time visibility into customer experience, transactions and behavior. Splunk provides powerful indexing, search, analysis and visualization capabilities (see Figure 7).
Figure 7: Splunk event details
3.6 TripWire
Tripwire is primarily known as a tool to monitor file integrity, but they also offer a “Log Center” that does log file monitoring among others (see Figure 8). Tripwire Log Center is an advanced, yet easy to deploy and use SIEM and log management solution. With it, you can:
Quickly detect security incidents and events of interest with a powerful yet easy-to-use SIEM
Access the information necessary for security forensic investigations and compliance reporting by aggregating all logged events
Focus your security efforts by seeing events of interest in context of suspicious changes provided by Tripwire Enterprise
Proactively respond to threats by using dashboards to see security trends and analyze your security and operational state
Find accurate, complete log and event information with easy-to-perform queries across all platforms and devices with standards-based language classification of log messages
Figure 8: TripWire Log Center indicators of breach activity
4
SIEM test bed environment
For the SERCO project we use a SIEM test bed environment for executing security attacks, for implementing detection mechanisms and for hosting and testing a SIEM product.
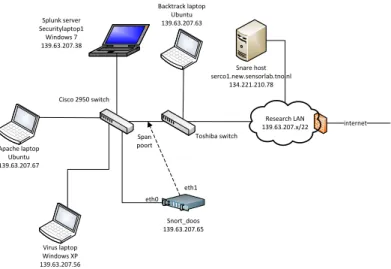
4.1 Test bed network overview
Our test bed environment is a small network (see Figure 9) connected to the TNO Research network. It uses various hardware and software computing components to implement and test several SIEM capabilities. Note that for this project we focus on the Security Event Management (SEM) part of a SIEM. The test bed spans multiple physical locations in Delft and in Groningen (TNO ICT).
Apache laptop Ubuntu 139.63.207.67 Backtrack laptop Ubuntu 139.63.207.63 Snort_doos 139.63.207.65 Splunk server Securitylaptop1 Windows 7 139.63.207.38 eth1 eth0 internet Snare host serco1.new.sensorlab.tno.nl 134.221.210.78 Cisco 2950 switch Virus laptop Windows XP 139.63.207.56 Research LAN 139.63.207.x/22 Toshiba switch Span poort
Figure 9: TNO test bed network
4.2 Splunk as SIEM product
For this project we use Splunk as our SIEM product. The main reason to choose Splunk was its availability, and on top of that we saw the potential for re-use of knowledge in the Security Operations Center of one of TNO’s partners (large telco).
Note that it is not our intention to compare the different SIEM products or select a particular candidate. We merely wish to gain knowledge and experience with SIEM in general and learn how to integrate standard and custom components into a SIEM solution.
4.3 Sensors
Any SIEM product needs to be fed information from different networking and computing components, software applications, operating systems, services and so on. We used standard applications as ‘sensors’, i.e. components that send
Snort
Snort is a network intrusion detection system (NIDS). There are multiple versions, both open- as well as closed source. We used the open-source version of Snort to monitor traffic on the network and forward alerts to Splunk.
Using the Snort default configuration generates an enormous number of alerts. The amount of information is in itself a problem but especially so you consider that not attack was performed at the time. For the output to be of any use, it is important that configuration is done accurately and that only those rules are enabled that make sense in a particular environment.
Tripwire
The open source tool tripwire is a file integrity monitoring tool. On
installation/configuration, the administrator configures which files/directories to monitor. It then calculates a signature (hash) of these files that is stored in a database that is signed cryptographically (for this, it needs the admin’s password i.e. user interaction is required). Any deviations, for example after or during a security attack, results in alerts that can sent to Splunk.
Note that the default install also monitors a number of files/directories that change on a simple system reboot or during normal operations. As with Snort, careful configuration is essential to avoid a large number of false alerts.
Snare
Snare, an acronym for System iNtrusion Analysis and Reporting Environment, consists of a group of monitoring agents and a server used to collect audit log data from a variety of operating systems and applications. The Snare agents have been designed to collect audit log data from a host system and send this data to a central server for archive, analysis, and reporting. Custom configuration to detect certain patterns, i.e. login failures, file deletion, can be communicated to Splunk.
Windows Security Essentials
Microsoft Security Essentials is a free Microsoft tool aimed at the consumer market to detect and block viruses and malware. It lacks centralized management functions as in Microsoft Forefront Client Security but it does have the same antivirus
malware scanner as Forefront and Windows Defender.
Note that we do not want to test Security Essentials or any other component for that matter. We wish to test integration of 3rd party security components into our SIEM environment and detect and visualize security events.
5
Security incidents of interest
This chapter describes the incident types we have used as a starting point, and the manner in which we have implemented the incident simulation and the detection. 5.1 Tested security attacks and detection methods
In order to reach an in-depth level of understanding of the technical details of a SIEM system we implemented and executed several types of security attacks in our TNO test bed network to generate security events. We also implemented detection mechanisms for detecting these security attacks in order to do Aggregation, Correlation and Alerting of security events. We implemented a central system with Splunk to collect and show information about the different security events in a Dashboard visualization. Such a central component can also be used to perform Correlation across multiple security events, for example security events that originated on different computing systems throughout the enterprise network. Note that we did not implement the functionality of Compliance and Retention because these belong more to the Security Information Management (SIM) part of SIEM. From the Ministry of Defense TNO received a list (see Figure 10) of different types of security incidents that they wanted us to detect. Because not all of them are related to Information and Communication Technology (ICT) we chose certain security attacks that fall in certain DefCERT categories. This is especially important because not all of the DefCERT incidents can be detected using a SIEM type of functionality.
Cyberincident of dreiging
Classificatie Type
1. Denial of service DOS of DDOS attack 2. Gecompromitteerde informatie of
systemen
Vernietiging Corruptie Ontsluiting
ICT gerelateerde vermissingen met een classificatie. Verlies van geclassificeerde stukken
Data leakage
3. Gempromitteerde assets actief Malware geïnfecteerde hosts die actief worden ´beheerd´ door de aanvaller.
4. Gecompromitteerde assets passief host (root account, Trojan, rootkit) netwerk device
applicatie
gebruikers account 5. Criminele activiteiten ICT gerelateerd Diefstal
Persoonlijke veiligheid Kinderporno
Computer gerelateerde incidenten met een criminele achtergrond, met (waarschijnlijke) betrekking van KMAR of andere veiligheid/politie diensten. Delen/ter beschikking stellen van beledigend materiaal.
ICT gerelateerde diefstal met een classificatie. 6. External Hacking Verdachte activiteiten gericht op het interne netwerk,
vanuit buiten (koppelvlakken) met uitzondering van malware.
7. Internal Hacking Verdachte activiteiten op het interne netwerk, met uitzondering van malware
8. Malware Malware die meerdere assets heeft besmet. Dit is exclusief hosts die actief worden gecontroleerd door
een aanvaller via een ‘ backdoor’ of ‘trojan” 9. Email Spoofed email, SPAM, mail met malware bijlagen en
andere mail security events of incidenten 10. Web/Social Media defacement Defacements van websites en social media op
pagina’s in gebruik bij Defensie. Zowel intern als extern.
11. Ongewenste infrastructuur of applicaties Ongewenste koppelingen van assets op een netwerk zoals computer, routers, of switches. Ongewenste koppelvlakken.
Gebruik van onveilige software.
Gebruik van niet goedgekeurde software. 12. Social Engineering Door middel van sociale middelen toegang
verschaffen met als doel het ontvreemden van informatie
13. Policy Violations Delen/in bezit hebben van copyright materiaal. Moedwillig overtreden van de veiligheid policy zoals bepaald door de Beveiligingsautoriteit.
Ongepast gebruik van assets zoals computer, netwerk, of applicatie.
Ongeautoriseerde aanpassingen op privileges Ongeautoriseerde aanlog pogingen
Overige overtredingen op de geldende Security policy
Figure 10: DefCERT classification of Cyber incidents
We analyzed the DefCERT incident list with the following approach: 1. Are the listed incidents related to ICT?
2. Are the listed incidents related to SIEM technology? 3. Are the listed incidents specific enough to detect?
Note that some of the different items in the DefCERT list do not describe specific security attacks but describe ‘categories’ of incidents. Also the incident list is not completely disjoint. For example category 2 “Compromised Information or Asset” and Category 8 “Malware” are related because the former can happen by means of the latter. The consequence is that a specific attack can fall into more than one category.
We simply started with the first category and implemented at least one (but preferable more) security attacks that fall into a certain category. For each attack scenario we documented the technology with the following template:
1. Attack description. 2. Detection method. 3. Integration with Splunk. 5.2 Category 1: SYN Flood
Attack
A webserver is attacked with a SYN flood. The number of half-open open
connections in the TCP/IP stack on the webserver grows causing the webserver to service legitimate requests at a slower rate than normal or, depending on the size of the SYN flood, not at all. We used a Python program7 to generate the SYN packets with the help of a network library called Scapy8.
7
http://jamesdotcom.com/?p=264
8
Detection
The number of half-open network connections on the webserver are monitored with a custom developed Bash script and Netstat9. The script sends the number of half-open connections every minute to Splunk (Figure 11) using Netcat10.
Figure 11: SYN flood detection component
Integration
Splunk monitors the number of half open connections on the webserver and raises a flag if the number exceeds a certain threshold (for example 1000).
5.3 Category 2: Destruction Attack
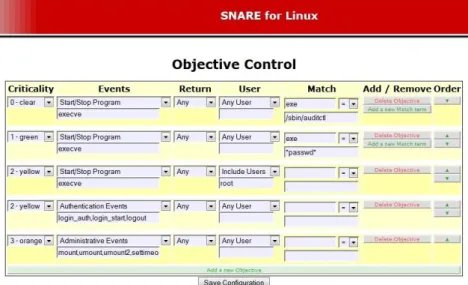
An admin user deletes files on important systems using system commands like “rm”, “del” or “format”.
Detection
We used a Snare11 Agent to monitor the use of commands that are executed with root privileges (Figure 12), for example the “rm” command to delete some log files. If the agent sees such a thing, then it sends a “deletion” signal to Splunk with the system name and system IP address.
Figure 12: Detect privileged root commands
Integration 9http://en.wikipedia.org/wiki/Netstat 10 http://en.wikipedia.org/wiki/Netcat 11 http://www.intersectalliance.com/projects/BackLogNT/
Splunk monitors the amount of “deletion” signals and raises a flag if the number exceeds a certain threshold.
5.4 Category 2: Corruption Attack
The files inside the /var/www directory of a webserver are modified (website defacement) by a malicious user.
Detection
We used the open-source version of Tripwire12 to monitor the static content of the /var/www directory of a webserver. Every 5 minutes an integrity check is performed by starting Tripwire via a cron job.
Integration
If Tripwire sees a modification then an alert is sent to Splunk via Syslog. 5.5 Category 2: Leakage of classified information
Attack
Classified files are exfiltrated using an outbound Internet protocol connection. Detection
We created Snort13 rules that look for plaintext strings like “Dep. Vertrouwelijk”, “Stg. Geheim”, “Stg. Zeer geheim” and other variations.
alert tcp any any <> any any (msg:"Stg. GEHEIM gezien"; content:"stg. geheim"; sid:1; priority:3; nocase)
alert tcp any any <> any any (msg:"Dep. vertrouwelijk gezien"; content:"dep. vertrouwelijk"; sid:1; priority:3; nocase)
alert tcp any any <> any any (msg:"Stg. Zeer geheim gezien"; content:"stg. zeer geheim"; sid:1; priority:3; nocase)
Note that this sensor also triggers if a document is not classified in itself (like this project report) but simply if it contains this text. (Therefore it’s not smart to trigger on “secret” since this would also trigger on “secretary” or “victoria’s secret”) On the other hand, it does not trigger if the file is somehow binary/base64 encoded or zipped or encrypted. To summarize, this is not an advanced way to monitor for classified document exfiltration.
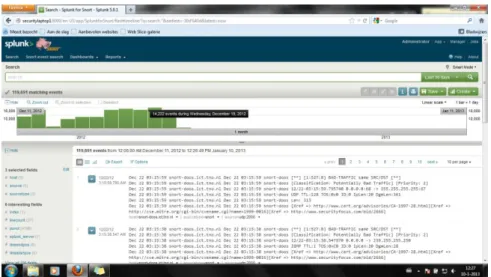
Integration
Alerts from this rule end up in the /var/log/snort/alerts file. This file is monitored and forwarded to Splunk via Syslog-ng over UDP port 1000. Note also, that Splunk has a dedicated “Snort-for-Splunk” app component.
12
http://www.tripwire.org/
13
Figure 13: Snort module for Splunk
5.6 Category 3: Malware and Virus infection Attack
A computing system is infected, for example by opening an infected PDF document, with a piece of malware or a virus. We generated our own malware using
Metasploit14 and created a Windows executable shellcode payload called ‘pscalc’15 which does not actually exploit any vulnerability but does carry a payload.
We also tested our SIEM environment with the harmless EICAR16 virus which is basically a valid DOS executable, i.e. it can be executed on Windows systems. EICAR prints the message "EICAR-STANDARD-ANTIVIRUS-TEST-FILE!" to the console. EICAR is a test virus that every scanning engine should be able to detect. Thirdly we tested a malicious exploit on our SIEM test bed network to attack vulnerable versions of Internet Explorer (IE) on Windows XP systems. If such a vulnerable IE web browser is used to request a certain webpage that hosts the exploit (see Figure 14) then the server will try to corrupt the web client, in this case using the "Aurora Memory Corruption” method. While the exploit used here is malicious, the actual payload is harmless because it only shows a message box. Other payloads like for example deleting the entire hard disk or opening a network connection to the hacker with remote desktop capabilities are easy to add.
Figure 14: Live Internet Explorer exploit
14http://www.metasploit.com/ 15
See tutorial http://projectshellcode.com/?q=node/29
16
However in all of the cases above we are not interested in the detection rate of a certain product but more if we can integrate a 3rd party scanning product into our SIEM test bed environment.
Note that we do not make a distinction between Category 3 Compromised Asset Active and Category 4 Compromised Asset Passive but focus on detecting an infection on a computing device regardless whether that results in an active or a passive compromised asset.
Detection
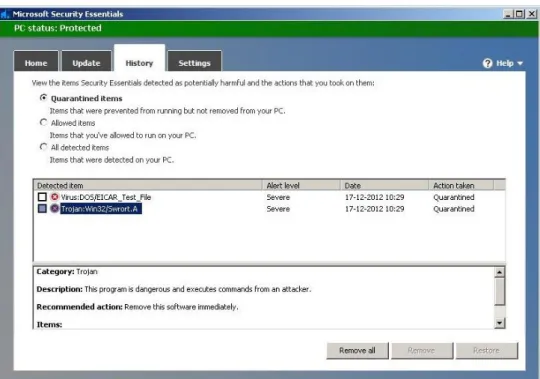
We used Microsoft Security Essentials17 as a scanning/alerting product. If this product detects malware or viruses then it alerts the user by showing a message box (see Figure 15). It detected both the malware (see Figure 16) and the EICAR virus (see Figure 17) and placed them in quarantine. It did not detect the Aurora exploit from the Metasploit suite.
Figure 15: Detect malware/virus infection
17
Figure 16: Trojan
Figure 17: Virus
Integration
Besides an alert message box this specific product also writes entries into the Windows Event Log. In order to integrate this detection product into our SIEM environment we needed to make Splunk aware of the product’s observations and actions. We implemented a log forwarding method by using a Splunk Universal Forwarder18 (UF). A UF is a lightweight Windows service that integrates with Windows Event Log and forwards log entries to Splunk. If Splunk sees an infection then it raises an infection flag in the Dashboard.
18
5.7 Category 13: Failed login attempts Attack
A malicious user tries to gain unauthorized access to a computing system by brute-force guessing a password. If the receiving system does not enbrute-force a password strength policy and even more important a failed login attempt policy then a brute-force attack is a risk.
Detection
We used the Rsyslog19 process to monitor failed login attempts from the auth.log
facility. The Rsyslog process on forwards auth.log entries to Splunk. Integration
Splunk counts the failed login attempts. For example if there are more than 3 failed attempts in a minute then it raises an alert in the Dashboard. Another possibility is to count total numbers over longer periods while factoring in that legitimate users usually make at least one or two mistakes a day while logging in.
19
6
Event detection, reporting and visualization
Apart from defining and simulating the various incidents that were described above we also need an effective way of detecting and visualizing these incidents. For this purpose we have set up a small experimentation network, using an indexing and monitoring software called Splunk, in order to detect them. (For a description of the Splunk tool, see paragraph 3.5) .
This chapter describes the output from this experimentation. 6.1 Splunk Alerts
One of the prominent features of Splunk is its ability to produce alerts, whenever a specified incident is detected. According to a specific rule set that is user defined, Splunk monitors specific data inputs and whenever the specified criteria are met, an alert is issued. The alerts can be customized by the user in terms of severity (low, medium, high) and actions to be taken. The user can instruct Splunk, to perform specific actions when an alert is issued, such as, sending mails to predefined e-mail addresses, sending text messages to predefined phone numbers or running a specific script. All the alerts can be viewed and managed by the Alert Manager. In our experiment, we issued two kinds of alerts, one with High level of severity for the detection of malware by the antivirus and one with Medium level of severity for the detection of a DDOS attacks (detection of SYN flood, a.k.a. large number of half open connections). Figure 6.1 below, shows the Splunk Alert Manager after
detecting the above mentioned incidents and issuing the appropriate alerts.
6.2 Snort dashboard
One of the most useful tools that can be used to track any ICT related anomaly in the network traffic, is the intrusion detection system tool Snort (which can be compared to a deep packet inspection tool, since it can inspect the full IP packet including payload). Snort is an open source network intrusion prevention and detection system (IDS/IPS) developed by Sourcefire. Combining the benefits of signature, protocol, and anomaly-based inspection, Snort is the most widely deployed IDS/IPS technology worldwide. Snort has become the de facto standard for IPS.
Snort can be configured to examine the traffic of the network under observation, for any kind of user defined “abnormality” and mark the corresponding packets with different priorities depending on the severity of the threat. For our experiment, Snort was configured to look for specific “hidden messages” in the network traffic and mark the packets that contain them with priority 3. The rest of the traffic was marked with priority 1 or 2, depending on the contents of the packet, but for the purpose of our experiment only packets marked with priority 3 were of interest. The output of Snort is imported into Splunk through a specific UDP port, in order for the user to be able to easily index, process and visualize the results of the Snort monitoring. Figure 6.2 below, shows the Snort dashboard that was created in Splunk in order to visualize and report the results of the Splunk monitoring.
Figure 6.2: Snort Dashboard
The Snort dashboard is comprised of two panels. The first one (top panel) depicts the real time monitoring of the Snort messages by visualizing in different colors the number of different priority messages that were received per day. The time scale is adaptive and can range from months down to seconds. This panel offers a quick an easy understanding of the amount of different priority messages received per day (or per any other user defined time period).
The second panel depicts in a table the accumulated amount of messages per priority that were received from Snort, since the beginning of the network
observation. In this way the daily number of messages per priority (first panel) can be compared with the total amount of messages per priority (second panel) and offer a quick estimation of the norm or the deviation that is observed. In general, the
Snort dashboard offers a quick and easy detection of user defined “interesting” incidents on the network which can be marked with different priority levels. 6.3 Antivirus dashboard
In order to detect malware attacks the standard Windows Antivirus program was used and its output (in form of log files) was imported into Splunk. A malware, or malicious software is a software used or created by attackers to disrupt computer operation, gather sensitive information, or gain access to private computer systems. It can appear in the form of code, scripts, active content, and other software. 'Malware' is a general term used to refer to a variety of forms of hostile or intrusive software such as viruses, Trojan horses, etc. For our experiment, an Antivirus dashboard was built in Splunk, processing and visualizing the information imported by the Antivirus software. A screenshot of this dashboard is presented in Figure 6.3 below.
Figure 6.3: Antivirus Dashboard
An antivirus software produces a large number of messages, most of which are informative messages and not of particular interest. Splunk sorts through all the messages of the antivirus software and puts them into the appropriate category relative to their content. The number of messages per category can be seen in the first panel (top left) of the dashboard. As can be seen from Figure 6.3, the vast majority of messages are informative messages while a small percentage are Error messages, which refer to an error in the connection between the terminal and the server of the company maintaining the antivirus software.
For our experiment the interesting messages are the “Warning” messages. These messages are issued whenever the antivirus detects a malicious software trying to infiltrate the monitored system. Our Splunk dashboard, analyzes those messages and categorizes them according to the type of malware. The top right panel and the bottom panel of the dashboard depict the different kinds of malware detected in a pie-chart and in a form table, respectively. This dashboard offers a quick and easy overview of the malware attacks attempted on the monitored system.
6.4 File Integrity (tripwire) dashboard
In order to detect the compromising of information or a system, the Tripwire security and data integrity tool was used. This tool functions as a host-based intrusion detection system which detects changes to file system objects. The Tripwire tool monitors user defined, systems, folders and files and reports back (in form of messages) about the situation of these monitored objects.
For our experiment, Tripwire was configured to report in four different states or categories, namely Violations, Changed, Added and Removed. A Tripwire message indicating a Violation in one of the monitored objects indicates that a user defined (e.g. admin) policy has been violated. When a Change is reported it indicates that one of the monitored files has been changed (altered) by a user, while the Added and Removed messages refer to the addition or deletion of an object.
Once more, the output of the Tripwire tool was imported into Splunk and the Tripwire dashboard, which is shown below in Figure 6.4, was created for the purpose of our experiment.
Figure 6.4: Tripwire Dashboard
In the first (top) panel of the Tripwire dashboard a time chart of the accumulated number of each incident is presented. In that way the user can easily observe how many of the monitored objects have been somehow altered and when. By clicking on a specific column in the graph, the “drill down” function of Splunk is activated and the user gets more information about these specific incidents (e.g. detailed time, monitored object, etc.). The second (bottom) panel of the dashboard shows a detailed table with the accumulated number of incidents per category for every time window (which is user defined). This panel can be easily modified to depict other kinds of information or to depict the instantaneous values of the categories instead of the accumulated. This dashboard offers a quick overview of the status of specific monitored objects or systems.
6.5 Repetitive Failed Login (password guessing) dashboard
Another type of attack or intrusion that we want to detect is the case where someone is trying to access a work-station within an internal (e.g. company network) without the proper credentials, plainly speaking whenever someone is trying to guess the password of a work-station.
In order to detect the aforementioned intrusion, the syslog files of the work-stations are periodically imported into Splunk. The periodicity can be chosen by the system administrator and has an impact on the detection time. The failed login attempts on a work-station are written on the syslog file and thus they can be accessed by Splunk. For our experiment, we set the alert threshold to three failed login attempts, meaning that whenever there are three or more failed login attempts in a certain work-station within a five minute window, an alert is raised by Splunk. This is also visualized in the Failed Login dashboard created in Splunk and shown below in Figure 6.5.
Figure 6.5: Failed Login Attempts Dashboard
As can be seen in Figure 6.5 above, the number of failed login attempts per distinct IP address in the network, are monitored. The right hand panel of the dashboard visualizes this information in a radial gauge for ease of use, while the left hand panel presents more information in the form of a table. In this table, apart from the number of failed login attempts, the status of the monitoring is presented (“OK” if less than 3 failed login attempts, “Error” if more than 3 failed login attempts), as well as the IP address of the work-station that is under attack (in this example a pseudo-address was used). This dashboard offers a quick overview of the status of all the work-stations within a network and whether an unauthorized entry attempt is under way.
6.6 DDOS attack dashboard
A Distributed Denial Of Service attack (DDOS) occurs when multiple systems flood the bandwidth or resources of a targeted system, usually one or more web servers. These systems are compromised by attackers using a variety of methods. For our experiment we implemented this by using a SYN flood attack in one of the
network’s servers. A SYN flood is a form of denial-of-service attack in which an attacker sends a succession of SYN requests to a target's system in an attempt to consume enough server resources to make the system unresponsive to legitimate traffic. As a result of these SYN requests, the server maintains a large number of “half-open connections” since these connections are never established by the attacker.
In our experiment, the number of half-open connections of a server were monitored and reported to Splunk through a specific UDP port. The SYN flood dashboard that was created, and is shown below in Figure 6.6, processes and visualizes the results. The top-left panel of the dashboard shows a real time count of the current number of half-open connections. Whenever this number exceeds a user defined threshold (e.g. 200) an alert is issued by Splunk. The top-right panel depicts the same real time information in the form of a table, containing the details of the monitored system (host, sourcetype, etc.). The bottom-right panel visualizes the total number of SYN flood attacks inflicted so far on the server, in the form of a radial gauge for ease of use, while the bottom-left panel depicts the average, minimum and maximum values of half-open connections in order to give an overall feeling about the reported numbers.
Figure 6.6: SYN flood Dashboard
This dashboard offers a quick overview of the status of the system servers and whether one of them is under a DDOS attack.
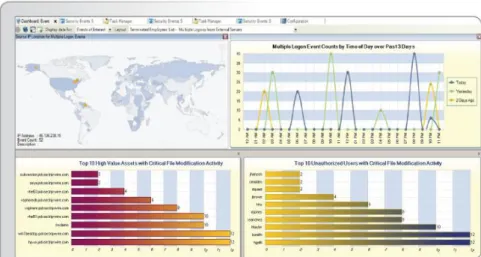
6.7 Overview dashboard
Except for the individual dashboards created for every interesting incident that is detected in our experimental network, an overview dashboard was created that summarizes the status of all the aforementioned dashboards. A screenshot of the overview dashboard is shown below in Figure 6.7.
Figure 6.7: Overview Dashboard
Each of the panels of the overview dashboard depicts the status of the tracking of all the incidents that were described above. If the monitored system is operating
with no problems and no interesting incidents have been detected the status of the corresponding panel shows “OK”. If an interesting incident has been detected (applying the respective thresholds that were described for each incident) then the corresponding panel shows “Warning” or some other appropriate message (e.g. “Virus Detected”). The overview dashboard provides an easy way for the user to monitor the entire system for all interesting events at once. If an interesting incident is pin pointed by the overview dashboard, the user can open the corresponding individual dashboard and acquire more information about the incident.
6.8 Normalization & Correlation
The great advantage of indexing and processing tools such as Splunk is their ability to index, process, normalize and correlate data from different sources and different applications. As described above, there is a variety of different monitoring and security tools that are needed in order to be able to track the different incidents in the monitored network. All of these tools have very different logging and reporting methods for their findings. As long as a tool keeps some kind of written log with the monitoring results (whether in the form of syslog, or csv, or any other kind of machine readable format) these results can be processed by tools like Splunk. The fact that input from different sources can be correlated and combined into one indexing tool strengthens the detection power for the tracked incidents and leads to the creation of powerful and effective detection mechanisms, that were not possible with the use of the individual detection tools.
7
Cyber simulation tooling
This chapter gives a short discussion on the potential use of Opnet for cyber-simulation purposes.
7.1 High Fidelity Cyber Simulation Environment: OPNET
OPNET is the vendor of a suite of products aimed at Application Performance Management (APM). OPNET’s Virtual Network Environment (VNE) Server is for central storage of all information that can be collected in the network. All solutions can make use of that data, for example OPNET Modeller can make a simulation model of the actual network for what-if analyses. OPNET modeller is in the Planner-corner of figure 7.1 below.
Figuur 7.1: Visualisatie van de NetOne product suite van OPNET20.
It is beyond the scope of this document to discuss all OPNET APM products in detail. The various OPNET products contain elements that, if joined, can contribute to a powerful SIEM solution, for example OPNET Sentinel21:
“Sentinel is a software solution for ensuring policy compliance, network auditing and security. It performs automated network-wide configuration audits, analyzing an up-to-date model of your network to diagnose device misconfigurations, policy violations, configuration inefficiencies, and security violations. Sentinel’s intelligent analysis and reporting engine:
Employs a powerful model-driven auditing approach and rules-based analysis engine to pinpoint configuration mistakes and differences not detectable through traditional string matching techniques.
20
http://www.opnet.com/solutions/network_management/index.html
21
Offers over 1,000 out-of-the-box rules based on industry best-practices (e.g., Cisco SAFE, CIS Benchmarks), security standards (e.g., PCI-DSS, DISA STIG, HIPAA), and expert knowledge.
Provides simple, flexible checking of any command line output from devices (using templates and string-matching).
Allows easy customization of rules and templates to ensure conformance to individual organizational standards and requirements.”
OPNET intends to aim for the cyber security market as indicated on its website:22
“OPNET’s Cybersecurity Services enable planning, analysis, and performance optimization of critical IT infrastructure and mission-critical enterprise services to ensure network health, integrity, and security.
Capabilities
Cleared staff for National Security and Intelligence Community consulting.
Cyber effects modeling and simulation for Computer Network Attack and Defense (CNA and CND) scenario analysis.
Network security configuration audits and change validation.
Application performance impact analysis of cyber attacks.
Security rule development for network configuration audits.
Situational awareness and pre-planned course of action studies”
Figure 7.3 below illustrates the Gartner market quadrant for Application Performance monitoring, illustrating OPNET’s position.
Figure 7.3: Gartner report on Application Performance Monitoring August 2012.
There are other cyber-simulation tools on the market, like Exata from scalable Networks (see http://www.scalable-networks.com/content/products/exatacyber). Exata can study “What if”-scenarios through High Fidelity simulation with Hardware in the Loop of many live systems.
22
http://www.opnet.com/services/cyber-security.html &
7.2 OPNET Cyber simulation example
A simple example of the Cyber capability the is under development by OPNET was shown at the OPNETWORK2012 conference in Washington DC at the end of August. In a demo booth they showed that their combined tools could detect an SQL insertion attack. The method an workflow are shown in the figures depicted below.
Figure 7.4: OPNET Cyber example capability to detect who is attacking the infrastructure.
Figure 7.6: OPNET Cyber example capability: attacker extracts data via DNS.
The Application Characterization Environment of the product suite is very suitable to monitor the network traffic flow and to quick pinpoint potential problems. For example, figure 7.7 below shows the number of connection resets during a relatively short time of capturing network traffic in the TNO Cyber test-bed. The network activity was initiated by the workstation “bt.ict.tno.nl” on top.
Figure 7.7: Screenshot of the OPNET ACE environment after a short capture of network activity. Note the large number of connection resets between bt.ict.tno.nl and snort-doos.ict.tno.nl (blue line).
Regarding the large number of connection resets (RST’s) in figure 7.7: one of the problems for detecting the SYN flood was that the attacking PC sent a lot of TCP RST packets which made the attacked PC delete its connection statistics table, i.e.: no flood problem at all on the server. The reason for this was that the networking library that was used for the attack to send out SYN packets (Scapy), resulted in SYN-ACK packets from the server sent to the client but the Operating System on the client (Linux) was not aware of having sent any packets at all and therefore the OS sends RST packets to the server. This was solved by blocking outgoing RST packets on the attacking client with a netfilter/iptables rule.
Figure 7.8 shows the number of packets exchanged over the network between the connected work stations. Note the relatively large number of packets send to wndr.3700v2.ict.tno.nl
Figure 7.8. Screenshot of the OPNET ACE environment after a short capture of network activity showing the number of network packets that were exchanged during a brief period of capturing traffic in the TNO Cyber test-bed.
The ACE environment has the intelligence to make suggestions on possible root causes of potential problems in network performance indicators such as application response times.
The captured traffic showed in the figures above can be cleaned of unwanted traffic to produce traffic traces generated by specified transactions. The traffic traces can then be deployed on simulated networks to study scalability and network modification issues. For instance, if a large number of workstations in a tactical deployment are going to report a virus infection to a strategic SIEM environment which monitors them over a thin SATCOM link: how much traffic will there be involved? How much time is there involved before all of them have reported the infection? Is this done by a TCP connection? Is the TCP traffic optimized for the SATCOM link? Is there still other traffic possible over the link? Et cetera. These questions can be answered very quickly via the ACE product in combination with OPNET Modeller. No detailed knowledge of the actual virus scanner and monitoring implementations are required. Subsequently, when a product upgrade of them have to be installed, the only thing that is required is to record a new traffic trace and run the simulations again.
The tightly integrated set OPNET products is very suitable for studying “What-if” scenarios with large scale virtual networks connected to a limited set of real hardware elements.
8
Conclusions
With respect to the research questions listed in the Introduction chapter we conclude:
1. A big challenge in SIEM is deciding what you want to detect, i.e. a bottom-up approach. If you start with “we want to detect everything” then you will end up with nothing because of information overload.
2. Detecting an attack can be done a) centrally at the SIEM product or b) locally at some sensor or c) both with small bits and pieces of detection logic in between SIEM and sensor.
3. The lack of representative test data or a good way of simulating them is a real problem. A live or a simulated test environment that provides realistic test data would have been of great value. Use of cyber simulation tooling can help, but this should be looked into more deeply.
4. An important factor for the success of the integration of tools is the flexibility or openness of the used tools, or at least availability of open interfaces. If a software component is open it is much easier to synchronize it and make it compatible with a SIEM product.