C160-E009
Thermal Analysis 60 Series
Application Data Book
Contents
1. Melting of Fats and Oils
1.1 Chocolate --- 1 1.2 Olive Oil --- 3 1.3 Margarine --- 4
2. Degradation of Cooking Oil by Oxidation
2.1 Salad Oil --- 5 2.2 Sesame Oil --- 6
3. Gelatinization of Starch
3.1 Flour --- 7 3.2 Corn --- 84. Retrogradation of Starch
4.1 Bread --- 95. Measurement of Moisture in Starch Gel
5.1 Sweet Potato Starch Gel --- 11 5.2 Flour Starch Gel --- 12
6. Liquor
6.1 Whiskey --- 13 6.2 Brandy --- 14
7. Fish Meat
7.1 Fresh Carp Meat --- 15
8. Water of Crystallization and Free Water
8.1 Measurement of Saccharin Sodium --- 17
9. Investigation of Freeze Drying Conditions
9.1 30% Glucose Aqueous Solution --- 19 9.2 60% Glucose Aqueous Solution --- 20 9.3 3% Salt Solution --- 21
10. Melting of Pharmaceuticals
10.1 Melting of Aspirin --- 22
11. Investigation of Crystal Polymorphism
11.1 Sulfathiazole --- 23 11.2 Indomethacin --- 25 11.3 Suppository --- 27
12. Interactions between Pharmaceuticals and Additives
12.1 Benzoic Acid and Magnesium Oxide --- 29
13. Thermostability Testing
13.1 Cyclobarbital --- 31
14. Purity Measurement
14.1 Purity Measurement of Benzoic Acid --- 33
15. TG-DTA Measurement
15.1 Sodium Tartrate --- 34 15.2 Cyclodextrin --- 35 NH O SO2 Oil1
1.1 Chocolate
■Explanation
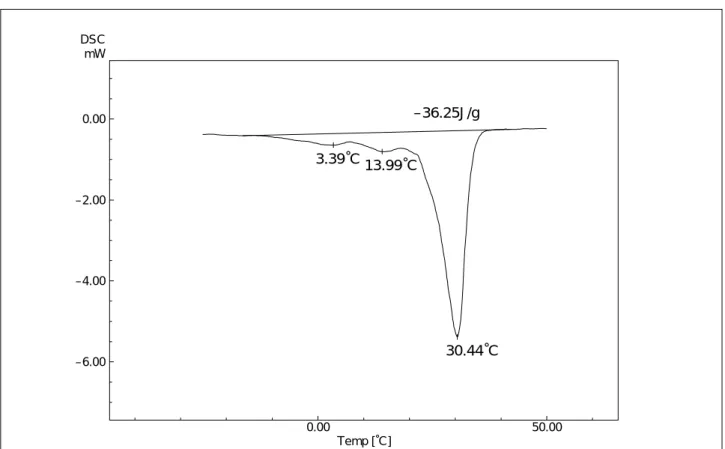
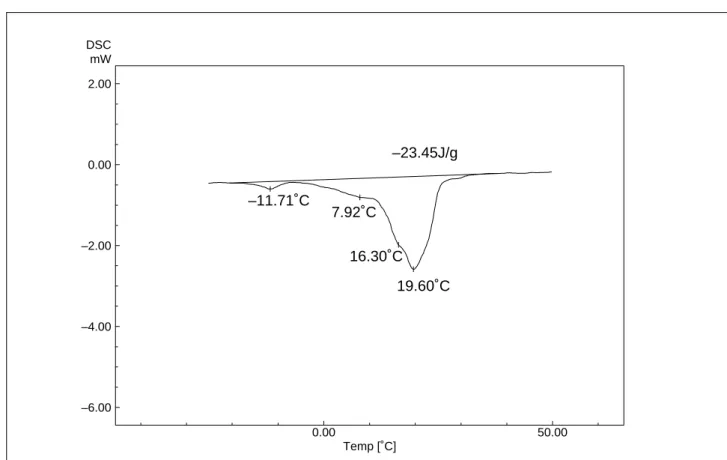
DSC (Differential Scanning Calorimeters) analyzes melting processes of cooking oils. Cocoa butter, an ingredient of chocolate, exhibits 6 crystal structures, of which the type V-crystal is said to be stable against heat. Because the V-type crystal melts at around 34˚C, its existence in chocolate can be examined by DSC. Fig 1.1.1 shows the DSC curve of chocolate heated at 3˚C/min. Fig. 1.1.2 shows the DSC curve of the same chocolate when it is once melted, cooled to -50˚C for crystallization and then reheated. The peak at 30.4˚C has completely disappeared.
■Analytical Conditions
Instrument : DSC-60 Sample name : Chocolate Sample weight : 22.87 mg Atmospheric gas : Nitrogen Gas flow rate : 30 mL/min [Temperature program] Heating rate : 3˚C/min
0.00 50.00 Temp [˚C] –6.00 –4.00 –2.00 0.00 DSC mW 30.44˚C 13.99˚C 3.39˚C –36.25J/g
Fig. 1.1.1 First measurement of chocolate
2 0.00 50.00 Temp [˚C] –6.00 –4.00 –2.00 0.00 2.00 DSC mW –23.45J/g –11.71˚C 19.60˚C 16.30˚C 7.92˚C
3
1.2 Olive Oil
■Explanation
This section shows the measurement of the melting of olive oil. The exothermic peak at -29.8˚C due to crystallization and the melting peak at -5.4˚C are clearly observed.
■Analytical Conditions
Instrument : DSC-60 Sample name : Olive oil Sample weight : 18.2 mg Atmospheric gas : Nitrogen Gas flow rate : 30 mL/min [Temperature program] Heating rate : 3˚C/min
–50.00 0.00 Temp [˚C] –5.00 0.00 DSC mW –29.76˚C –5.36˚C 14.73J/g –65.71J/g
Fig. 1.2.1 DSC curve for olive oil
1. Melting of Fats and Oils
4 –40.00 –20.00 0.00 20.00 Temp [˚C] –6.00 –4.00 –2.00 0.00 2.00 DSC mW –21.73˚C –9.68˚C –33.00˚C 22.40˚C –0.20˚C 12.83˚C –33.00˚C –16.60˚C –5.45˚C 3.91˚C 22.40˚C 20.57J/g 40.76J/g 54.10J/g 74.35J/g 27.66% 54.81% 72.76% 100.00%
Fig. 1.3.1 DSC curve for margarine
1.3 Margarine
■Explanation
The fats and oils in margarine include triglycerides consisting of various types of fatty acids. With the margarine analyzed, melting peaks of various triglycerides are visible across a wide range of temperatures (from -33 to +22.4˚C). In this example, the partial area analysis program was used to calculate the heat of fusion from peak-start to specified temperatures.
■Analytical Conditions
Instrument : DSC-60
Software used : Partial Area Analysis Program Sample name : Margarine
Sample weight : 19.57 mg Atmospheric gas : Nitrogen Gas flow rate : 30 mL/min [Temperature program] Heating rate : 3˚C/min
5
2.1 Salad Oil
■Explanation
Properties of cooking oil, such as taste, smell and color, change with long term storage or heating. The main cause of these changes is oxidation. TG (Thermogravimetry) can measure the changes in mass due to oxidation. The results of TG can be used to determine storage conditions, estimate shelf life and evaluate antioxidants. In this example, salad oil was heated in oxygen. Absorption of oxygen began at 153.5˚C and the weight increased by 0.95%. The surface area of the sample influences the weight increase. This test used a special cell of 10 ø diameter.
■Analytical Conditions
Instrument : TGA-50 Sample name : Salad oil Sample weight : 22.85 mg Atmospheric gas : Oxygen Gas flow rate : 30 mL/min [Temperature program] Heating rate : 2˚C/min
100.00 150.00 200.00 Temp [˚C] 97.00 98.00 99.00 100.00 101.00 102.00 TGA % 0.950% 153.45˚C
Fig. 2.1.1 TG curve for salad oil in oxygen
Oil
6 100.00 150.00 200.00 Temp [˚C] 97.00 98.00 99.00 100.00 101.00 102.00 TGA % 0.310% 152.38˚C
Fig. 2.2.1 TG curve for sesame oil in oxygen
2.2 Sesame Oil
■Explanation
In this example, sesame oil was heated in oxygen. Absorption of oxygen began at 152.4˚C and the weight increased by 0.31%.
■Analytical Conditions
Instrument : TGA-50 Sample name : Sesame oil Sample weight : 23.532 mg Atmospheric gas : Oxygen Gas flow rate : 30 mL/min [Temperature program] Heating rate : 2˚C/min
7
3.1 Flour
■Explanation
Starches gelatinize when heated with water. The gelatinization reaction can be analyzed by DSC because it is accompanied by endothermic reaction. This test measured flour starch (17.4%).
■Analytical Conditions
Instrument : DSC-60 Sample name : Flour Sample weight : 4.21 mg Atmospheric gas : Nitrogen Gas flow rate : 30 mL/min [Temperature program] Heating rate : 5˚C/min
20.00 40.00 60.00 80.00 100.00 Temp [˚C] –1.00 0.00 1.00 DSC mW 59.10˚C
Fig. 3.1.1 Gelatinization temperature of wheat flour (17.4%)
8 40.00 60.00 80.00 Temp [˚C] –1.00 0.00 1.00 DSC mW 68.90˚C
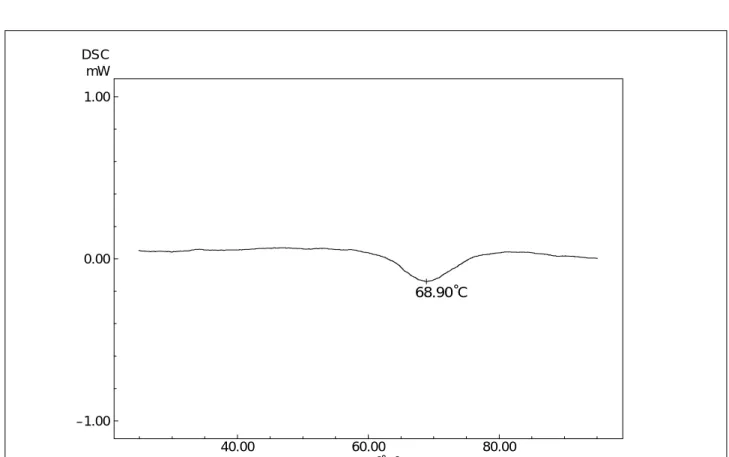
Fig. 3.2.1 Gelatinization temperature of corn (19.9%)
3.2 Corn
■Explanation
This test measured cornstarch (19.9%). The gelatinization temperature of starch varies with additions such as sucrose or salt.
■Analytical Conditions
Instrument : DSC-60 Sample name : Corn Sample weight : 4.97 mg Atmospheric gas : Nitrogen Gas flow rate : 30 mL/min [Temperature program] Heating rate : 5˚C/min
9
4.1 Bread
■Explanation
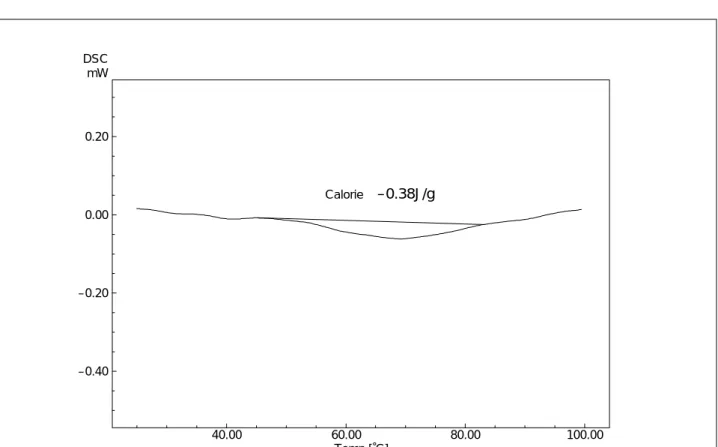
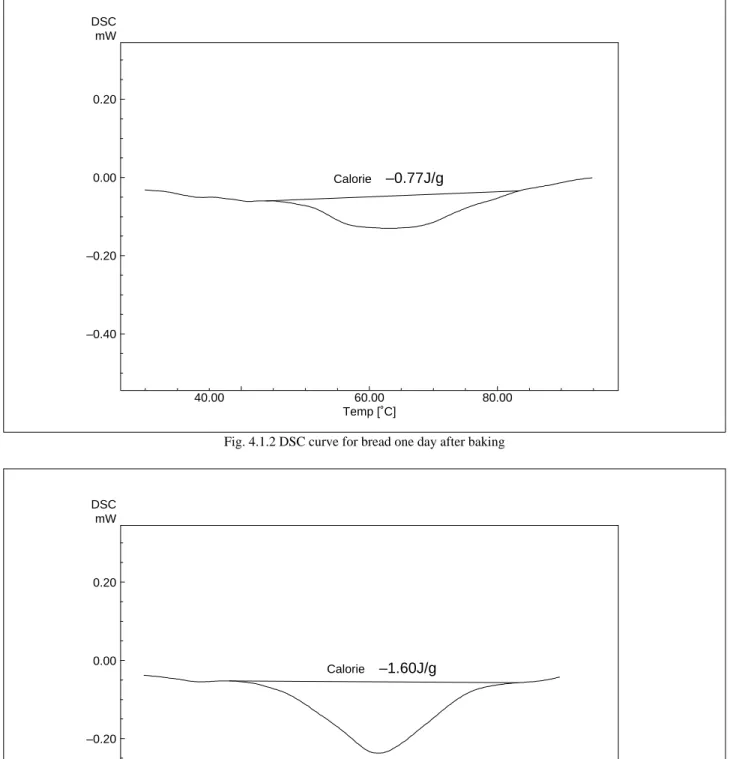
When starch is heated with water for gelatinization and then let stand, the association and rearrangement of amylopectin in swelled starch particles proceed to gradually harden the particles. This process is called the retrogradation of starch. This example shows the measurement of bread. Fig. 4.1.1 shows freshly baked bread, Fig. 4.1.2 bread one day after baking, and Fig. 4.1.3 bread three days after baking. The peak area increases with the increase in the storage period.
■Analytical Conditions
Instrument : DSC-60 Sample name : Bread Sample weight(Fig. 4.1.1) : 13.25 mg
(Fig. 4.1.2) 13.85 mg (Fig. 4.1.3) 12.28 mg Atmospheric gas : Nitrogen Gas flow rate : 30 mL/min [Temperature program]
Heating rate : 10˚C/min
40.00 60.00 80.00 100.00 Temp [˚C] –0.40 –0.20 0.00 0.20 DSC mW –0.38J/g Calorie
Fig. 4.1.1 DSC curve for freshly baked bread
10 40.00 60.00 80.00 Temp [˚C] –0.40 –0.20 0.00 0.20 DSC mW –1.60J/g Calorie
Fig. 4.1.3 DSC curve for bread three days after baking
40.00 60.00 80.00 Temp [˚C] –0.40 –0.20 0.00 0.20 DSC mW –0.77J/g Calorie
11
5.1 Sweet Potato Starch Gel
■Explanation
In starch gel, weakly bonded free water and strongly bonded bound water exist. The melting point of the water varies depending on the bonding conditions. The peak at -8.7˚C is the melting of the bound water and -3.8˚C the free water.
■Analytical Conditions
Instrument : DSC-60
Sample name : Sweet Potato Starch Gel Sample weight : 11.98 mg
Atmospheric gas : Nitrogen Gas flow rate : 30 mL/min [Temperature program] Heating rate : 2˚C/min
–40.00 –20.00 0.00 20.00 40.00 Temp [˚C] –5.00 0.00 5.00 DSC mW –8.70˚C –3.80˚C
Fig. 5.1.1 Melting of water in sweet potato starch gel
12 –40.00 –20.00 0.00 20.00 40.00 Temp [˚C] –10.00 –5.00 0.00 DSC mW –4.30˚C –9.80˚C
Fig. 5.2.1 Melting of water in flour starch gel
5.2 Flour Starch Gel
■Explanation
Wheat flour tests showed bound water melting at -9.8˚C and free water at -4.3˚C.
■Analytical Conditions
Instrument : DSC-60 Sample name : Flour Starch Gel Sample weight : 12.12 mg Atmospheric gas : Nitrogen Gas flow rate : 30 mL/min [Temperature program] Heating rate : 2˚C/min
13
6.1 Whiskey
■Explanation
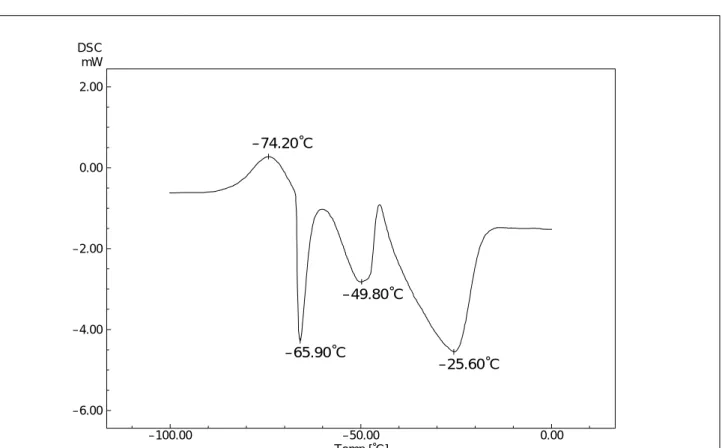
Whiskey was sealed in a hermetic cell and measured by DSC. The exothermic peak at -74.2˚C is due to crystallization. The peak at -65.9˚C shows the melting of ethanol, -49.8˚C the eutectic point of ethanol and water, and -25.6˚C the melting of water. The height of the eutectic peak varies depending on the storage period of the malt.
■Analytical Conditions
Instrument : DSC-60 Sample name : Whiskey Sample weight : 13.7 mg Atmospheric gas : Nitrogen Gas flow rate : 30 mL/min [Temperature program] Heating rate : 10˚C/min
–100.00 –50.00 0.00 Temp [˚C] –6.00 –4.00 –2.00 0.00 2.00 DSC mW –74.20˚C –65.90˚C –49.80˚C –25.60˚C
Fig. 6.1.1 DSC curve for whiskey
6. Liquor
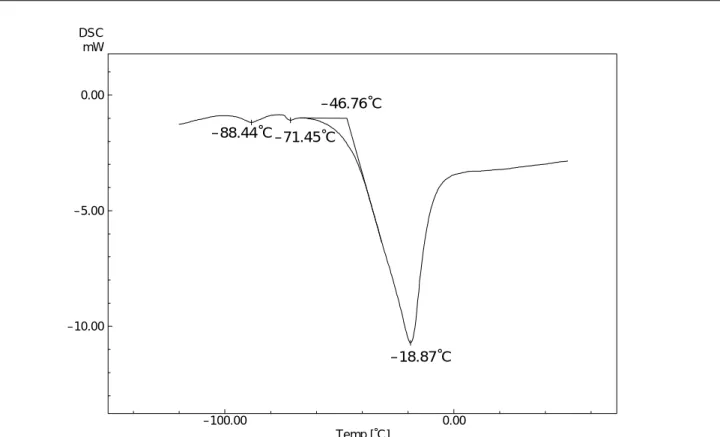
14 –100.00 0.00 Temp [˚C] –10.00 –5.00 0.00 DSC mW –88.44˚C –71.45˚C –18.87˚C –46.76˚C
Fig. 6.2.1 DSC curve for brandy
6.2 Brandy
■Explanation
Brandy was sealed in a hermetic cell and measured by DSC.
■Analytical Conditions
Instrument : DSC-60 Sample name : Brandy Sample weight : 9.11 mg Atmospheric gas : Nitrogen Gas flow rate : 30 mL/min [Temperature program] Heating rate : 10˚C/min
15
7.1 Fresh Carp Meat
■Explanation
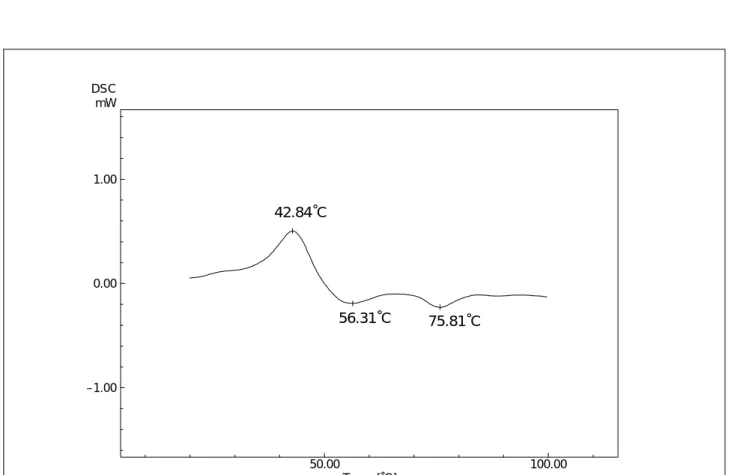
DSC analyzed the freshness of carp meat. With the most fresh carp meat, an exothermic peak at 42.8˚C and endothermic peaks at 56.3˚C and 75.8˚C were observed (Fig. 7.1.1). With carp meat after 6 hours, a minute exothermic peak at 37.0˚C and endothermic peaks at 54.3˚C and 75.7˚C were observed (Fig. 7.1.2). With carp meat after 24 hours, endothermic peaks at 42.3˚C, 55.1˚C and 73.1˚C were observed but no exothermic peak was observed (Fig. 7.1.3). The endothermic peaks at 42˚C and around 73˚C are due to the denaturation of myosin and actin, respectively. The exothermic peak at around 40˚C corresponds to the shrinkage of myosin and actin caused by ATP remaining in the fish meat. The amount of ATP remaining varies with the storage period.
■Analytical Conditions
Instrument : DSC-60 Sample name : Carp Meat Sample weight(Fig. 7.1.1) : 25.4 mg
(Fig. 7.1.2) 24.5 mg (Fig. 7.1.3) 26.5 mg Atmospheric gas : Nitrogen Gas flow rate : 30 mL/min [Temperature program]
Heating rate : 5˚C/min
50.00 100.00 Temp [˚C] –1.00 0.00 1.00 DSC mW 42.84˚C 56.31˚C 75.81˚C
Fig. 7.1.1 DSC curve for fresh fish meat
7. Fish Meat
16 50.00 100.00 Temp [˚C] –1.00 0.00 1.00 DSC mW 42.28˚C 55.05˚C 73.07˚C
Fig. 7.1.3 DSC curve for fish meat after 24 hours
50.00 100.00 Temp [˚C] –1.00 0.00 1.00 DSC mW 36.97˚C 54.25˚C 75.65˚C
17
8.1 Measurement of Saccharin Sodium
■Explanation
When sweetener saccharine sodium is analyzed by TG two-stage weight loss due to dehydration is observed (Fig. 8.1.1). Normally, water removed below 100˚C is free water and water removed at 100˚C or more is water of crystallization. In actuality, however, some water of crystallization is removed below 100˚C. DSC measurement strictly distinguishes between free and water of crystallization. When the sample is sealed in a pressure-tight hermetic cell and measured by DSC, water exhibiting an endothermic peak is water of crystallization and water without the endothermic peak is free water. Two endothermic peaks were observed with saccharine sodium (Fig. 8.1.2). The peak at 61.6˚C corresponds to water of crystallization.
■Analytical Conditions
Instrument(Fig. 8.1.1) : TGA-50 (Fig. 8.1.2) DSC-60 Sample name : Carp Meat Sample weight(Fig. 8.1.1) : 17.2 mg
(Fig. 8.1.2) 14.1 mg Atmospheric gas : Nitrogen Gas flow rate : 30 mL/min [Temperature program]
Heating rate : 10˚C/min
(For both TGA and DSC)
50.00 100.00 150.00 Temp [˚C] 80.00 90.00 100.00 TGA % –1.00 0.00 1.00 2.00 3.00 4.00 DrTGA mg/min –3.037% –5.116% 50.10˚C 129.20˚C TG curve Derivative curve
Fig. 8.1.1 TG-DTG curve for saccharine sodium
NH O
18 0.00 50.00 100.00 150.00 200.00 Temp [˚C] –10.00 –5.00 0.00 DSC mW 61.60˚C 151.20˚C
19
9.1 30% Glucose Aqueous Solution
■Explanation
DSC can analyze the relationship between the concentration and freezing conditions of a glucose aqueous solution.
In this example, the glucose has partially transformed to amorphous state. The minute peak at -62.7˚C shows glass transition, and the exothermic peak at -47.3˚C crystallization. The large endothermic peak at -17.6˚C corresponds to melting.
■Analytical Conditions
Instrument : DSC-60
Sample name : 30% glucose aqueous solution Sample weight : 8.0 mg
Atmospheric gas : Nitrogen Gas flow rate : 30 mL/min [Temperature program] Heating rate : 10˚C/min
–50.00 0.00 Temp [˚C] –5.00 0.00 DSC mW –47.30˚C –62.71˚C –17.55˚C
Fig. 9.1.1 DSC curve for 30% glucose aqueous solution
20 –100.00 –50.00 0.00 Temp [˚C] –5.00 0.00 5.00 DSC mW –36.80˚C –22.70˚C –46.82˚C –89.15˚C
Fig. 9.2.1 DSC curve for 60% glucose aqueous solution
9.2 60% Glucose Aqueous Solution
■Explanation
The change at -89.2˚C shows glass transition and the exothermic peak at -36.8˚C crystallization. Because the areas of the crystallization peak at -36.8˚C and the melting peak at -22.7˚C are approximately equal, it is conceivable that the sample has mostly transformed to the amorphous state after freezing.
■Analytical Conditions
Instrument : DSC-60
Sample name : 60% glucose aqueous solution Sample weight : 8.0 mg
Atmospheric gas : Nitrogen Gas flow rate : 30 mL/min [Temperature program] Heating rate : 10˚C/min
21
9.3 3% Salt Solution
■Explanation
With a 3% salt solution, a eutectic peak was detected at -23.6˚C. Generally, freeze drying is properly done at or below the eutectic temperature.
■Analytical Conditions
Instrument : DSC-60 Sample name : 3% salt solution Sample weight : 6.99 mg Atmospheric gas : Nitrogen Gas flow rate : 30 mL/min [Temperature program] Heating rate : 10˚C/min
–50.00 0.00 50.00 Temp [˚C] –40.00 –30.00 –20.00 –10.00 0.00 10.00 DSC mW –23.58˚C –2.20˚C
Fig. 9.3.1 DSC curve for 3% salt solution
22 50.00 100.00 150.00 Temp [˚C] –10.00 –5.00 0.00 DSC mW 135.90˚C –167.03J/g
Fig. 10.1.1 DSC curve for aspirin
10.1 Melting of Aspirin
■Explanation
Melting point and melting heat are fundamental thermophysical characteristics of pharmaceuticals and DSC can determine them. This example shows measurement of acetylsalicylic acid (aspirin), which has antipyretic analgesic and anti-inflammatory effects.
■Analytical Conditions
Instrument : DSC-60 Sample name : Aspirin Sample weight : 3.09 mg Atmospheric gas : Nitrogen Gas flow rate : 30 mL/min [Temperature program] Heating rate : 5˚C/min
23
11.1 Sulfathiazole
■Explanation
Generally, solubility of a substance differs depending on its crystal form. Therefore, crystal polymorphism is an important issue in pharmaceutical fields. Polymorphism is easily measured with DSC. Fig. 11.1.1 shows endothermic peaks at 168.3˚C and 202.2˚C. However, in Fig. 11.1.2, where sulfathiazole was heated to 185˚C, the peak at 168.3˚C has disappeared. The peak at 168.3˚C suggests the existence of an unstable crystal form.
■Analytical Conditions
Instrument : DSC-60 Sample name : Sulfathiazole Sample weight : 3.88 mg Atmospheric gas : Nitrogen Gas flow rate : 30 mL/min [Temperature program] Heating rate : 5˚C/min
100.00 200.00 Temp [˚C] –10.00 –5.00 0.00 DSC mW 168.29˚C 175.76˚C 202.23˚C 201.15˚C
Fig. 11.1.1 DSC curve for sulfathiazole (original)
24 100.00 200.00 Temp [˚C] –10.00 –5.00 0.00 DSC mW 202.00˚C 199.84˚C
25
11.2 Indomethacin
■Explanation
This example shows the measurement of indomethacin with anti-inflammatory effect. Indomethacin may also show crystal polymorphism. In Fig. 11.2.1, melting is observed at 159.7˚C but in Fig. 11.2.2, melting occurs at 156.7˚C and there is also a minute endothermic peak at 145.9˚C.
■Analytical Conditions
Instrument : DSC-60 Sample name : Indomethacin Sample weight(Fig. 11.2.1) : 2.97 mg
(Fig. 11.2.2) 3.09 mg Atmospheric gas : Nitrogen Gas flow rate : 30 mL/min [Temperature program]
Heating rate : 10˚C/min
100.00 150.00 200.00 Temp [˚C] –15.00 –10.00 –5.00 0.00 DSC mW 159.65˚C 161.00˚C
Fig. 11.2.1 DSC curve for indomethacin (No. 1)
26 100.00 150.00 200.00 Temp [˚C] –10.00 –5.00 0.00 DSC mW 159.90˚C 145.90˚C 156.74˚C
27
11.3 Suppository
■Explanation
The triglycerides used in suppositories exist in several crystal forms and these crystal forms vary with heat processing. A commercial suppository shows a melting peak at 37.6˚C (Fig. 11.3.1). However, when the same suppository is crystallized by cooling after melting, the peak shifts to 32.9˚C (Fig. 11.3.2), showing a significant change in the melting process.
■Analytical Conditions
Instrument : DSC-60 Sample name : Suppository Sample weight : 8.92 mg Atmospheric gas : Nitrogen Gas flow rate : 30 mL/min [Temperature program] Heating rate : 3˚C/min
0.00 50.00 Temp [˚C] –5.00 0.00 DSC mW 21.04˚C 37.61˚C 32.30˚C –137.19J/g
Fig. 11.3.1 DSC curve for commercial suppository
28 0.00 50.00 Temp [˚C] –5.00 0.00 DSC mW 32.91˚C –101.11J/g 30.10˚C
29
12.1 Benzoic Acid and Magnesium Oxide
■Explanation
Various additives are added to pharmaceuticals. DSC allows simple verification of whether or not the additives have converted to other substances due to reactions. This example shows an examination of interactions between benzoic acid and magnesium oxide. Fig. 12.1.1 shows the result for benzoic acid alone, sealed in a hermetic cell. Melting is visible at 122.7˚C. Fig. 12.1.2 shows the result for magnesium oxide alone and no changes were observed. Fig. 12.1.3 shows DSC measurement of a 1:1 mixture of benzoic acid and magnesium oxide, mixed mechanically. This shows a completely different pattern from the DSC curves when the two components were analyzed individually. It suggests some kind of interaction between the two substances.
■Analytical Conditions
Instrument : DSC-60
Sample name (Fig. 12.1.1) : Benzoic acid Sample weight : 4.83 mg
Sample name (Fig. 12.1.2) : Magnesium oxide Sample weight : 4.38 mg
Sample name (Fig. 12.1.3) : Benzoic acid and magnesium oxide Sample weight : 2.18 mg
[Temperature program]
Heating rate : 10˚C/min
50.00 100.00 150.00 Temp [˚C] –30.00 –20.00 –10.00 0.00 10.00 DSC mW 122.66˚C
Fig. 12.1.1 DSC curve for benzoic acid
30 50.00 100.00 150.00 Temp [˚C] –2.00 0.00 2.00 4.00 6.00 DSC mW 108.49˚C 111.49˚C 160.44˚C
Fig. 12.1.3 DSC curve for 1:1 mixture of benzoic acid and magnesium oxide
50.00 100.00 150.00 Temp [˚C] –2.00 0.00 2.00 DSC mW
31
13.1 Cyclobarbital
■Explanation
This example shows measurements of cyclobarbital in nitrogen at heating speeds of 3, 5, 7.5, and 10˚C/min. The following reaction speed formula is used when performing reaction speed analysis.
dx/dt = a exp ( -∆E/RT) (1-C)n-1
dx/dt : reaction speed C : reaction rate
a : frequency factor T : absolute temperature
∆E : activation energy n : reaction order R : gas constant
Chemical reactions are measured at various heating rates by TGA according to this reaction formula. Plotting the inverse of the temperature (1/T) for a certain weight loss rate and the log of the heating rate (LOG A) gives a linear curve (Ozawa plot) and the activation energy (∆E) is obtained from its slope. An activation energy of 109.2KJ/mol was obtained in this example. When reaction speed parameters such as the frequency factor and reaction order are calculated, isothermal analysis becomes possible and the reaction rate at different temperatures and required reaction times can be obtained. This test gives the prediction that, if kept at 30˚C, the decomposition will have progressed to 20% in 3.69×10⁶ hours (about 421 years).
■Analytical Conditions
Instrument : TGA-50
Used software : Kinetics Analysis Program for TGA Sample name : Cyclobarbital
Sample weight : 9.187 mg Atmospheric gas : Nitrogen Gas flow rate : 30 mL/min [Temperature program]
Heating rate : 3, 5, 7.5, 10˚C/min
32 0.00 2.00 4.00 6.00 8.00 ×10⁷ Time [hour] 0.00 0.50 1.00 C
Activation energy 109.22kJ/mol Analysis temperature 30.00˚C Reaction time [hour]
0.10 1.69 × 10⁶ 0.20 3.69 × 10⁶ 0.30 6.18 × 10⁶ 0.40 9.51 × 10⁶ 0.50 1.36 × 10⁷ 0.60 1.87 × 10⁷ 0.70 2.48 × 10⁷ 0.80 3.29 × 10⁷ 0.90 5.06 × 10⁷
Fig. 13.1.2 Inference of reaction time for cyclobarbital kept at 30˚C
TGA % LOG A 1.05 100.00 80.00 0.85 0.65 0.45 0.00 100.00 1.72 1.82 1/T [/K] 1.92 2.02 ×10⁻³ 200.00 Temp [˚C] 300.00 400.00 Reduction [%] 86.50 69.50 52.50 35.50 18.50 Average 109.22 Standard deviation 4.883 Coefficient of variation 4.471 [%] Activation energy [kJ/mol] 110.75 107.14 105.20 105.92 117.07
33
14.1 Purity Measurement of Benzoic Acid
■Explanation
The van’t Hoff formula is applied in the computation of purity using DSC.
Ti= T0-XRT0 2/∆Hf˚⋅1/Fi Ti : sample temperature (K)
T0 : melting temperature of the pure substance (K) X : molar fraction of the impurities in the sample R : gas constant (J/mol K)
∆Hf˚ : melting heat in the sample (J/mol)
Fi : melted fraction of the sample at temperature T Here, the melted fraction is the ratio of melting heat absorbed by the sample by temperature Ti to the whole melting heat.
In the formula above, a linear curve is obtained from Ti and 1/Fiand the slope of that curve can determine X. The purity of benzoic acid computed here was 99.93%.
■Analytical Conditions
Instrument : DSC-60
Used software : Purity Determination Program Sample name : Benzoic acid
Sample weight : 2.98 mg Atmospheric gas : Nitrogen Gas flow rate : 30 mL/min [Temperature program] Heating rate : 1˚C/min
110.00 120.00 130.00 Temp [˚C] –6.00 –4.00 –2.00 0.00 2.00 DSC mW 121.12˚C Start point 124.84˚C End point 122.62˚C Peak –136.35J/g Heat 99.93% Purity 0.00 10.00 20.00 1/F 122.20 122.30 122.40 122.50 Temp ˚C
Fig. 14.1.1 Purity measurement of benzoic acid by DSC curve
34 0.0 100.0 200.0 300.0 Temp [˚C] 50.0 60.0 70.0 80.0 90.0 100.0 TGA % –500.0 0.0 500.0 1000.0 DTA µV 74.49˚C 137.06˚C 273.89˚C –5.140% –10.534% –15.673% TG curve DTA curve
Fig. 15.1.1 TG-DTA curve for sodium tartrate
15.1 Sodium Tartrate
■Explanation
Sodium tartrate dehydrate was measured by DTG. From the calculation of molecular weights, the 15.7% weight loss observed between 45˚C and 170˚C is supposed to be the desorption of two molecules of water. TG shows 2-stage weight loss. The first loss (desorption of the first molecule) occurs slowly and the second loss starts before the completion of the first reaction. DTA shows endothermic peaks at 74.5˚C and 137˚C, which correspond to the desorption of two water molecules. Note that the weight loss and endothermic and exothermic peaks starting at around 240˚C are due to decomposition.
■Analytical Conditions
Instrument : DTG-60 Sample name : Sodium tartrate Sample weight : 12.18 mg Atmospheric gas : Air Gas flow rate : 50 mL/min [Temperature program] Heating rate : 10˚C/min
35
15.2 Cyclodextrin
■Explanation
Cyclodextrin was measured with DTG. Decomposition starts at around 250˚C. The DTA curve shows complex peak patterns because the endothermic and exothermic reactions occur simultaneously. Cyclodextrin has a ring structure and takes in water in the form of inclusion water. The release of the inclusion water is observed at around 81˚C.
■Analytical Conditions
Instrument : DTG-60 Sample name : Cyclodextrin Sample weight : 10.82 mg Atmospheric gas : Air Gas flow rate : 50 mL/min [Temperature program] Heating rate : 10˚C/min
0.0 100.0 200.0 300.0 400.0 500.0 Temp [˚C] 0.0 100.0 TGA % –100.0 0.0 100.0 200.0 DTA µV 81.05˚C 289.83˚C 322.76˚C 364.13˚C –11.368% –66.959% TG curve DTA curve
Fig. 15.2.1 TG-DTA curve for cyclodextrin
15. TG-DTA Measurement
yp
p
Printed in Japan 3295-06310-10A-IK
SHIMADZU CORPORATION. International Marketing Division
3. Kanda-Nishikicho 1-chome, Chiyoda-ku, Tokyo 101-8448, Japan Phone: 81(3)3219-5641 Fax. 81(3)3219-5710 Cable Add.:SHIMADZU TOKYO
SHIMADZU SCIENTIFIC INSTRUMENTS, INC.
7102 Riverwood Drive, Columbia, Maryland 21046, U.S.A. Phone: 1(410)381-1227 Fax. 1(410)381-1222 Toll Free: 1(800)477-1227
SHIMADZU DEUTSCHLAND GmbH
Albert-Hahn-Strasse 6-10, D-47269 Duisburg, F.R. Germany Phone: 49(203)7687-0 Fax. 49(203)766625
SHIMADZU (ASIA PACIFIC) PTE LTD.
16 Science Park Drive #01-01 Singapore Science Park, Singapore 118227, Republic of Singapore Phone: 65-778 6280 Fax. 65-779 2935
SHIMADZU SCIENTIFIC INSTRUMENTS (OCEANIA) PTY. LTD.
Units F, 10-16 South Street Rydalmere N.S.W. 2116, Australia Phone: 61(2)9684-4200 Fax. 61(2)9684-4055
SHIMADZU DO BRASIL COMERCIO LTDA.
Rua Cenno Sbrighi, 25, Agua Branca, Sao Paulo, CEP 05036-010, BRAZIL Phone: (55)11-3611-1688 Fax. (55)11-3611-2209
SHIMADZU (HONG KONG) LIMITED
Suite 1028 Ocean Center, Harbour City, Tsim Sha Tsui, Kowloon HONG KONG Phone: (852)2375-4979 Fax. (852)2199-7438
Overseas Offices
Istanbul, Beijing, Shanghai, Guangzhou, Shenyang, Chengdu, Moscow