Computer Science Graduate Projects and Theses Department of Computer Science
5-1-2016
CEST: City Event Summarization using Twitter
Deepa Mallela
CITY EVENT SUMMARIZATION USING TWITTER
by Deepa Mallela
A project
submitted in partial fulfillment of the requirements for the degree of Master of Science in Computer Science
Boise State University
DEFENSE COMMITTEE AND FINAL READING APPROVALS
of the project submitted by
Deepa Mallela
Project Title: CEST: City Event Summarization using Twitter Date of Final Oral Examination: 15 April 2016
The following individuals read and discussed the project submitted by student Deepa Mallela, and they evaluated their presentation and response to questions during the final oral examination. They found that the student passed the final oral examination. Maria Soledad Pera, Ph.D. Chair, Supervisory Committee
Amit Jain, Ph.D. Member, Supervisory Committee Marissa Schmidt, M.S. Member, Supervisory Committee
The final reading approval of the project was granted by Maria Soledad Pera, Ph.D., Chair, Supervisory Committee. The project was approved for the Graduate College by John R. Pelton, Ph.D., Dean of the Graduate College.
I would like to thank Dr. Sole Pera for her support, patience, guidance and invaluable knowledge extended to me along my graduate studies. My project would not have been possible without her unending support and mentoring. The help and support she provided to me in this journey have been invaluable to me to attain this goal. I am honored and grateful to my committee members Dr. Amit Jain and Marissa Schmidt who provided time and energy to review this project. I would like to thank my amazing family and friends for the never ending love, care and support given to me over the years and I undoubtedly could not have done this without them.
Twitter, with 288 million active users, has become the most popular platform for continuous real-time discussions. This leads to huge amounts of information related to the real-world, which has attracted researchers from both academia and industry. Event detection on Twitter has gained attention as one of the most popular domains of interest within the research community. Unfortunately, existing event detection methodologies have yet to fully explore Twitter metadata and instead rely solely on identifying events based on prior information or focus on events that belong to specific categories. Given the heavy volume of tweets that discuss events, summarization techniques can be used to create overviews that capture key facts related to events. Unfortunately, these techniques are constrained to analyze only well-structured events.
In this project, we conducted an in-depth study on the usage of Twitter around Points-of-Interest to verify that indeed Twitter data can be used to detect events of a city. Thereafter, we designed and implemented CEST (City Event Summarization using Twitter), a tool that analyzes tweets to identify different types of events occur-ring in a city and generate the corresponding summaries for the detected events. Un-like existing methodologies, we developed CEST to process unstructured documents and take advantage of short hand notations, hashtags, keywords, geographical data, temporal information, and sentiment terms within tweets in-tandem to both detect and generate a brief overview of events without prior knowledge. Furthermore, we
over time to create a qualitative score that captures events’ appeal to attendees.
ABSTRACT . . . vi
LIST OF TABLES . . . x
LIST OF FIGURES . . . xii
LIST OF ABBREVIATIONS . . . xiv
1 Introduction . . . 1
2 Twitter data and Collection process . . . 8
2.1 Twitter API for data collection . . . 8
2.2 Data used in designing CEST . . . 9
3 Twitter usage around PoI . . . 12
3.1 SNS usage at a location . . . 12
3.2 DGP Algorithm . . . 14
3.2.1 Spatial clustering . . . 15
3.2.2 Cluster bounding boxes . . . 16
3.3 Validation of Twitter usage using the DGP algorithm . . . 16
3.4 Further analysis on SNS usage . . . 23
4 Event Detection . . . 28
4.1 Motivation for event detection . . . 28 viii
4.2.1 Determining activity regions . . . 30
4.2.2 Extracting candidate events . . . 30
4.2.3 Filtering candidate events . . . 32
4.2.4 Identifying more tweets related to events . . . 35
4.3 Validation of proposed event detection strategy . . . 36
5 Event Summarization . . . 39
5.1 Motivation for summarizing events . . . 39
5.2 Approach for generating event summaries . . . 41
5.2.1 Entity extraction . . . 42
5.2.2 Title, hashtags, and keywords . . . 42
5.2.3 Location and time . . . 43
5.2.4 Participants . . . 44
5.2.5 User behavior within event . . . 44
5.3 Rating Validation . . . 48
6 Applying CEST on New York . . . 51
6.1 A case study of CEST on U.S. Open . . . 51
7 Conclusions And Future Work . . . 56
7.1 Conclusion . . . 56
7.2 Applications . . . 58
7.3 Future work . . . 60
REFERENCES . . . 62
2.1 Datasets collected using Twitter public streaming API for the design
and development of CEST . . . 9
2.2 Steps for processing Twitter data . . . 11
3.1 Dataset statistics forCities PoIs,Cities Tweets and Cities Flickr. . . 17
3.2 Web sources used for data collection in Cities PoIs . . . 17
3.3 Fraction of tweets of a city that correspond to PoIs . . . 24
3.4 Number of tweets in clusters created using the DGP algorithm in sample cities . . . 26
3.5 Precision of area coverage of PoIs within three sample cities within Twitter and Flickr . . . 26
4.1 Web sources used for collecting real-time events . . . 37
4.2 Details of tweets inreal-time events dataset . . . 38
5.1 Details on words and emoticons in the sentiment dictionary we created for analyzing users’ opinions in tweets . . . 46
5.2 Reviews collected for products from different domains on the Amazon . 48 5.3 Absolute Error computed using our proposed rating generation strat-egy on different domain of the Amazon dataset . . . 49
6.1 Information pertaining toNYC tweets . . . 52
1.1 Twitter statistics, image captured from LinkedIn . . . 2
1.2 Trending real world discussions captured from Twitter on April 1, 2016, along with tweet including mentions and hashtags from April 2, 2016 . . 3
2.1 Sample attributes in a tweet status . . . 10
2.2 Sample status attribute, showcasing the geocoordinates of the current location of a user . . . 10
3.1 Tweets posted around Town Square in NYC on February 23, 2015 . . . . 13
3.2 Overview of Distribution of Geotagged data around PoIs . . . 14
3.3 Tweets posted around New York City on September 26, 2014 . . . 18
3.4 Clusters generated using Spatial Clustering on the tweets from Figure 3.319 3.5 Bounding box drawn for a cluster identified in Figure 3.4 . . . 19
3.6 Sample Points-of-Interest of New York . . . 21
3.7 Sample Points-of-Interest of Chicago . . . 21
3.8 Sample Points-of-Interest of Seattle . . . 22
3.9 PoI coverage across three sample cities in Twitter and Flickr . . . 22
3.10 Example of overlap between a bounding box of a PoI and a cluster bounding box around the PoI in a sample dataset . . . 25
3.11 Example of area of overlap of PoI bounding box with cluster bounding boxes in Bootstrap samples . . . 25
bootstrap samples . . . 27
4.1 CEST’s strategy for event detection discussed based on Twitter data . . 30 4.2 Activity regions detected in NYC on December 2, 2015, using DBSCAN 31 4.3 Frequency of tweets observed at a sample event: baseball game held
between Toronto Blue jays and Boston RedSox on Jun 30,2015 . . . 32 4.4 A non-geotagged tweet that discusses an event . . . 36
5.1 Different processing steps involved in generating event summaries from Twitter data . . . 41
6.1 Event summary for the U.S. Open women finals 2015 created by CEST using NYC Tweets . . . 53
API– Application Programming Interface
CEST – City Event Summarization Tool
DGP – Distribution of Geotagged data around PoIs
PoI – Point-of-Interest
REST– Representational State Transfer
SNS – Social Networking Sites
URL – Universal Resource Locator
Public Tweets – 1% of all Tweets collected using Twitter Streaming API to design CEST
NY Tweets – Tweets posted from New York city using Streaming API
Cities Tweets – Tweets posted from three cities collected to analyze Twitter usage
Cities Flickr – public Flickr photos collected from three cities to analyze Flickr usage
Cities PoIs – Points-of-Interest location of cities collected from multiple web sources
Real-time Events– Tweets of known events used to validate event detection method
CHAPTER 1
INTRODUCTION
Social Networking Sites (SNS) have evolved over the last decade with the increase in availability of internet resources [17]. Progressive use of smart phones and mobile applications for SNS have also played an important role in the spread of SNS. Accord-ing to the 2015 Pew Internet and American Life Project survey [9], about 65% of the adult population in the United States uses SNS, unlike 7% in 2005, which is a tenfold jump in the past decade. SNS, which have become part of the daily routine of many individuals, are platforms for conversations that range from personal to political and local to international issues [58]. The varied nature of these conversations makes SNS act as real-time sensors to actions around the globe [14, 17, 28, 45].
There are several types of SNS, including blogs, microblogs, social networking services, content sharing & discussion sites, and virtual worlds. In general, SNS aim to establish connections among users around the world. However, each of them has a unique approach to achieve this goal: blogs enable users to express their thoughts by writing articles and sharing them on the web, whereas virtual worlds allow users to explore computer-simulated environments within online communities.
One of the most widely-employed SNS are microblogging sites, on which users can share their experiences using short texts [9, 36]. Among popular microblogging sites, such as Pinterest [8], Plurk [5], Tumblr [3], and Yammer [6], Twitter [1] surpasses them
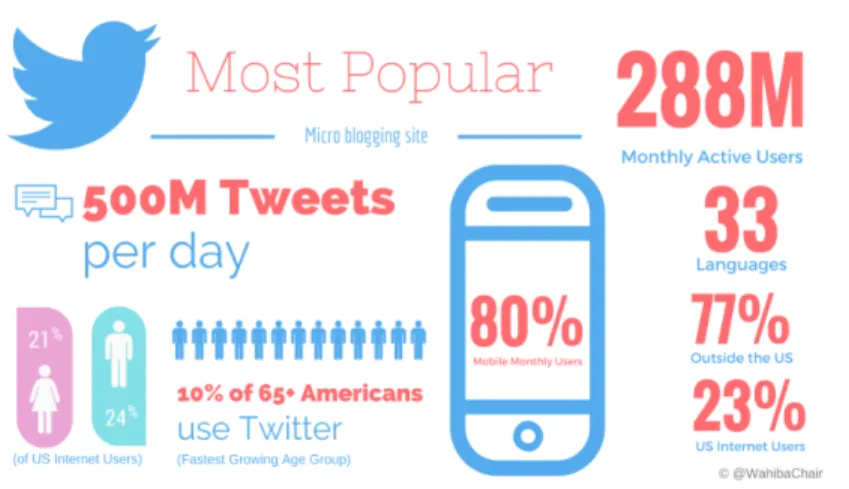
all as the fastest growing microblog in the world (see Figure 1.1, which is captured from Linkedin1, for recent statistics related to the use of Twitter). According to a 2014 report by AAPOR (American Association for Public Opinion Research), about 18% of adults use Twitter in the United States [36], a percentage that increases to 23% worldwide [59]. The number of Twitter users who participate in about 500 million daily interactions, grows at a rate of 135,000 new users per day [11]. These continuous interactions, which are encouraged by mobile applications that allow quick and easy communication among users without impacting their mobility2 [51], lead to
producing enormous amounts of data [20].
Figure 1.1: Twitter statistics, image captured from LinkedIn
Twitter users play the role of producers and consumers, i.e., each user becomes a reporter that not only absorbs and assembles information (e.g. breaking news), but also propagates opinions and stories about themselves or others pertaining to their interests [36]. In addition, users are not constrained on topics discussed, languages used, or number of tweets3 they can post on the site, due to which Twitter users
1
https://www.linkedin.com/pulse/2015-social-media-stats-trends-images-part-1-wahiba-chair-mba
2Mobility refers to users’ ability to post content online even when they are moving. 3A message posted on Twitter is called atweet.
create about 7,041 tweets per second [10], allowing Twitter to serve as a source of timely and fresh information (see Figure 1.2) [58].
Figure 1.2: Trending real world discussions captured from Twitter on April 1, 2016, along with tweet including mentions and hashtags from April 2, 2016
The immediacy of Twitter data, the metadata associated with every tweet (e.g., geolocation, timestamp, user, text, user mentions, and hashtags) and user (e.g., name, profile picture, profile status, home location, followers, and Twitter handle) and the fact that Twitter data is publicly available, have attracted the attention of researchers for the last nine years [35]. This encouraged research on multiple areas of interest, including Twitter community detection using information flow [23, 59]; generation of geographical recommendations based on users’ Twitter activity [51]; identification of localized language diversity [33], and mining of travel patterns based on Twitter usage [17, 59]. Given that users tend to tweet to comment on or share their experiences about events they have attended [48], a vast number of tweets refer to events [44]. Consequently, event detection is the area of study that has gained the most interest among works that exploit Twitter data [14, 31, 45, 48].
An event can refer to any activity that happens within a time interval, especially one that receives attention from people. Some examples of events include fire ac-cidents, earth quakes, concerts and conferences. Identifying events that are being
discussed on Twitter provides a means to acquire knowledge about incidents that are taking place across the world. While news channels, internet sources and magazines may be considered to gather information about events occurring on a daily basis, none of these mediums provide a complete list of events that occur. On the other hand, Twitter is a platform where almost all events are discussed more often, which makes it a more effective source to get information about all categories of events [45, 48]. A category or type of event represents the motive behind the event occurrence, e.g.,
political versus sports events. Different types of events are associated with different activities, e.g., adebate can occur within a political campaign, whereas agoal happens in a soccer game. Unfortunately, most of the techniques developed for event detection from Twitter data have focused on identifying a specific category of events, and thus are not applicable to detect all types of events.
Detection of various types of events taking place at different cities or regions provides a medium for people to learn about their surroundings and create situational awareness [45, 48], i.e., “the perception of the elements in the environment within a volume of time and space, the comprehension of their meaning, and the projection of their status in the near future” [48]. However, event detection techniques that explore Twitter data rely on prior knowledge, in terms of specific locations where events can take place or vocabulary (hashtags and words that are to be part of event discussions4) that can describe specific events.
In addition to detecting events, there is an interest within the research community to generate brief descriptions of the identified events that convey important aspects of the event [36, 50]. However, techniques that explore event summarization using
4According to Li et.al. [32], sample keywords such as fire, accident, and earthquake can be
Twitter data depend on prior information about the events or are only able to analyze structure rich events [16, 50].
To address the limitations of existing event detection and summarization tech-niques, we developed CEST-City Event Summarization using Twitter, a tool that detects and summarizes the events5 that occurred within a city or region based
on Twitter data collected from that location over a period of time. Twitter is a place where individuals discuss their opinions and reactions about events, which is why Twitter is an ideal platform to learn about peoples’ reaction to events without imposing any conscious burden on the users. In building CEST, we introduce novel approaches for identifying different categories of events that are discussed on Twitter without prior information about them and create qualitative descriptions of events based on text and varying users’ sentiments along lifetimes of events. To the best of our knowledge, this is the first work that focuses on summarizing events based on tweets posted across a city without manual intervention.
Designing and developing CEST involves three major milestones:
1. Studying Twitter usage around Points-of-Interest6 (PoIs), by observing the spatial distribution of tweets within a city. We do so to understand how likely the citizens of a city are to use Twitter to share their experiences when they visit or come across an attraction or an exciting moment. As PoIs are the obvious places where people may visit very often, we develop a novel technique that identifies the coverage of activities of a city by analyzing the usage of Twitter around these locations.
5In this report, we refer to events that are geographically bounded, i.e., events that happened at
particular locations.
6Points-of-Interest are locations or places that people may often find useful or interesting, such
2. Detecting events based on spatio-temporal characteristics of the tweets. In accomplishing this task, we created anevent detection technique that identifies different events that occur in an area or city we monitor, irrespective of their categories, which other research works exploring event detection have failed to address [42, 48]. In general, events consist of common characteristics, such as location, duration, and keywords, which describe each event [40, 42]. We utilize these features inferred from text and metadata of Twitter data for our detection process, which makes it generic, i.e., applicable to any data source that possesses these characteristics.
3. Creating a profile of an event based on tweets that are related to the event. In doing so, we develop an event summarization technique that generates a brief overview that captures details related to events, such as title, time, location, and topics discussed. In addition, we provide a rating for each event by analyzing the variation of users’ sentiments expressed on Twitter across the timeline of the event.
The remainder of this document is organized as follows: In Chapter 2, we provide a brief description on the dataset collected from Twitter. We also discuss the different techniques used in the data collection process and introduce datasets created to aid the design and development of CEST. In Chapters 3, 4 and 5, we discuss each of the major milestones associated with this project, i.e., study Twitter usage around PoIs, event detection, and event summarization. In each of these chapters we present the motive and importance behind each proposed milestone for CEST. Along the way, we discuss previous works that have been proposed to examine Twitter data that played an important role in designing CEST. We also highlight our findings and the accuracy
of our proposed methodologies. In Chapter 6, we present a case study of CEST on Twitter data collected from New York city over a 24-hour time interval. Lastly, in Chapter 7, we conclude our report, discuss the application areas where our system may be useful, and suggest directions for future work.
CHAPTER 2
TWITTER DATA AND COLLECTION PROCESS
In this chapter, we discuss Twitter data used in designing, developing, and evaluating CEST.
2.1
Twitter API for data collection
Twitter offers two publicly accessible developer APIs: a REST interface and a Stream-ing API [54, 55]. The REST API offers a list of HTTP endpoints for application developers to interact with Twitter. To prevent abuse, all endpoints are strictly rate limited on a per-user basis allowing authenticated applications to operate as proxies for users, which makes data collection prohibitively slow. While the REST API pulls a tweet for every request, a Streaming API pushes a new tweet to an end user at regular intervals of time. To avoid rate-limits we used the Streaming API for Twitter data collection. This API enables application users to collect tweets in two different ways: with and without filter parameters. Without parameter values, it collects a 1% random sample of all tweets posted online. With parameters, it only draws from tweets that meet the specified criteria, not changing the sample size (i.e., 1% of all tweets that match the criteria) but allowing the retrieval of more focused data. The filter parameters that can be used on the API are “users”, “location bounding box”
users, generated at a given location, or that contain specific keywords, respectively. In the design and development of CEST, we collected data using the streaming API with and without applying filter parameters.
2.2
Data used in designing CEST
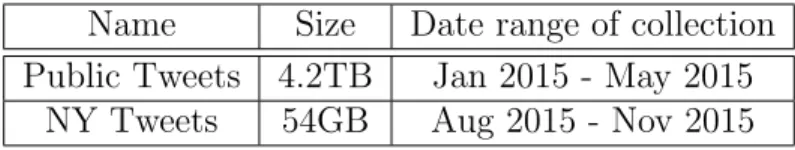
For the design of CEST, we collected tweets during a 5-month period, with no filter parameter values from public streaming API, and created thePublic Tweets dataset. Analyzing this dataset helped to understand how the Twitter API collects data among public tweets and how users tweets vary in different cities. In addition to the Public Tweets, we also collected tweets by setting a “location bounding box” filter parameter to the geographical coordinates of ‘New York’ over a 4-month period to create theNY Tweets dataset. Both datasets are very large, which can present scalability challenges for data processing. Consequently, to clean and process the data using distributed processes we stored these datasets on Hadoop. Further details on Public Tweets and
NY Tweets datasets are shown in Table 2.1.
Name Size Date range of collection Public Tweets 4.2TB Jan 2015 - May 2015
NY Tweets 54GB Aug 2015 - Nov 2015
Table 2.1: Datasets collected using Twitter public streaming API for the design and development of CEST
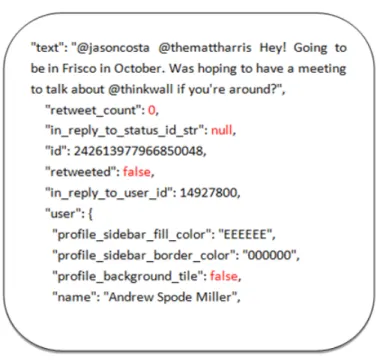
A data unit collected from Twitter, which is a tweet combined with other metadata attributes, is called a status. Each status (see a sample in Figure 2.1) is in JSON format and consists of an average of 40 different attributes, some of them are optional. These attributes hold information related to users and locations. For instance, for a user Twitter captures first and last names, twitter handle, profile picture, time of
account creation, home location, current geolocation (see a sample in Figure 2.2),
timestamp and profile URL, whereas for a place (i.e., location) it gathers details such as country, country-code, full-name of place and place-type. While these attributes can be analyzed to learn facts related to users’ personal information and locations, the text attribute can be examined for capturing users’ opinions.
Figure 2.1: Sample attributes in a tweet status
Figure 2.2: Sample status attribute, showcasing the geocoordinates of the current location of a user
The text attribute of each status (the actual text message composed by a Twitter user) is limited to 140 characters. This size constraint has led to new ways of expressing thoughts using shorter texts and relying on different vocabulary, such as hashtags, user mentions and short URLs. Each of these notions in a tweet has a special meaning and purpose. A hashtag represents a topic or issue a user is talking about, whereas a user mention represents other users being referred to in a tweet and short URLs’ are links to any web source that the user is talking about.
In the process of designing and developing CEST, we depend upon a subset of status attributes. For that purpose we cleaned and extracted only the required attributes of each tweet in the aforementioned datasets. As shown in Table 2.1, the datasets collected from Twitter are large and hence are stored on Hadoop. Given that data collected from Twitter contains tweets composed using different languages, additional metadata and attributes which are not utilized in building, we clean and filter out the unwanted information using a MapReduce program, which follows the steps illustrated in Table 2.2.
Filter Action
Language Filter Remove non-english tweets
Deletion Notices Remove tweets that have deletion notices7
Attributes Extraction Extract required attributes from status:
geolocation, timestamp, userId, tweetId and text
Lowercase Convert tweets text to lowercase URLs Removal Remove URLs in the tweet text
Table 2.2: Steps for processing Twitter data
7Twitter API honors deleted messages (i.e., tweets that are posted and deleted later) while
CHAPTER 3
TWITTER USAGE AROUND POI
In this chapter we discuss the motive behind the study of Twitter usage around Points-of-Interest (PoIs). We present the design and development of a domain independent mechanism to measure Social Networking Sites (SNS) usage around PoIs, along with the experiments conducted to verify SNS usage around PoIs based on the proposed algorithm.
3.1
SNS usage at a location
As Web 2.0/3.0 and pervasive computing have matured, SNS have become a main communication tool to instantly exchange and share information and ideas [30]. Users usually express their experiences on social media when they come across an unusual or exciting activity, such as events. Events tend to be associated with physical locations. Given that PoIs are locations that attract people, it is not uncommon for PoIs to correspond to venues where events take place. However, there is not known correlation between SNS usage at events and PoIs.
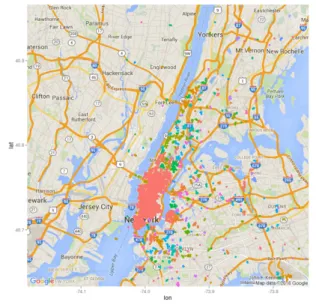
SNS capture information about users’ physical locations when they post content online using GPS enabled devices. This geolocation information collected over a pe-riod of time can be used to examine usage variation of SNS around PoIs. For example, Figure 3.1 depicts tweets posted from New York, which are highly congregated around
Town Square. Few research works have focused on revealing SNS usage patterns around PoIs. The study in [30] verifies that users tend to post pictures around PoIs, and their posting patterns change based on time of the day and season of the year. Similarly, the authors in [56] have focused on learning about users’ interests towards PoIs based on their SNS activity around PoIs. Researchers in [59] explored SNS data to analyze users’ travel patterns at the level of local tourist destinations. Existing techniques that analyze the usage of SNS around PoIs [30, 51] consider geotagged data generated on Flickr [4], FourSquare [7], and Whrrl [2]. However, to the best our knowledge, no work has studied or verified the usage of Twitter around PoIs.
Figure 3.1: Tweets posted around Town Square in NYC on February 23, 2015
In CEST, we focus on identifying events that occurred in a city, which is why we study Twitter usage around different PoIs of cities to understand if Twitter is the right medium or if it possesses the necessary characteristics, such as spatial distribution of tweets at a location, to identify events. Unfortunately, there is no generic strategy
that can be applied on SNS to examine their usage around PoIs. Consequently, we developed DGP (Distribution of Geotagged data around PoIs), an algorithm that detects SNS activity across PoIs based on geographical data points that capture the check-in locations of users. This algorithm does not rely on a specific SNS information, so it can be used to analyze any SNS data, including Twitter data, to identify its usage around PoIs.
3.2
DGP Algorithm
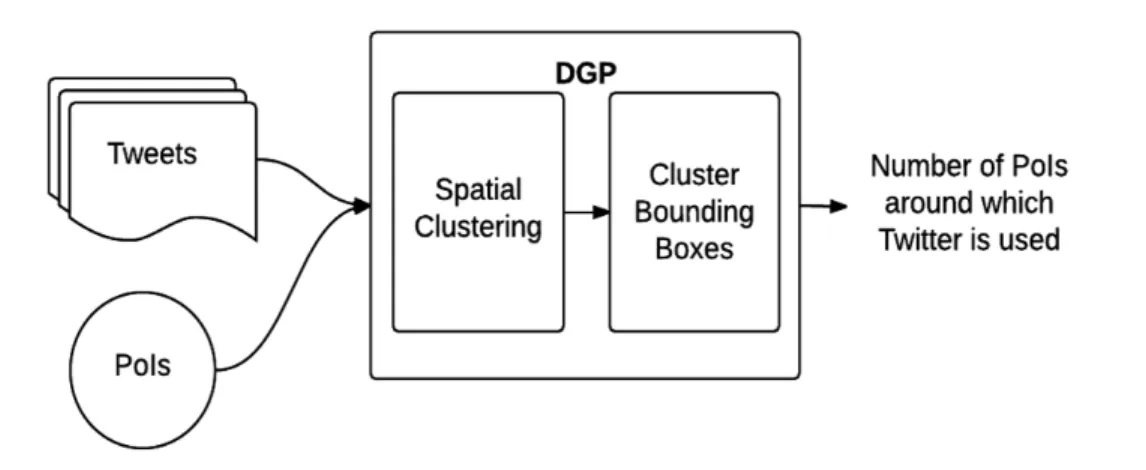
DGP algorithm (see pseudocode in Algorithm 1) considers two data sources: Geo-tagged Dataset collected from SNS, i.e., user check-in information, and a set of data points that refer to PoI locations of a city (PoI Dataset) around which we want to determine SNS usage. As shown in Figure 3.2, DGP algorithm has two main steps,
spatial clustering and cluster bounding box, which are discussed in details below.
Algorithm 1 DGP - Distribution of Geotagged data around PoIs
input : Geotagged Dataset - GD , PoI Dataset - PD
clusters = DBScan(GD)
clusterboundingboxes = null
for cluster in clusters do
clusterboundingbox = Draw Bounding Box with extreme points in cluster
add clusterboundingbox to clusterboundingboxes
end for
for PoI in PD do
for clusterboundingbox in clusterboundingboxes do if PoIcoordinates is within clusterboundingboxthen
PoI is detected
end if end for end for
3.2.1 Spatial clustering
To find the places where multiple users checked-in within a region, we group geo-cordinates in Geotagged Dataset based on their physical proximity. For cluster-ing geotagged data to capture regions of prominent SNS usage, we use DBSCAN (Density-based spatial clustering of applications with noise) [46], which is a popular density-based clustering approach [30]. DBSCAN searches for areas of high density with two parameters that represents areas of given neighborhood (Eps) containing at least a minimum number of points (MinPts). Location points which satisfyEps and
MinPts parameters are grouped together as a cluster.
By using this clustering algorithm, we identify densely-distributed locations, each of which represents a cluster. Data points in Geotagged Dataset that are sparsely distributed and thus not included in any of the generated clusters are no longer considered by the DGP algorithm.
3.2.2 Cluster bounding boxes
We further examine the clusters generated in Section 3.2.1 to identify those that include tweets posted in the proximity of PoIs. Given that each cluster is a collection of geographical points, there is a chance that more than one cluster can be created around a PoI. To identify such situations and determine the region to which the PoI belongs, i.e., to identify a region where the cluster data points are spread, we draw bounding boxes around each cluster using extreme geographical coordinates of geotagged data within that cluster. Acluster bounding box defines the area of a region that covers the spread of data points of a cluster.
After the cluster bounding boxes are drawn, each PoI in PoI Dataset is examined to see if it lies within any of those generated cluster bounding boxes. SNS usage is said to be observed around a PoI if its geographic coordinates lie within at least one of the cluster bounding boxes created within geotagged data.
3.3
Validation of Twitter usage using the DGP algorithm
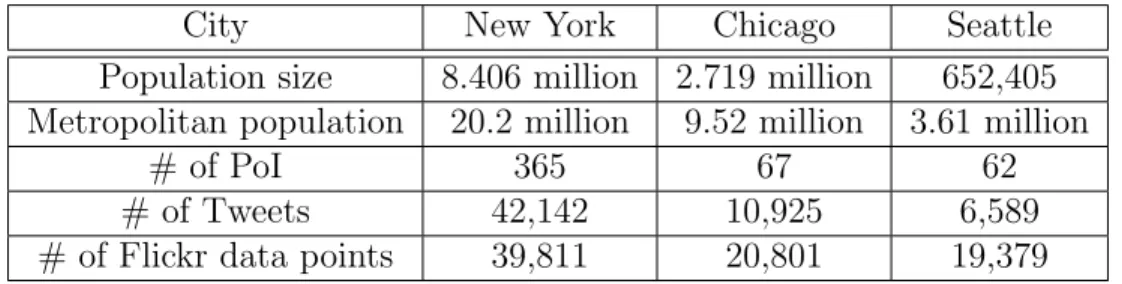
To verify the usage of Twitter around PoIs, we consider two data sources, which are used as inputs to the DGP algorithm: Cities Tweets and Cities PoIs. Cities Tweets includes a set of tweets collected on September 26, 2014 using Twitter public streaming API from three cities: New York, Chicago and Seattle, by extracting the tweets that lies within the geographical coordinates of cities. We selected these sample cities based on their variation in population size. The number of tweets collected from each city, as well as their respective population size, are shown in Table 3.1.Cities PoIs includes data points that correspond to PoIs of the sample cities. Each of these data points consists of attributes about the corresponding PoI: name,
City New York Chicago Seattle Population size 8.406 million 2.719 million 652,405 Metropolitan population 20.2 million 9.52 million 3.61 million
# of PoI 365 67 62
# of Tweets 42,142 10,925 6,589
# of Flickr data points 39,811 20,801 19,379 Table 3.1: Dataset statistics for Cities PoIs, Cities Tweets and Cities Flickr
geolocation (latitude and longitude) and PoI bounding box. As we assume that a PoI is usually spread around an area, we draw a bounding box around a PoI with a radius of 0.35 km8 to represent that area. Each PoI bounding box is represented by
four extreme points: minimum latitude, maximum latitude, minimum longitude, and maximum longitude. To createCities PoIs, we focused on online resources, including tourist and city development websites which archive information about places around a city to provide a site map of a city to visitors. We examined details from many sources and collected data from websites which were given the highest page rank by Google and were retrieved in response to the following keyword query “[city] points of interests”. Details on the number of PoIs collected from each city are displayed in Table 3.1, whereas web sources from which we collected PoIs information for three cities for our experiments are shown in Table 3.2.
City Web Sources
New York http://en.wikipedia.org/wiki/List_of_National_Historic_Landmarks_in_New_York_City http://en.wikipedia.org/wiki/List_of_National_Historic_Landmarks_in_New_York_City https://www.vacationsmadeeasy.com/NewYorkNY/pointsOfInterest/ Chicago http://www.vacationsmadeeasy.com/ChicagoIL/pointsOfInterest/ https://www.newyorkpass.com/En/new-york-attractions/ Seattle http://www.seattle.gov/visiting-seattle/points-of-interest http://www.visitseattle.org/press/press-kit/seattles-major-attractions/ Table 3.2: Web sources used for data collection inCities PoIs
8We picked a radius=0.35km to cover the possible region of a biggest PoI location in the dataset,
i.e., average area occupied by a sport stadium. This is for experimental purpose only, and can be adjusted, if needed.
After the input datasets for the DGP algorithm were created, we tuned the parameters for DBSCAN, which are used forspatial clustering in the DGP algorithm. To select values for parameters, we conducted an empirical study across multiple tweet samples of different cities and selected the parameter values that enable to cluster maximum number of data points from sampled collections. Based on the results generated by clustering geotagged data using different parameter values, we observed that Eps=0.002 and MinPts=5 yielded suitable clusters for the data points distributed across different cities. The maps shown in Figures 3.3, 3.4 and 3.5 provide a visual representation of input data points, clusters, and bounding boxes generated using the DGP algorithm on a sample of tweets (extracted on September 26, 2014) from New York.
Figure 3.3: Tweets posted around New York City on September 26, 2014
To quantify the usage of SNS around PoIs based on the analysis of the DGP algorithm, we use the PoI coverage measure (presented in Equation 3.1), which computes the proportion of PoIs detected across a city with respect to the number
Figure 3.4: Clusters generated using Spatial Clustering on the tweets from Figure 3.3
Figure 3.5: Bounding box drawn for a cluster identified in Figure 3.4
of known PoIs in the city. We consider Cities PoIs as our PoI gold standard, as this represent the original PoI locations of cities.
P oI coverage =|GD|/|P D| (3.1)
Cities Tweets) using the DGP algorithm and |PD| denotes the number of PoIs in
gold standard, which is Cities PoIs in our case.
As shown in Figure 3.9, based on the PoI coverage values computed using the DGP algorithm, Cities Tweets, and Cities PoIs, we see that in New York city there is more than 73% coverage of PoIs. This demonstrates that the DGP algorithm was able to identify Twitter usage around three-quarters of the PoIs of New York city. Twitter usage was also spotted around 45% and 68% of the PoIs in Chicago and Seattle, respectively, which is lower than what was identified in New York. However, examiningCities PoIs, we noticed that PoIs in New York city were centralized within few locations (as shown in Figure 3.6). Because of this centralization there is likeliness of finding more tweets in that area. This enables our DGP algorithm to find more than one PoI in a single cluster. On the contrary, PoIs in Chicago and Seattle were observed to be located far apart from each other (as illustrated in Figure 3.7 and Figure 3.8, respectively), such that fewer check-ins are observed around PoIs of these cities, than New York city. Given that there are fewer tweets (i.e., MinPts) available from Chicago and Seattle, clusters around PoIs in these cities were not created using DBSCAN, which in turn causes these PoIs undetectable by the DGP algorithm.
To give context to our Twitter usage around PoIs results, we replicated our study using Flickr9 data. We chose Flickr for comparison purposes because other works
have already demonstrated that Flickr is generally used around PoIs [24, 30, 59]. To conduct this study, we created Cities Flickr by collecting Flickr data on the same day September 26, 2014 for New York, Chicago, and Seattle using Flickr REST API. Unlike Twitter, Flickr allows users to restrict sharing their photos publicly. Hence, we have collected only public photos of Flickr. Details on the number of data points
Figure 3.6: Sample Points-of-Interest of New York
Figure 3.7: Sample Points-of-Interest of Chicago
inCities Flickr are presented in Table 3.1.
As shown in Figure 3.9, based on the results obtained in terms of PoI coverage
from applying the DGP algorithm toCities Flickr, Flickr was used around more than 60% of the PoIs across all three cities. Even though New York has higher population than Chicago, Flickr usage around PoIs of Chicago is higher than New York. We have noticed that in Cities PoIs, Chicago has a higher percentage of scenic locations
Figure 3.8: Sample Points-of-Interest of Seattle
and amusement parks than New York, which we believe, can be a factor that can influence the results of PoI coverage in Chicago.
From thePoI coverage illustrated in Figure 3.9 for Twitter and Flickr, we perceive that Flickr usage around PoIs is higher than Twitter. However, the manner in which Twitter and Flickr samples were collected may play an important role that can have an effect on the computed results of PoI coverage. Some of the differences in Cities Tweets andCities Flickr are the volume of data points collected across three sample cities, rate limits of API’s in collecting the data, and percent of geotagging across different SNS (i.e., 2% of the data from Twitter is geotagged whereas 4% of Flickr data is geotagged).
3.4
Further analysis on SNS usage
The DGP algorithm measures SNS usage around PoIs under the assumption that a PoI refers to a single geocoordinate. Therefore, it identifies a SNS usage around a PoI if the PoI geocordinate appears in the SNS geotagged data collected for a particular period of time. However, a PoI is a physical location that corresponds to a region rather than a single geocoordinate, and thus a single point may not represent the entirety of the corresponding location. For instance, a baseball stadium is a PoI which is built in an area that includes a field of 14,864m2 and seating arrangements for the audience, which illustrates that a single geocordinate does not represent the whole area of the stadium.
The analysis presented in Section 3.3 is based on data collected over a particular period of time. However, SNS data is dynamic in nature (i.e., can change every day). To establish confidence and accuracy on the reported results, we conducted further
experiments using Cities Tweets and Cities Flickr. To simulate the dynamic nature of SNS data we used a random sampling Bootstrap technique [21]. In statistics, bootstrapping can refer to any test or metric that relies on random sampling with replacement. Bootstrapping allows assigning measures of accuracy (defined in terms of bias, variance, confidence intervals, prediction error or some other such measures) to sample estimates.
From results of the DGP algorithm we observed that not all the tweets from a city correspond to PoIs (see Table 3.3). To understand SNS usage across the area of a PoI and establish accuracy of PoI coverage results obtained, we examined the relevant average area covered by SNS around a PoI across different samples. To do that we use the metric precision (in Equation 3.2), that computes the overlap ofPoI bounding box inCities PoIs, with that of thecluster bounding boxes where a PoI was detected in bootstrap samples. Figure 3.10 shows a scenario of area overlap between a cluster bounding box of a PoI, whereas Figure 3.11 illustrates examples of possible areas of overlaps between cluster bounding boxes (blue) and the PoI bounding box (red) in BootStrap samples.
City New York Chicago Seattle Total tweets 42,142 10,925 6,589 # of tweets correspond to PoI 3,354 2,503 3,202 Table 3.3: Fraction of tweets of a city that correspond to PoIs
precision =
n
X
i=1
(xi/yi)/n (3.2)
wherePoIi is the ith PoI in Cities PoIs, yi denotes the area of original bounding box of PoIiinCities PoIs, xi denotes the proportion of area of overlap between the region
Figure 3.10: Example of overlap between a bounding box of a PoI and a cluster bounding box around the PoI in a sample dataset
Figure 3.11: Example of area of overlap of PoI bounding box with cluster bounding boxes in Bootstrap samples
of a cluster bounding box in a sample and yi, and n denotes the number of PoIs in
Cities PoIs.
The precision scores computed across the clusters of samples of the three different cities within Cities Flickr and Cities Tweets are shown in Table 3.5. These values indicate that SNS data does not cover the whole area around a PoI, i.e., users are not posting on Twitter and Flickr from every single geographical coordinate around a PoI. As shown in Table 3.4, clusters generated around PoIs vary in sizes, i.e., in terms of number tweets that are assigned to each cluster, which further illustrates that the distribution of tweets around PoIs of three cities is different. Hence, the DGP algorithm discovers the presence of a PoI location in geotagged data but this
does not demonstrate specific details on the area around a PoI where SNS is used. City Average tweets in clusters Maximum tweets in clusters
New York 17.80 7,675
Chicago 11.40 1,260
Seattle 30.74 2,645
Table 3.4: Number of tweets in clusters created using the DGP algorithm in sample cities
City New York Chicago Seattle Twitter 0.326 0.188 0.477
Flickr 0.843 0.689 0.786
Table 3.5: Precision of area coverage of PoIs within three sample cities within Twitter and Flickr
As mentioned earlier, data generated on SNS is dynamic in nature and SNS usage around PoIs identified by the DGP algorithm can change among different datasets. To check the bias of computedPoI coverage based on the variations in data generation, we conducted another experiment using Twitter and Flickr data and measured the recall across BootStrap samples. Recall (as defined in Equation 3.3) is calculated based on the number of PoIs observed in a BootStrap sample compared to the number of PoIs observed in the original dataset.
recall =|BS|/|OD| (3.3)
where|OD|denotes the number of PoIs observed in a dataset (i.e., eitherCities Flickr
andCities Tweets, in our case) and|BS|denotes number of PoIs observed in a random sample, i.e., a BootStrap sample.
Recall standard error bar limits (which are plotted in Figure 3.12) are calculated using σ ± s, where the mean of recall is denoted by σ and standard deviation is
Figure 3.12: Recall of PoI coverage across Twitter and Flickr across 100 different bootstrap samples
denoted by s. Recall values and the error bars calculated across random samples demonstrates that PoI coverage computed by applying the DGP algorithm changes based on data generated on SNS.
From the results observed on SNS usage using the DGP algorithm based on PoI coverage, precision on the area of coverage around PoIs, and recall on SNS usage across varied samples, we see that even though Twitter is not being used at every single geocoordinate (i.e., around the whole area) of a region around a PoI, people are being active within those regions. This demonstrates that Twitter is used around places of activities and that Twitter data can be used to detect events.
CHAPTER 4
EVENT DETECTION
In this chapter we describe the design and development of our event detection method and discuss the experiments conducted using Twitter to validate its applicability.
4.1
Motivation for event detection
In Chapter 3, we applied the DGP Algorithm on Twitter data and verified that Twitter is being used around PoIs, i.e., people tend to tweet to share information and their thoughts while they are at diverse locations. Unfortunately, not every event happens at a predefined location or PoI, which is why recognizing events within a region over a period of time is not a trivial task. The real-time nature of Twitter, the rich attributes associated with its data, and the fact that tweets capture diverse perspectives from users across a region, make Twitter an ideal source to explore in order detect events10. Many research works have focused on detecting events by analyzing the patterns of data generation on Twitter [31, 42, 45, 48]. However, the proposed strategies often detect specific categories of events, for example, earthquakes and disaster related events [45], small-scale incidents, as fire and road accidents [48], and events associated with celebrities [42]. To the best of our knowledge, no technique
10Recall that events refer to unusual activities that occur at diverse locations and receive attention
has been developed for simultaneously detecting all types of events, which is needed to capture events across a city.
4.2
Approach for detecting events
For event detection, we designed and developed a technique that considers spatial, temporal, and textual features observed across all events from Twitter data. Our method strategy (depicted in Figure 4.1) tweets collected from a given city over a period of time to identify events regardless of their category. We refer to the Twitter data collected within a 24-hour time interval in a given location as TD. Even though Twitter collects tweets posted from the region specified by bounding box coordinates, it does not capture the specific current location of user unless a tweet is posted from geolocation enabled device. Consequently, not all tweets in TD have geolocation information associated with them, which is why we consider two subsets of TD: TG, which refers to the set of tweets with geolocation that are employed for event detection, and TNG, which are the remaining tweets in TD that are analyzed to capture descriptive details about events.
To detect events of a city, we first determine the regions of a city where Twitter activity is observed using TG. Once these regions are found, we extract the group of tweets at each region that potentially correspond to an event, which we consider as a candidate event. Thereafter, we further filter candidate events to preserve the ones that actually correspond to real life events. Lastly, tweets in TNG are examined to identify further discussions corresponding to events. The different techniques and features used for detecting events from a stream of tweets are described below.
Figure 4.1: CEST’s strategy for event detection discussed based on Twitter data
4.2.1 Determining activity regions
As previously mentioned, CEST’s main goal is to identify events that occur across different geographical locations and thus it is necessary to identify the regions of a city that exhibit Twitter usage, as determined by Twitter users check-in. Given that (i) places where multiple users congregate often represent an event [48], and (ii) metadata of tweets includes spatial information that reflect the physical locations of users [17], we use this information to detect regions of activity where events can potentially occur (see in Figure 4.2). We group tweets in TG based on the physical proximity of their geocoordinates using DBSCAN (as discussed in Section 3.2). Thereafter, tweets in TG that are assigned to clusters are considered for further processing, whereas the remaining tweets are ignored.
4.2.2 Extracting candidate events
Tweets clustered using DBSCAN only reflect the cohesion of tweets in terms of proximity, however, not all the clusters created represent events. Furthermore, not
Figure 4.2: Activity regions detected in NYC on December 2, 2015, using DBSCAN
all the tweets from a single region represent a single event, i.e., multiple events can occur at a single location at different times. Based on the fact that events last for a finite period of time and that users tend to tweet at a higher rate within the event time bounds (see Figure 4.3), it is natural to perform a time analysis on tweet activity observed on clusters generated using DBSCAN (in Section 4.2.1) to identify events. By examining tweets frequency variation over time in each cluster we identify subsets of tweets, if any, that correspond to distinct events. Each cluster data is monitored at regular time intervals to determine if (i) users are active at that region and (ii) a minimum of activity is registered in a cluster. To do that, we separate tweets in a cluster into equal time slots based on their timestamp, and depend upon two different criteria: time chunk and MinPts. Each time chunk represents the shortest duration of time which can be observed for any event and MinPts represents the minimum number of tweets that need to be present in time chunk. We treat time chunk = 15
andMinPts = 5 as the optimal parameter values11based on our analysis on multiple
samples of Twitter data.
Figure 4.3: Frequency of tweets observed at a sample event: baseball game held between Toronto Blue jays and Boston RedSox on Jun 30,2015
Tweets of each cluster from Section 4.2.1 are separated into multiple time slots and each time chunk is examined to verify if it contains a number of tweets greater than or equal to MinPts. If so, tweets of the cluster in the corresponding time slot are said to capture acandidate event. Furthermore, contiguous time slots of a cluster that satisfy both parameters are merged to capture information pertaining to a single
candidate event. Only the subset of tweets in clusters that representcandidate events
are considered for further processing.
4.2.3 Filtering candidate events
Candidate events are generated by analyzing the variation in the frequency of tweets over time. Unfortunately, Twitter users tend to adopt different approaches for posting content at regular intervals time, i.e., manually or through automatic systems. This
11These parameter values can be updated, depending upon the volume of Twitter data analyzed
generates vast numbers of tweets from certain locations or users that can lead our time-based strategy to mistakenly treat a set of tweets as a candidate event, even if they do not discuss event-related information. To further filter out candidate events
that do not represent an event, we define a set of criteria, which we discuss in details below. We also set a threshold for each criteria, based on empirical studies conducted on various samples of Twitter data, to determine if acandidate event is in fact a real event.
Many organizations and institutions employ robotic systems to post content or promotional offers on Twitter. These systems, which are physically stationed at a single location, post content online at regular intervals of time. Consequently, tweets posted by these systems are grouped together by DBSCAN and mistakenly treated as acandidate event. We examine tweets pertaining to eachcandidate eventto determine if more than 30% of tweets that are generated from a single geocoordinate. If so, these tweets are definitely not originated from a human, which means that the corresponding candidate event is not an event and is excluded from further analysis. A person may turn to Twitter to continuously share information about his personal life and post multiple tweets from geocoordinates in close proximity, such as within his house or work location, which causes DBSCAN and posterior time analysis to mistakenly treat these tweets as a candidate event. Another issue related to the number of users posting tweets from close proximity is, when very few users post tweets at a higher rate while others just check-in from a location, these tweets may still correspond to events. To avoid the aforementioned situations, we eliminatecandidate events that contain more than 50% of the tweets posted by a single user.
As previously stated, multiple users participate at events, and thus a single user sharing information on Twitter is a clear indicator that the tweets do not pertain to
events. Hence, we consider another criteria that verifies if a candidate event include tweets generated by a minimum number of distinct users, to consider it as an event. In order to satisfy this scenario, we only retain candidate events that include tweets posted by at least 5 different users.
Twitter users employ different vocabulary in tweets which can assist them to express their thoughts. Content of tweets play an important role in terms of detecting which tweets refer to events. For example, we noticed that at some locations, espe-cially shopping malls, multiple people tend to retweet about the same information, e.g., a promotional offer, which do not really correspond to an event. To determine if tweets solely reproduce the same content, we employ a criteria based on content similarity, which analyzes the variations in the usage of words among tweets that refer to each candidate event. We estimate the degree of similarity between each pair of tweets within a candidate event by comparing words (excluding stop words12)
from each tweet using the Jaccard distance. As defined in [49], the Jaccard index, also known as the Jaccard similarity coefficient, is a statistic used for comparing the similarity and diversity of sample sets. The Jaccard coefficient measures similarity between sample sets, and is defined as the size of the intersection divided by the size of the union of the sample sets. The Jaccard distance, which measures dissimilarity between sample sets (i.e., set of words in a tweet in our case), is complementary to the Jaccard coefficient. A similarity score of 1 indicates exact match, i.e., tweets are reproducing the same content, whereas a low score indicate tweets are dissimilar. As neither extreme case refers to an event, we eliminate candidate events which do not have a content similarity score within the [0.5, 0.8] range to ensure that varied, yet
12Stop words (e.g., from, the and is), do not provide any relevant information regarding the
related, content is used in discussing an event.
Applying the mentioned criteria on the original set of candidate events detected from Section 4.2.2 yields the final set of candidate events that correspond to events.
4.2.4 Identifying more tweets related to events
Our event detection method so far uses only tweets with geolocation information in Twitter data to identify events. Unfortunately, only 2% of tweets obtained from Twitter contain location information [48], which means that a vast majority of tweets may still discuss events, even if they do not contain geolocation information (see an example in Figure 4.4). To take advantage of these tweets, we assign tweets in TNG to the events detected in Section 4.2.3 based on their timestamp and textual content. Given a tweet t in TNG, its timestamp is used to determine if it lies within the time bounds of an event, whereas words in t are examined to verify if there is or not a strong correlation between t and that event.
We first filter the tweets in TNG that do not belong to events by eliminating the ones that do not lie within the time bounds of the detected events from Section 4.2.3. Thereafter, we measure the similarity of words int with respect to the most discussed words at the events (obtained from Section 4.2.3), to identify the event that is most likely discussed in t using Jaccard distance. We tokenize each tweet of that event, extract words, and analyze the frequency distribution of these words (excluding stop words). This allows us to identify the top k13 frequent words as the representative words of the event. t is said to discuss an event if it exhibits the higher similarity score with top k words of that event compared to other events, and timestamp of t
lies within time-bounds of that event.
Figure 4.4: A non-geotagged tweet that discusses an event
4.3
Validation of proposed event detection strategy
To verify the accuracy of our event detection method, we identified 65 sports events that took place in different cities during June 16-23, 2015 from the web sources listed in Table 4.1. Thereafter, we collected tweets related to these events using Twitter Streaming API (by setting up the location parameters to geocoordinates of the venues where events took place) and created a dataset called Real-time Events (for detailed information about the dataset, see Table 4.2). We consider this dataset as our event
gold standard.
Based on the parameters for cluster generation and time analysis defined in Sec-tion 3.3 and SecSec-tion 4.2.2, respectively, we applied our event detecSec-tion methodology to the aforementioned dataset.
Web Sources http://www.nycfc.com/ http://www.soundersfc.com/schedule http://www.chicago-fire.com/schedule http://www.newyorkredbulls.com/schedule http://web.usabaseball.com/schedules.jsp http://newyork.yankees.mlb.com/schedule http://miami.marlins.mlb.com/schedule/ http://cincinnati.reds.mlb.com/schedule/ http://pittsburgh.pirates.mlb.com/schedule http://washington.nationals.mlb.com/schedule http://chicago.whitesox.mlb.com/schedule/?c_id=cws#y=2015&m=6&calendar=DEFAULT http://detroit.tigers.mlb.com/schedule/?c_id=det#y=2015&m=6&calendar=DEFAULT http://seattle.mariners.mlb.com/schedule/index.jsp?c_id=sea#y=2015&calendar=DEFAULT&m=6 http://kansascity.royals.mlb.com/ticketing/singlegame.jsp?c_id=kc http://milwaukee.brewers.mlb.com/schedule/?c_id=mil#y=2015&m=6&calendar=DEFAULT http://minnesota.twins.mlb.com/schedule/?c_id=min#y=2015&m=6&calendar=DEFAULT http://chicago.cubs.mlb.com/schedule/?c_id=chc#y=2015&m=6&calendar=DEFAULT http://losangeles.dodgers.mlb.com/schedule/?c_id=la#y=2015&m=6&calendar=DEFAULT http://sanfrancisco.giants.mlb.com/schedule/?c_id=sf#y=2015&m=6&calendar=DEFAULT http://colorado.rockies.mlb.com/schedule/?c_id=col#y=2015&m=6&calendar=DEFAULT http://houston.astros.mlb.com/schedule/?c_id=hou#y=2015&m=6&calendar=DEFAULT http://losangeles.angels.mlb.com/schedule/index.jsp?c_id=ana#y=2015&m=6&calendar=DEFAULT http://stlouis.cardinals.mlb.com/schedule/?c_id=stl#y=2015&m=6&calendar=DEFAULT http://mlb.mlb.com/mlb/schedule/index.jsp#date=06/19/2015 http://sanfrancisco.giants.mlb.com/schedule/?c_id=sf#y=2015&m=6&calendar=DEFAULT http://mlb.mlb.com/mlb/schedule/index.jsp#date=06/24/2015 http://losangeles.angels.mlb.com/schedule/index.jsp?c_id=ana#y=2015&m=6&calendar=DEFAULT
Table 4.1: Web sources used for collecting real-time events
precision metric, which is defined as the proportion of events detected with respect to the number of events in Real-time Events. Based on the results of our experiments, our event detection methodology yields 0.86 precision, which reflects that 56 out of 65 events are detected by our proposed strategy. With regards to the unidentified events in Real-time Events, we noticed a couple of scenarios in which the criteria defined for filtering candidate events was not met. For some of the events that we failed to identify, we noticed that less than 5 users tweeted at the events at a higher rate to promote the events, which caused the content similarity criteria to not be satisfied. We also observed in other events that users were not active, i.e., users were
# of Events # of Tweets # of Geotagged Tweets # of Non-geotagged Tweets
65 321,538 49,739 271,799
Table 4.2: Details of tweets in real-time events dataset
not tweeting at the rate of 5 tweets for 15 minutes, which is why time chunk and
MinPts were not satisfied while detecting a candidate event and thus the event was discarded.
Using our event detection method we can detect and collect information about events from Twitter data without any prior knowledge about events. We only utilize tweets with geolocation information to detect events. However, there exist non-geotagged tweets that might discuss information related to events, which is why we identify non-geotagged tweets related to those events. These tweets, which dis-cuss different aspects pertaining to events, can be summarized to provide a concise overview of events, which we discuss in Chapter 5.
CHAPTER 5
EVENT SUMMARIZATION
In this chapter we introduce different techniques used in the design and development of our Twitter-based event summarization method. We discuss the details of each technique as well as how they add value towards generating informative summaries of events based on tweets.
5.1
Motivation for summarizing events
In Chapter 4, we presented a technique for event detection that recognizes different types of events within a region and groups tweets based on the event they discuss. While these tweets can be useful to learn information about events, a substantial amount of time and human effort is required to read these tweets and understand the facts and details about each event [53]. A concise summary of these tweets can provide users a better alternative to get a quick overview of an event. In general, summarization is defined as the process of creating a brief statement of the main points of any description [19]. Important goals of a summary are:
1. reduce the work load for the interpreter (simpler), 2. maintain coherence and coverage, and
Similarly, in our project, the basic idea of summarization is to take a body of in-formation (i.e., a set of tweets) and reduce its size and content to its important points. A significant amount of research related to summarizing structured documents, such as blogs and news articles [29, 34, 43] as well as relatively long documents [22] exists but only few works have focused on summarizing tweets, which are short and unstructured. The authors in [16, 27] generate summaries from Twitter data of long running events that share the same underlying structure, such as football games. While the technique presented in [16] summarizes an event by observing bursty tweets within an event timeline, the one introduced in [27] extracts the important moments of an event based on topic and keyword variations within an event lifetime. Even though these works have proven effective, they ignore certain characteristics of events: (i) events can vary in their structure and (ii) the actions associated with different types of events may alter from one type of event to another, e.g., a touch-down in a football game and a keynote speech at a conference. In addition, techniques developed solely for generating summaries for well-structured events of a specific type cannot be applied to generate summaries of other type of events, which is a limitation. Moreover, existing summarization techniques applied on Twitter [16, 27] have focused on creating summaries for known events (i.e., events for which its type, location and duration of the events are available), whereas, in our case, no prior knowledge about events is available. To address the drawbacks of existing event summarization techniques when applied to tweets, we developed a generic event summarization strategy that can be applicable to create a brief overview of any type of event based on Twitter data. To do that, we analyze temporal, spatial and user behavior corresponding to that event.
5.2
Approach for generating event summaries
Our event summarization method examines text and metadata associated with tweets within a collection that discuss an event, denoted ET, to create the corresponding event summary. Among tweets in ET, we pay special attention to the subset of tweets denoted EGT,which contains tweets with geolocation information. While geographical information in EGT is specifically analyzed to determine the location of an event, tweets from ET are examined using different tools and text processing techniques (described below) to extract various facts and details about the event. Thereafter, key information about the event is identified and combined to generate the corresponding event summary. The overall summary generation process is shown in Figure 5.1.
Figure 5.1: Different processing steps involved in generating event summaries from Twitter data
5.2.1 Entity extraction
Named-entity recognition (NER), also known as entity identification, entity chunking, or entity extraction, is a subtask of information extraction that seeks to locate and classify elements in texts into pre-defined categories [37], such as “location”, “person”, “organization” and “misc”. Events consist of a sequence of moments, each of which may refer to actors (e.g. a player in sports event or a politician in a presidential debate ) or objects (e.g. a stadium or a venue where the event took place), which are real-world entities. It is not unexpected then that these entities are discussed by event attendees in their tweets. To identify entities in each tweet in ET, we use the Stanford NER [12], a well known tool for detecting entities. As a large number of entities related to an event can be discussed among tweets in ET, we include in the summary of the event only the most representative ones, i.e., top k14 based on their
frequency distribution, to capture the entities that gained the most attention from people at that event.
5.2.2 Title, hashtags, and keywords
A title of an event provides a quick overview about the main purpose of that event. Tweets in ET do not explicitly provide a title for the event they discuss. However, we can infer that information by examining the content of tweets in ET. Given that Twitter users tend to use hashtags to refer to issues or topics pertaining to an event15, we rely on the most frequently-used hashtags to capture the title of the event. Hashtags have a well known structure, i.e., they are preceded by symbol ’#’
14We set the value of k to 10. In fact we consider k value is maintained to 10 across the chapter.
This value is adjusted mainly because to limit the number of words in generating a concise summary.
15Topics at an event can refer to an any object or action that are part of the event. For example,
in a sports event like football, two teams participate at an event and Twitter users may refer the teams as #team1 and #team2. Each of these hashtags represent a different topic.
before a word. We detect hashtags from tweets in ET using the following regular expression: [#([^#]+)[\s,;]*]. Thereafter, we analyze their frequency distribution and the top 2 hashtags in ET are included as the event title in the corresponding summary. To showcase other discussed topics (besides the ones treated as the title of the event), we also include in the summary for the event, thetop k representative, i.e., most frequent, hashtags.
Keywords in tweets may also provide descriptive opinions about different aspects of an event. To capture highly-mentioned keywords in tweets of an event, we tokenize each tweet’s content for each word and analyze the frequency distribution of words in ET (excluding hashtags and stopwords). Subsequently, to demonstrate the most discussed words at an event, we includetop k representative keywords in the summary.
5.2.3 Location and time
Given that an event is often short lived and associated with a location, we also include in the summary for the event its duration and where it took place. We do so by examining tweets in ET and EGT for time duration and geographical coordinates, respectively. Each tweet in ET contains timestamp information that defines when a user posts content on Twitter, which is why we use the timestamp of the first and last tweet in ET to identify the duration of the event. Furthermore, we examine the geolocation attribute associated with each tweet in EGT, which denotes the location from where the tweets was posted. As mentioned in Section 3.2, event location can not be represented by a point location. Consequently, we identify the bounding box of an event location using the minimum and maximum latitude and longitude in EGT.
5.2.4 Participants
As multiple people share and express their opinions about an event on Twitter, it is also important to capture the number of people who tweeted during the event, since it can reflect the popularity of an event [15]. We rely on theUserId attribute of each tweet in ET, which is a unique identifier for each Twitter user, to capture the number of distinct users who actually tweeted from an event and include that information in the event summary.
5.2.5 User behavior within event
People’s interactions with Twitter and their opinions towards a given event can change across the timeline of the event. Their behavior can convey how they reacted to or liked different moments of an event [38]. We capture these reactions to highlight users’ participation and reactions within each moment of an event. To do that, we analyze the non-stagnant behavior of users by dividing the timeline of the event into 5 minute time-chunks. In other words, tweets in ET are separated into 5 minute time-chunks according to their timestamp and each of these chunks is denoted TCi. Based on this analysis, we include in the corresponding summary of the event two graphs that showcase frequency distribution of tweets and the polarity of users’ opinions across the timeline of an the event. In addition, we include in the summary a rating score that captures the appeal of users at the event.
Burstiness of tweets at any given time during an event indicate an important moment where higher participation of users is observed, compared to other moments in the timeline of the event [16]. To illustrate the variation on the frequency with which people tweet at an event, we analyze the number of tweets in each TCi and