Online and Post-processing of AVL Data in Public Bus Transportation
System
Dejan Ran
č
i
ć
, Bratislav Predi
ć
, Vladan Mihajlovi
ć
Computer Science Department
University of Niš
A. Medvedeva 14
Serbia
{ranca, bpredic, wlada}@elfak.ni.ac.yu http://gislab.elfak.ni.ac.yu
Abstract: - For a number of years vehicle fleet tracking systems are in use in companies operating large number
of vehicles in the field. Proliferation of cheap and compact GPS receivers had the effect that Automatic Vehicle Location (AVL) systems today almost exclusively use satellite based locating systems. This paper presents characteristics of realized system tracking and analyzing city bus transit traffic in the city of Niš. Since the described system also uses GPS for vehicle location, initially, data about vehicles’ locations acquired from AVL subsystem need to be transformed into form that is adequate for further usage in the system, analysis and prediction. Also, city bus transit tracking systems are specific concerning functionalities differing them from other vehicle fleet tracking systems. These specifics include cyclic vehicle routes, the need for specific performance reports etc. This paper specifically deals with vehicle motion prediction with on station arrival time estimation coupled with automatic report generation.
Key-Words: - Automatic Vehicle Location (AVL), Prediction of arrival times, Continuous query processing,
Information services, Intelligent transportation systems (ITS), line matching
1 Introduction
The recent advances of automatic vehicle location (AVL) systems based on global positioning system (GPS) have provided the transit industry and public transport enterprises with tools to monitor and control operations of their vehicles and manage their fleet in an efficient and cost effective way. It has also provided the opportunity to provide customers with reliable, up-to-date information on the transit status through traveler information services (TIS). A major component of such a service is travel time/location information, i.e. the time when a vehicle will reach desired location, or the location where a vehicle will be at specific time. The provision of timely and accurate transit travel time/location information is important because it attracts additional users and increases the satisfaction and convenience of transit users. Such reliable real-time information assists the customer in making their transit and multimodal trip plans and enables them to make better pre-trip and en-route decisions.
The city of Nis has started to deploy AVL system for the public bus transport with aims to monitor and track buses in real-time for the purpose of analysis and management of public bus transportation system, and to provide traveler information services and travel time/location information. At the heart of
such services are methodology, model and techniques to predict transit travel time/location and bus arrival time. These issues represent the focus of this paper.
Some research on this topic has been conducted and presented in the literature, but more research is required and has to be done to further improve reliability and effectiveness of traveler information services. In our work we have developed and applied a model to predict bus motion and bus arrival time using AVL data and historical data on previous bus travel along the same route. Our travel time prediction model includes static bus schedule data and schedule adherence, bus motion and traffic flow histories divided in classes depending on time of the day/week (rush hour, morning, evening, etc.), as well as real-time traffic events such as traffic congestions, jams and bus breakdowns that have influence on bus motion and arrival times.
The test bed represents bus routes running in the city of Nis, Serbia, with AVL data obtained every 15 seconds from each bus and collected at the server. The model and algorithms for prediction of bus motion are based also on vector data for bus lines/routes, bus stops, and road network with segments and junctions. The results of extensive experiments performed on real AVL data shown that the model and algorithms offer acceptable
performance and accuracy in prediction of bus motion and bus arrival times.
Apart from bus arrival time estimation, raw positional data acquired from AVL subsystem is used to visualize busses locations and movement in real-time and to perform daily and monthly analysis of timetable conformance and plan fulfillment. Full history of vehicle trajectories is recorded and can be replayed. Different geospatial analyses are also usually performed on positional data acquired form AVL and, therefore, integration with GIS is natural extension of traditional AVL.
We are currently working on enabling the distribution of traveler information services in many forms. At bus stops and other key locations in the city, estimated arrival time of the next vehicle will be provided on electronic display signs, as well as other public information devices, such as interactive kiosks. Customers with access to the Internet will be able to obtain real-time transit information, get notifications, as well as static and general transit information (e.g., schedule and fare) from a city portal or transit agency’s web site. Customers with a cell phone, a wireless personal digital assistant (PDA), will be able to acquire real-time transit information and get notifications from any part of the city by form of SMS or some other wireless push mechanism [1].
2 Characteristics of Vehicle
Trajectories in City Public Bus
Transport
Prerequisite for starting work on analysis and prediction algorithms is detailed analysis of characteristics of busses trajectories in city public transport. It is necessary to note certain limitations imposed upon vehicles involved in city bus public transport and regularities vehicles’ trajectories show on a day to day basis.
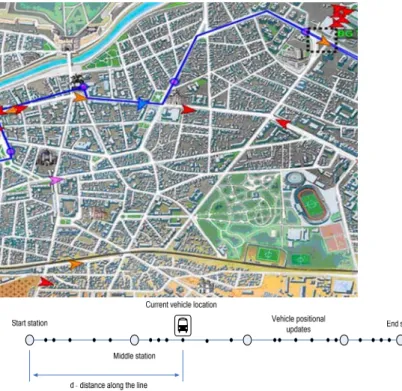
The source of vehicles positional data in the typical public transportation tracking and control system is AVL subsystem. Today, the most efficient and usually implemented location method is satellite based (GPS) [2]. AVL output is an array of points in time and two dimensional space. This form of location data is well suited for vehicle location visualization on the map or analysis whether the vehicle is following the assigned route. The problem of vehicle arrival time prediction is essentially two dimensional (time and one spatial dimension) [3]. For the greater part of the day busses in public transportation system run along predefined routes (lines). Coordinates georefereced in certain
coordinate system streamed from AVL for each vehicle first have to be converted into distance along its assigned line. Also, positional updates are available at regular time intervals that are usually spaced apart with insufficient frequency to completely model real life motion of the vehicle in every aspect. The principle is shown in figure 1. All city bus lines are cyclic in nature and can be categorized as unidirectional and bidirectional. It is not necessary to include both types of the bus lines in the model. Bidirectional bus lines can be generalized as unidirectional with start station and end station that are geographically identical and allowing for some of the middle stations to appear more than once in this “unfolded” line representation since these stations are belonging to both line directions. One extreme is that direction B contains all the stations of direction A in reverse order. The other extreme is that direction B contains completely different set of stations from direction A. That case represents the line that is truly unidirectional. For the problem of bus arrival time prediction for some station on the line only the covered distance along the line is of relevance.
Fig. 1. Problem visualization in 2D/time and 1D/time
Bus arrival time prediction based solely on current motion parameters detected by AVL (speed, direction) is unsuitable for city traffic conditions and can produce only very approximate results [4]. Not only that this estimation would be loosely
approximate but it would be unstable and could change dramatically over short periods of time. The reasons for this efect are city traffic characteristics, rush hours, traffic jams, frequent and irregular stops, frequent and large changes in speed etc. Because of all these reasons conventional arrival time estimation would be precise enough only immediately before the vehicle would arrive and all long term predictions would be too imprecise and unstable. That type of information is of little use to passengers.
Therefore it is necessary to use data streamed from AVL subsystem to record the characteristics of vehicle advancement along the line over time during different (representative) time frames (the whole day, rush hour, weekends, holydays, vacations etc.). The example of recorded data extracted for one line is shown in figure 2. Apart from certain irregularities it is possible to note repeating patterns in distribution of recorded positional data during certain periods of the day. The graph is showing the distance the vehicle has covered along the line in function of time. 11 instances of line runs are shown performed by different vehicles since the runs are overlapping in time.
Fig.2. Covered distance along the line in function of time (11 separate instances performed by different
vehicles)
This information stored as a profile can be used for much more precise estimation of bus arrival time. Recorded characteristics of bus advancement along the line are classified according to the period it was recorded in. Statistical analysis of current bus movement and matching against previously formed profiles allows for much more precise estimation.
More importantly, this estimation should be showing much more stability over longer periods of time. Systems dealing with similar problems exist as either scientific projects or commercial software solutions implemented in various cities.
NextBus [5] is an example of a commercial
system that is in use in several cities in the USA. The system is based on analysis of vehicle position data from the AVL acquired by GPS positioning. Since NextBus is a commercial product more detailed description of the prediction algorithm is not freely available but this project is a good example of how information produced by analysis of busses motion (arrival time prediction) can be distributed to travelers using WEB, WAP, SMS or public information displays installed at bus stops.
MyBus [6] is the result of the scientific project
realized in the laboratory for the intelligent transportation systems at the University of Washington. Busses’ location and velocity data is firstly streamed through Kalman filter [2] and further matched to the geometry of the line the bus is operating on. For the purpose of estimating the time it will take the vehicle to arrive at the station the algorithm divides the complete line route into smaller segments. The segments are small enough that it is reasonable to assume that the vehicle has constant speed on that segment. Final estimated time is calculated as a sum of calculated times per segment [4].
3 Prediction Implementation in
Public Transportation in the city on
Nis
The system being developed for public bus transportation system in the city of Nis is using satellite based (GPS) vehicle location method. Vehicles positions are detected periodically and updates transferred to the server located in the control centre using GSM phone network and GPRS packet data transfer service [7] local mobile phone operators are offering. The devices installed in each bus operating in the public transportation service apart from GPS sensor include GPRS modem, microcontroller synchronizing operation and local memory for storage of positional updates. This memory is used in the case of restricted GPRS network coverage preventing any positional data loss. In this case, real time bus visualization is unavailable, but no data is lost. Component deployment view of the system is shown in figure 3.
Fig. 3. Components of the city bus public transportation tracking system
In the case of the implemented system for each of the operating vehicles the system keeps track of the last 100 stops at the predefined bus stops. Arrival of the vehicle on the bus station is detected if a single positional update for that vehicle is detected inside predefined circular proximity of the station and detected vehicle speed is lower than predefined upper threshold. The reason for such defined condition is the nature of streamed positional data. The more natural and precise condition would be two consecutive detected positional updates within defined proximity of the station with speed 0km/h. Unfortunately, this method would require much more frequent positional updates unnecessarily straining the system and making GPRS costs unacceptably high. We have setup the tracking devices to send updates every 15 seconds. This frequency is low enough to minimize costs but still ensure at least one positional update in the proximity of the bus station with the vehicle speed low enough if the stop occurs. If multiple bus stops fulfill the defined condition (parallel stops on the same line but in different directions) the stop that is closer is selected. The formed array of last 100 detected stops is matched against stop arrays for both directions for the lines that operator is running busses on. The matching problem is somewhat constrained since every bus operator has a known list of lines it is operating on and this matching algorithm for busses belonging to this operator is limited only to lines assigned to this operator. Since GPS positioning system is less reliable and precise in “urban canyons” conditions the matching algorithm allow for up to one station to be skipped during matching [8]. Allowing one station on line to be skipped is in accordance with the practice of some of the
operators to have stations on demand. If no passengers are waiting on that station and no passenger on the bus is getting off at that station the station is skipped. For each line that is matched against maintained array of last 100 stops a probability is given depending on the number and order of matched stops. The line detected with the highest probability is pronounced the current line the bus is operating on. There is also a watchdog feature that designates the bus “in the garage” if no bus station stopping is detected for 30 minutes. When the filter component assigns vehicles to the lines it is possible to proceed with bus station arrival time estimation.
In order to perform bus station arrival time prediction it is necessary to extract instances of line rides [9] from the streamed positional data from AVL. Single instance of line ride consists of all positional updates for a single vehicle received after bus departure from the starting stop to the last stop in direction A and all updates in direction B back to the starting stop. After that, a new ride for that line is initiated. In order to compensate for different traffic conditions during different periods of the day the day period the ride was recorded is assigned to each ride recording. This information is important and used later during arrival estimation in order to assign relevance weight factor to each calculated estimation solution. Naturally, rides recorded in similar periods of the day are more relevant than others [10]. After each instance of the ride is detected and extracted it is stored in an array of rides that is associated with each of the lines. Last 10 rides for each of the lines are always available to be used by the estimation algorithm. This step of the algorithm completes all the data necessary for the estimation.
From here, the estimation algorithm proceeds as follows. For each of the bus stops estimation is performed for (Spr) a list of lines that station belongs
to is extracted. Then, for each of the extracted lines a list of vehicles currently operating on that line is formed. For each of these vehicles it is known what is the last stop (Spz) it has stopped on and when thet
stop occured (tpz). Knowing these two pieces of
information, it is possible to find the bus stop (Spr) in
every one (out of 10) rides associated with that line. The algorithm notes the time (tpr) when the vehicle
which recorded that ride was on the station (Spr) in
question. In all of 10 rides the algorithm also notes the time (tpzv) when the vehicle which recorded the
ride arrived at the station (Spz). After that the arrival
time for that vehicle on the station (Spr) is given as:
) _ ( ) ( pr pzv pz p t t current time t t = − − < >−
Based on the time period of the day the estimation is being calculated and time period each of the rides were recorded in is included in the final estimation with the certain weight factor. As it was previously noted this weight factor is modeling the relevance of the estimation.
The algorithm internals is depicted in figure 4.
Fig. 4. Graphical representation of arrival time prediction algorithm based on one instance of bus
ride along the line
The estimated arrival time is displayed at the information display each of the most frequent bus stops are equipped with. Once estimated arrival times are available in the system, these can be distributed to the passengers (end users) on demand, using SMS or published on the city’s WEB or WAP portal [11].
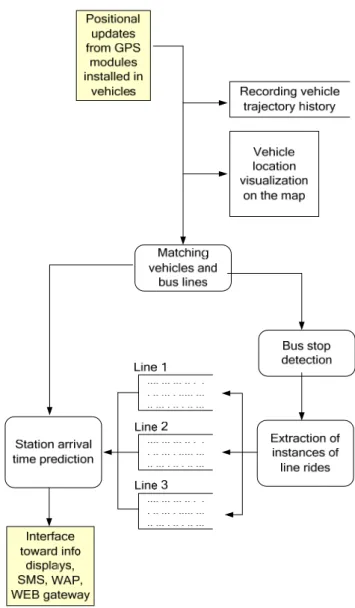
Data flow in the described system for city bus public transportation tracking is shown in figure 5. Data source is AVL subsystem, producing stream of periodical position updates for vehicles. The required transformation of data contained in these updates depends on its further use in the system. For example, before any further transformation, raw positional data is stored in the database for later replay [12]. Also current locations of busses are displayed on the map based on this raw data [13][14]. City public transportation service is more interested in daily and monthly reports than real-time bus tracking. Therefore, in order to produce these reports raw positions have to be transformed, busses assigned to lines they are running on, bus stops have to be detected and instances of line runs extracted. Based on all this post processed data, it is possible to give reports on mileage, bus stop schedule, number of active vehicles etc. This sort of information is important to city service dealing with public transportation system.
Fig. 5. Data flow in AVL system for tracking city bus transit applied to arrival time prediction The information generated by described post processing can also be of interest to passengers. The estimated arrival time of the next bus can be presented on information displays attached to bus stops [15]. More detailed real-time information concerning busses operating on the line passenger is interested in can be accessed by the passenger herself via WAP [16].
4 AVL Data Post-processing –
automated report generation
Another usage of the AVL positional data is automated generation of periodical (monthly) reports. The main need for these reports arose from the model the city authorities are using to manage city public transportation system and numerous bus operators that are engaged in public bus transportation. Namely, city public bus
transportation is not fully commercial service and municipality subsidies are awarded per operator and are based on operator performance. Manual generation of periodical reports is both inaccurate and man/hour intensive. Fully automated report generation based on recorded history of vehicle’s trajectories is quick and unbiased.
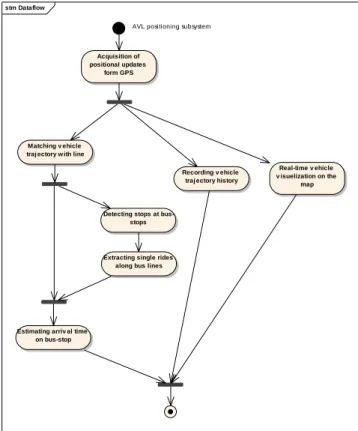
As already said, periodical report generation is based on historical data on vehicles’ trajectories and stops. This data is handled separately in the data flow as shown in figure 6.
stm Dataflow
AVL positioning subsystem
Acquisition of positional updates
form GPS
Matching v ehicle traj ectory w ith line
Detecting stops at bus-stops
Extracting single rides along bus lines
Estimating arriv al time on bus-stop
Recording v ehicle traj ectory history
Real-time v ehicle v isuelization on the
map
Fig. 6. Separate data-flow paths
Post-processing algorithm used for reports generation is somewhat similar to algorithm used for real-time analysis and arrival time prediction but has two distinct differences. Firstly, it needs to be highly precise and it is not functioning in real time. The second difference means that at the moment of execution on the timeline not only the past trajectory of the vehicle is known but also the “future”. This characteristic adds to the precision of the analysis algorithm.
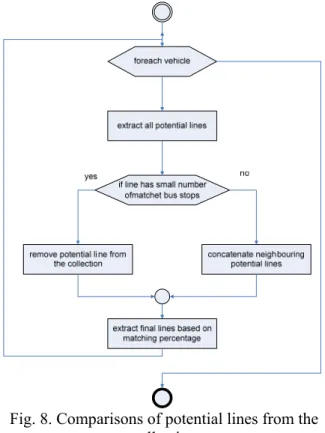
Report generation analysis algorithm relies on detection of vehicle arrival on bus stops performed in real-time analysis. Further analysis can be divided into three steps: extraction of potential lines the vehicle was operating on at that time, filtering of line candidates and final extraction of the line the vehicle was operating on.
First step adds potential lines to the collection based on the bus-stops vehicle was detected on. There are a number of possible cases in this collection buildup. If the stop detected is first for a line then a new line is added to the collection. If the stop is the last stop for any line and that line is available in the collection the line in the collection is closed (ended). If bus stop is neither of the previously mentioned then it is added to the corresponding existing line in the collection. There are a number of exceptions to these rules. Exceptions occur because of the city traffic, irregularities in the bus operation etc. For example, the vehicle can be initially detected at some of the “internal” stations of the line. In this case the line also has to be added to the collection. Furthermore, the vehicle can change the direction without completing all the stops along the line, false stop at the station in the opposite direction can be detected or the vehicle can skip a stop (figure 7).
Fig. 7. Collection of candidate lines
The product of the first phase is the collection of all candidate lines the vehicle was operating on. Second phase calculates quality of line matching for each of the candidate lines and therefore the probability that the vehicle was operating on that line. Matching percentage is ratio of number of detected bus stops and the total number of bus stops on the candidate line.
Verification of the proposed post-processing and report generation algorithm was performed by manual inspection of generated reports and recorded history over a period of 6 months. The reports were generated and manually verified monthly. It was concluded that the precision of the automatically generated reports was never lower than 95% but was higher that 98% for roughly two thirds of the reports. Another important aspect of the algorithm is
the time needed for report generation. In the implemented system tracking roughly 200 vehicles typical report took about 10 minutes to generate. That is acceptable for daily or monthly report generation.
Fig. 8. Comparisons of potential lines from the collection
5 Conclusion
AVL systems are a diverse set of systems with various functionalities dealing with spatiotemporal data acquired from moving objects of point type. Core components of such systems are component tasked with calculating geographical location of the vehicle and component tasked with transferring this information to the control centre using some wireless telecommunication technology. Systems in use today almost exclusively use satellite based positioning (GPS) for determining vehicle position and packet data transfer through cellular network (GPRS, EDGE, UMTS…) to transfer that data to the control centre. This concept proved to be the most reliable end cost effective. City service implementing bus tracking is therefore not required to implement custom sensors for detecting bus stops and independent wireless telecommunication network.
The test case this paper presents is somewhat special in terms of restrictions. In comparison with other similar systems worldwide it does not require any special sensor network (RFIDs or similar) or
highly structured public bus transportation system (bus-line assignment etc.). These restrictions were mainly imposed by local regulations in power in the city of Nis. Also, the manner how public bus transportation is performed by local operators and regulated by city services had no lesser impact on the work presented in this paper.
Preliminary results show that this minimal configuration of sensor and telecommunication network devices is giving sufficient volume of data to allow accurate analysis of bus traffic in public transportation and give accurate predictions of bus arrival times. This information allows planning service to timely notice possible future problems like less than adequate line coverage, vehicle congestion etc. Additional beneficiaries are citizens using public bus transport since always accurate information about dynamics of buses traffic is available to them.
References:
[1] S.D. MacLean, D.J.Dailey, “Real-time Bus Information on Mobile Devices”, Proceedings of IEEE Intelligent Transportation Systems Conference 2001., Oakland, California 2001. [2] Ramjattan, A.N. and P.A. Cross. “A Kalman
Filter Model for An Integrated Land Vehicle Navigation System”. Journal of Navigation, Vol. 48, No. 2, May 1995, pp. 293-302.
[3] Ran Hee Jeong, “The Prediction of Bus Arrival time Using Automatic Vehicle LocationSystems Data”, A Ph.D. Dissertation at Texas A&M University, December 2004. [4] D.J. Dailey, Z.R. Wall, S.D. Maclean and F.W.
Cathey, “An Algorithm and Implementation to Predict the Arrival of Transit Vehicles”, ITSC 2000.
[5] NextBus, http://www.nextbus.com/
[6] MyBus, http://www.mybus.org/
[7] Bratislav Predić, Milan Gocić, Vladan Mihajlović, Dejan Rančić, Slobodanka
Đorđević-Kajan, Aleksandar Kostić, “System for Remote Control and Parameter Reading of Automatic Hydrometeorological Measurement Stations”, YuInfo 2006., Kopaonik, 6-10.3.2006., Proceedings on CD-ROM.
[8] Shalaby, A. and A. Farhan, 2004. “Prediction Model of Bus Arrival and Departure Times Using AVL and APC Data”, Journal of Public Transportation, 7(1): 41-61.
[9] F.W. Cathey and D.J. Dailey, “A Prescription for Transit Arrival/Departure Prediction using AVL Data”, Transportation Research C, Vol. 11C, No. 3-4, June-Aug, pp. 241-264, 2003. [10]Zachary Wall, Electrical Engineering, Univ. of
Arrival Time of Mass Transit Vehicles Using Automatic Vehicle Location Data", M.S.E.E., December 1998.
[11]Repenning, A. and Ioannidou, A. 2006. „Mobility agents: guiding and tracking public transportation users“, In Proceedings of the Working Conference on Advanced Visual interfaces (Venezia, Italy, May 23 - 26, 2006). AVI ‘06. ACM Press, New York, NY, 127-134. [12]Philipp Michel, “Arrival Time Prediction in
BTAPS”, BTAPS project technical guide, http://hal.trinhall.cam.ac.uk/bravo/bravo/public _html/UserManual.html
[13]Petkovic M, Đorđvic-Kajan, Mitrovic D., Stoimenov L., "Application of Informatics in Fleet Management", Proc. of the IASTED Applied Informatics International Conference 1998, Garmisch-Partenkirchen, Germany, pp. 195-198.
[14]Petkovic M., Đorđevic-Kajan S., Mitrovic D., Rancic D., "Maps in vehicle navigation systems", 18th ICA/ACI International Cartographic Conference ICC 97, Stockholm, Swedish, 2327 June 1997, Proceedings -Volume 1, pp.586-593.
[15] Katrin Dziekan, Karl Kottenhoff, “Dynamic at-stop real-time information displays for public transport : effects on customers”, Transportation Research Part A: Policy and Practice, Volume 41, Issue 6, July 2007, Pages 489-501
[16] S.D. Maclean and D.J. Dailey, “The Use of Wireless Internet Service to Access Real-Time Transit Information”. Proceedings of the 9th Annual World Congress on Intelligent Transport Systems, Chicago, Illinois, 14-18 November 2002.