i
The Transition to Hub-Based Gas Pricing in
Continental Europe
Jonathan Stern and Howard Rogers
NG 49
March 2011
ii
The contents of this paper are the authors’ sole responsibility. They do not necessarily represent the views of the Oxford Institute for Energy Studies or any of its members.
Copyright © 2011
Oxford Institute for Energy Studies
(Registered Charity, No. 286084)
This publication may be reproduced in part for educational or non-profit purposes without special permission from the copyright holder, provided acknowledgment of the source is
made. No use of this publication may be made for resale or for any other commercial purpose whatsoever without prior permission in writing from the Oxford Institute for Energy
Studies.
ISBN
iii
Table of Contents
Acknowledgements ... 1
Introduction: the basic argument and its dissenters ... 2
The many factors bearing on European gas prices: 2008-11 ... 3
Is an alternative index to oil products possible? ... 5
Market based gas prices: confusion between price formation and price level ... 6
Gas Market developments during 2009-10 ... 7
Market-based prices and anticipated supply and demand trends in the 2010s ... 9
Hub-based pricing: progress and problems ... 11
Fears of manipulation ... 13
Concerns about volatility ... 15
Can there be a single gas price across Europe? ... 16
Pricing in new greenfield gas projects: Shah Deniz and the Southern Corridor as a test case ... 17
The transformation of the commercial structure and culture of European Gas and energy and gas utilities ... 19
European gas (and power) liberalisation and utility ownership restructuring ... 19
Corporate restructuring and cultural change ... 20
From captive to contestable markets ... 20
Commercial difficulties and strategies 2008-10... 21
The position of Gazprom... 25
Increasing consensus of buyers and continuing opposition of Gazprom ... 26
The future of long term gas contracts: price review and arbitration ... 28
Managing the transition: two scenarios ... 30
Impact of these scenarios on long term contracts and the commercial role of European utilities ... 32
Could both scenarios lead to the breakdown of long term contracts - historical precedents34 Summary and Conclusions ... 36
Bibliography ... 38
Tables and Figures
Table 1: European spot gas prices as percentage of oil-indexed gas prices in Euro/MWh ... 5Table 2: Russian gas exports to Europe, contract years* 2007-2010 (Bcm) ... 25
iv
Figure 1: German oil-linked contract and border prices and NBP prices (Euro/MWh)……....4
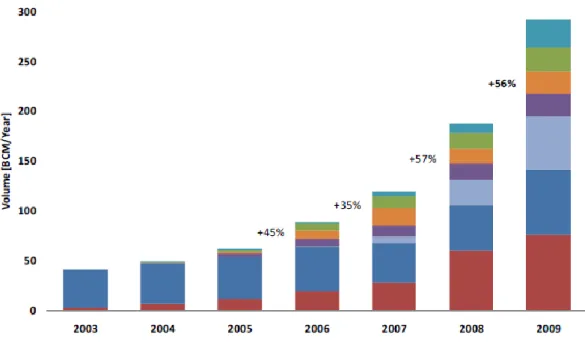
Figure 2: Development of traded volumes at Continental European gas hubs 2003-09 ... 12
Figure 3: Day ahead prices for NBP, NCG, TTF and Zeebrugge, January 2010-January 2011 ... 13
Figure 4: Month ahead prices for NBP, NCG, TTF and Zeebrugge, January 2010-January 2011... 14
Figure 5: Season ahead prices for NBP, NCG, TTF and Zeebrugge, January 2010-January 2011... 14
Figure 6: European gas balance for contract year 2008/2009 ... 23
Figure 7: European balance for contract year 2009/2010 ... 23
1
Acknowledgements
We would like to thank all those who provided comments on an earlier draft, particularly Kim Talus for his observations on legal and regulatory developments. At the Oxford Institute. Patrick Heather provided significant input into the section on hubs, and Patrick and David Ledesma provided us with useful commentary on LNG issues. In addition, we should like to thank ICIS-Heren for permission to quote, and reproduce Figures 3-5, from their European Gas Hub Report. John Elkins‟ editorial skills clarified and corrected more than just our English. We alone are responsible for what remains.
2
Introduction: the basic argument and its dissenters
This is the third paper which the OIES has published dealing with the issue of price changes in Continental European long term gas contracts. The first paper, published in 2007 questioned the rationale of the continuing linkage of prices in long term gas contracts to those of oil products.1 The second paper published in 2009 argued that a transition away from oil product-related pricing was inevitable and imminent and that the endpoint of the transition would be hub-based prices.2 This paper examines the progress of that transition since 2009 and its likely evolution over the next few years.
In the six major Continental European gas markets, the rationale for continued linkage of long-term contract gas prices to those of oil products began to weaken during the 1990s, a process which continued during the 2000s.3 Its original rationale – that end-users had a real choice between burning gas and oil products, and would switch to the latter if given a price incentive to do so – was robust when the netback market pricing mechanism (largely) based on oil product-linkage was established in the 1970s (and earlier in some countries).4 But a combination of:
the virtual elimination of oil products from many stationary energy sectors in these markets;
the cost and inconvenience of maintaining oil-burning equipment and substantial stocks of oil products;
the emergence of modern gas-burning equipment in which the use of oil products means a substantial loss of efficiency;
tightening environmental standards in relation to emissions, particularly sulphur content and nitrogen oxide;
rendered the original rationale increasingly dubious, particularly in North West Europe.5 There is no commercial scenario in which users installing new fuel-burning equipment will choose to use oil products rather than gas in stationary uses, unless they have no access to a gas supply.6
During 2008-10, as the gap between hub-based and oil-linked prices first widened and then narrowed, the rationale for retaining oil-linked gas pricing in Continental European long term gas contracts was replaced by a number of different arguments:
1
Stern 2007.
2
Stern 2009.
3 Stern 2007 and Stern 2009. 4
For the history of this mechanism and its logic see Stern 2007 and Energy Charter Treaty.
5
The position of some smaller markets, especially in South Eastern Europe, is different as they are still burning significant quantities of oil in stationary sectors and have retained greater switchable capacity, see Kovacevic 2007 and 2009 and Giamouridis.
6 However, they may choose to use other alternatives to gas with the main battleground being in power
generation between gas, coal and low carbon (renewable and nuclear) sources. But none of these sources will have prices set in relation to oil products.
3
that producers with market power strongly favour oil-linked prices and do not want to change7;
That the pricing problems encountered post-2008 were of a temporary nature due to economic recession and that hub and oil-linked prices would “recouple” by 2012; that no other appropriate pricing mechanism is available, and specifically that
European gas hubs are both insufficiently liquid and prone to manipulation by local market players to be considered an appropriate price reference;
that abandoning oil-linked prices could lead to price manipulation by a handful of major suppliers – specifically Gazprom – with the possible establishment of a “Gas-Opec”.
This paper addresses these arguments, focusing on commercial developments since late 2009, and the likely unfolding of the transition in relation to prices and contracts.
The many factors bearing on European gas prices: 2008-11
The period since late 2008 has seen the emergence of a “two price”, but what could arguably be called a “hybrid price”, market. This is shown in Figure 1 which compares three different price series:
The purchase price in German long term contracts mainly with Gazprom, Statoil and Gasterra as determined by the formulae in those contracts based (largely) on fuel oil and gasoil;
The BAFA – or average price for all German gas imports – reported monthly by the German Federal Office of Economics and Export Control. Given the confidentiality requirements of the European gas business, this is the only transparent official price available for European oil-linked long term gas contracts.8
The UK NBP hub price.
Figure 1 shows that until the middle of 2009, the German contract and German border prices were very similar, showing that very little gas was imported into Germany at other than at oil-linked levels. However from mid-2009, a gap opened up between the two prices which, by mid to late 2010, was 3-4 Euros per MWh or 10-15% below the price according to the fuel oil/gasoil denominated formulae in the long term contracts.
Figure 1 also shows that the NBP price – which is not an exact proxy for all hub prices across Europe, but is usually within one Euro of other North West European hub prices (TTF, NCG, Gaspool, Zeebrugge, PEGs) - diverged substantially from oil-linked prices in late 2008 with an increasing gap in 2009.9 In late 2010, the gap between NBP and German BAFA prices narrowed and for a brief period at the end of the year spot prices rose above BAFA, but the gap between NBP and German contract prices remained significant. By the first quarter of 2011, with crude oil prices rising above $100/bbl, it was reasonable to assume that the market
7 The market power argument is well made in Finon 2008.
8 There are of course many estimates by price reporting services such as Platts, Argus, ICIS-Heren and others. 9
4
price – ie the price determined by the forces of supply and demand - for gas in North West Europe lay somewhere between NBP and BAFA price levels.
Figure 1: German oil-linked contract and border prices and NBP prices (Euro/MWh)
Source: Howard Rogers, OIES
An alternative methodology for estimating price differentials is provided by Platts, (Table 1) which shows an estimated average of long term oil-linked prices compared with hub prices. The NWE GCI price is probably higher than the German BAFA price in Figure 1 because the latter includes spot (as well as oil-linked) gas imports; and the Dutch TTF usually trades at a slight premium to the UK NBP price in Figure 1. But Table 1 shows that during 2010, the arithmetic average of daily TTF prices was 25% lower than that of oil-linked prices– with a low of 57% and a high of 92% - demonstrating the problems of those facing demands from customers for market based prices, and vulnerable to competition from those able to offer these prices. 0.0 5.0 10.0 15.0 20.0 25.0 30.0 35.0 40.0 € /M Wh
5
Table 1: European spot gas prices as percentage of oil-indexed gas prices in Euro/MWh
TTF average NWE GCI TTF/GCI %
January 2011 22.24 25.84 86 December 2010 24.15 26.13 92 November 2010 19.50 25.98 75 October 2010 18.56 25.54 73 September 2010 18.95 25.07 76 August 2010 18.12 24.21 75 July 2010 19.52 23.55 83 June 2010 19.28 22.62 85 May 2010 16.78 21.80 77 April 2010 13.53 21.56 63 March 2010 11.99 21.00 57 February 2010 13.72 20.74 66 January 2010 14.48 20.02 72 Average 2010 17.38 23.19 75
Source: Platts European Gas Daily: monthly averages, January 2011, p.2.
Note: the Table shows TTF day-ahead prices compared with the Platts North West Europe Gas Contract
indicator (NWE GCI) which indicates a typical price for long term oil-indexed supplies. The final column shows TTF as a percentage of NWE GCI.
Is an alternative index to oil products possible?
In traditional European commercial gas negotiations it was always assumed that market conditions would be affected by competing fuels, fluctuations in GDP growth rates, inflation, changes in industrial structure, environmental regulations and a range of other country- (or possibly region-) specific conditions. These changes were dealt with by means of a “price review” clause which allows the base price (Po) and the indexation formula to be “reset” generally every three years.10 Prices are generally reset – according to the contractual formula – quarterly, based on an average of (mainly) oil-product prices in the preceding 6-9 months, often with a lag of three months. Thus in traditional long term gas contracts, the buyer will be paying a price in the first quarter of a year related to an average of oil-product prices in the first two or three quarters of the previous year. And (as we shall see below) there is very limited opportunity to make fundamental changes to the price formula more frequently than allowed by the three-year review.
While these rigidities caused some problems in the period before 2008, since that date negotiations have become substantially more difficult because of the evolution of different prices noted above, but also because of the “globalisation” of gas (and other energy) markets which means that movements in supply, demand and prices elsewhere in the world have much more immediate impacts on European gas prices than was previously the case. Some examples of this since 2008 have been:
10 Exactly which parameters can be reset, and by how much, is specific to each contract. These
provisions are described in more detail in the Energy Charter Treaty, p. 157-161. For more details of commercial contractual terms, see Melling, Appendix 6.
6
The 2008-09 global recession which (with a few exceptions) created a sharp
downturn in demand for gas followed by an uneven recovery.11 This was especially important in Europe itself and;
in Asia where demand in the established LNG markets of Japan, Korea and Taiwan collapsed in 2009 but recovered very substantially in 2010. Demand in the new markets of China and India was significantly less affected by recession12; The unexpectedly rapid development of unconventional (primarily shale) gas
production in North America which caused Henry Hub prices to fall to much lower levels than had previously been thought possible, reducing US LNG imports to levels far below both expectations and existing import capacity;
Substantial fluctuations in international coal prices which caused equivalent fluctuations in gas demand particularly in the power generation sector;
To a lesser extent (and primarily for power generation customers), short term power and carbon prices leading to changes in the “spark spread” and “dark spread”.
All of this has meant that, since 2008, the commercial environment in which European gas companies have been operating has been subject to a number of new (and difficult to predict) forces which have exacerbated the problems of reliance on the relatively rigid oil-linked price formulae in long term contracts. One of the most significant forces was the impact of the 2009-2010 growth in global LNG supplies, compounded by the shale gas “revolution” in North America.13 Moreover, the different elements of supply and demand have been constantly changing.
The proponents of the „status quo‟, (i.e. those unwilling to countenance replacing the current oil-linked pricing with an alternative formula), claim that there are too many new parameters – which are changing too quickly and unpredictably – to construct an alternative index which will be sufficiently stable while reflecting changing market conditions over time. On the contrary, in a world where LNG connects regions and Europe‟s gas market fundamentals are impacted by events on other continents, the need for a price formation mechanism which responds rapidly to such changes is becoming crucial. This is why – with all of their imperfections (which will be discussed below) – the emerging European gas hubs provide the best indicator of a market price which long term contracts increasingly need to reflect.
Market based gas prices: confusion between price formation and price level
The argument of this paper is that European long term contracts need to move away from oil-linked prices to market prices in order to accurately reflect changing supply and demand conditions; and that hub prices provide the only viable reflection of those conditions. This is principally an argument about price formation and the adoption of a mechanism which more11
For a detailed assessment of the impact of recession on European gas demand see Honore 2011.
12 In India, LNG import growth in 2010 was curtailed primarily by increasing domestic gas production. 13 For background on the globalisation of LNG see Rogers, and for background on North American shale
7
closely reflects rapidly and continuously changing supply and demand conditions in European gas markets. Unfortunately, this argument is often construed as an argument to move to a price level which will always be lower than oil-linked prices ie that market prices mean “low” prices. Given the period between late 2008 and mid 2010, when spot prices in North West Europe were at times up to 50% below oil-linked levels, this is an understandable interpretation, but one which is fundamentally incorrect. As December 2010 showed, it is entirely possible that hub prices can approach oil-linked prices (Figure 1). Indeed there is no reason – in theory, as well as in practice – why market prices could not exceed oil-linked levels depending on supply and demand conditions in oil and gas markets.14 It is therefore important to be clear that proposing a move from oil-linked to hub-based prices does not embody any assumption that the latter will always be lower than the former. The key propositions are that:
conditions in the gas (rather than the oil) market should set gas price levels; gas and oil prices will not “recouple” because their supply/demand dynamics are
fundamentally different;
there should be a single price formation mechanism for gas rather than the hybrid pricing which emerged post-2008.
In other words we believe the co-existence of oil-linked and hub-based pricing is unsustainable, and that the latter is the best available indicator of supply and demand conditions in the gas market.
Gas Market developments during 2009-10
The 2009 paper concluded that a transition away from oil linked pricing in European long term gas contracts was inevitable and imminent. In that paper it was suggested that the only way this transition could be halted would be for one or more of the following trends to become reality:15
European economic recovery would need to be sufficient to see energy and gas demand returning rapidly to 2007 levels in order to absorb the supply surplus. This has not yet happened although there was a significant recovery of demand in 2010, mainly due to a very cold winter.16
US Henry Hub prices would need to rise significantly above NBP prices – possibly as a result of falling domestic production – which would direct surplus LNG towards the US and away from Europe. This did not happen; domestic US production levels were maintained principally due to shale gas development. Henry Hub prices – which are
14
See Stern 2009 (Chart 3) for a discussion of exactly this situation in the UK in 2006 when NBP prices rose far above oil-linked levels for a prolonged period.
15 Stern 2009, pp.14-15. 16
8
the benchmark for spot prices across North America - fluctuated in the range of $3-6/MMBtu during 2010 compared with European hub prices of $7-10/MMBtu and oil-linked prices significantly above those levels. Because it was so much more profitable to deliver LNG to Europe, only 13.1 Bcm and 12.3 Bcm of LNG was delivered to the US in 2009 and 2010 respectively compared with a regasification capacity of around 130 Bcm/year.17
Asian LNG demand – specifically from China and India – would need to rise
significantly, again diverting LNG away from Europe. This did happen especially in the established markets of Japan, Korea and Taiwan, as well as in China. In 2010, Asian LNG demand rose by 18%, removing perhaps half of the global LNG surplus. The anticipated surge of LNG supplies in 2009-10 needed to be delayed by technical or political problems. This did, to some extent, happen because of technical problems with the new Qatari LNG trains, and because of high domestic gas demand in Algeria and Egypt which limited the availability of gas for export. Some have attributed this to deliberate withholding of gas by exporters to support prices (see below).
International crude oil prices needed to fall below $50/bbl and remain there for long enough to close the gap between spot and long term gas prices to manageable proportions. This did not happen – crude oil prices remained in the range of $75-90/bbl throughout 2010 rising above $100/bbl in the first quarter of 2011.
A combination of a lack of third party access, insufficient liquidity at market hubs, and the market power of dominant suppliers and buyers was needed to maintain the pricing and contractual status quo. This did not happen to the necessary extent.
Liquidity increased at all the European market hubs and, due to improvements in third party access, competition increased and the market power of incumbents declined. Not anticipated in the 2009 paper – and a substantial support for gas price levels
during 2010 – was the extremely cold weather in the first three, and the last two, months of the year which in many countries broke records established over many decades.18 This was the major, but by no means the only, factor which over the course of 2010, led European hub gas price levels to converge with the German border (BAFA) oil-indexed price.
As this paper was being completed in March 2011, a huge earthquake and tsunami struck northern Japan which caused around 11GW of nuclear generation capacity to be taken out of service, much of which will be permanently retired. Some part of this capacity will need to be replaced by gas-fired generation which will undoubtedly increase global LNG demand, and create upward pressure on prices.19 The previous month, political upheaval in Libya caused supplies though the Greenstream pipeline to Italy to be interrupted.20
17
Waterborne 2010 p. 48, Waterborne 2011 p.65, IEA/WEO 2009, p 459.
18
For example in the UK, January-March 2010 was the coldest such period for 30 years in most parts of the country and December 2010 was the coldest since records began over a century ago.
19 A less serious earthquake in 2007 removed 8.6 GW of capacity (much of which has been brought back into
service). For an analysis of the inter-relationship between LNG and power generation in Japan see Miyamoto.
20 ENI suspends Libyan gas supplies, European gas Daily, February 23, 2011, p.1. These upheavals were
followed by external military intervention making it impossible to say when supplies might be resumed given the likelihood of sanctions if the Ghaddafi regime remains in power.
9
Market-based prices and anticipated supply and demand trends in the 2010s
The mistake of confusing price formation with price level was noted above, as was the fallacy of equating hub-based prices with “low” prices. In the transition to market based prices, the key issue for stakeholders will be whether they can correctly perceive gas supply/demand trends. In particular whether the surplus of supply over demand, which created the hybrid pricing system post-2008, will continue and when the market will tighten and become short of supply.
In 2010, the International Energy Agency (IEA) identified a global “gas glut” and expressed the view that:
“For as long as the gas glut persists – and our analysis suggests it will for several years – the pressure to move further away from oil indexation will remain, especially for new long term contracts...Contractual price decoupling would not necessarily mean weaker gas prices in the longer term: as the gas glut gradually dissipates, gas prices are likely to come under renewed upward pressure relative to oil prices with the rising cost of supplying gas from remote and difficult locations.”21
“Based on the projected demand…we estimate that this gas glut...will last longer than many exporters believe or hope keeping pressure on them from their major customers to modify pricing arrangements..This pressure is likely to be greatest in Europe where demand is expected to recover less quickly than in Asia Pacific. Our analysis suggests that it may take several years for the gas glut to be fully eliminated.”22
OIES research suggests that the IEA may be confusing a glut of gas transportation capacity with a glut of gas. Using different methodologies, Honore and Rogers both come to the conclusion that oversupply of gas – as opposed to transportation capacity to deliver that gas to Europe – will end sometime during 2012-14. Honore believes that contracted gas is sufficient up to 2014, while Rogers suggests that take or pay levels for pipeline gas will need to be reduced in the early part of the decade but that there will be “a tightening of the system by 2012-13”.23
These conclusions are the result of exhaustive analysis of country by country European supply and demand (Honore) and global LNG supply/demand analysis (Rogers) which necessarily depend on the interplay of a substantial numbers of macroeconomic and energy/natural gas assumptions. However, they are supported by other OIES research which suggests that, by the second half of the 2010s, incremental gas supply to European markets may be limited due to:
21 IEA/WEO 2010, p.185 22 Ibid, p. 195
23
10
Lack of increased availability from North Africa – Algeria, Egypt and Libya;24
No substantial contribution from Caspian and Middle East supplies to Europe until
the end of the 2010s;25
No substantial contribution from unconventional gas production to offset declining
indigenous conventional gas production until the 2020s;26
Uncertainty as to the scale and timing of new global LNG supplies from key countries such as Nigeria, Qatar, Australia, Venezuela and Iran, either due to geopolitics, skills resource constraints, or project cost and complexity.27
If these conclusions prove to be generally correct then, in the second half of the 2010‟s incremental European gas supply will need to come from:
Atlantic Basin-oriented LNG supplies, principally but not exclusively, from Qatar which will be subject to increasing global competition;
Russian supplies which are considered by many countries to be undesirable due to:
o security reasons related to transit, principally through Ukraine and Belarus;28
o fears that Russian gas has been, and will in the future be, used as a political weapon against European countries.
A partial counterbalance to this outlook can be found in official energy projections from the European Union and Member States such as the UK, showing that gas demand will have fallen substantially from the levels of the late 2000s due to the introduction of low carbon energy sources and an increase in energy efficiency.29 If correct, this could mean limited additional import requirements despite peaking and decline of indigenous European production.
The picture which emerges from this somewhat confusing landscape is that, while the early 2010s is likely to be a period of oversupply, by the middle of the decade – and perhaps as early as 2013 – what the IEA refers to as “the gas glut” could disappear and be replaced by a shortage which could become increasingly acute during the late 2010s, until substantial new sources of conventional – and perhaps unconventional – gas become available in the 2020s. This picture may tell us something about the European gas supply/demand balance over the next decade and the expectation that price levels will rise as that balance tightens. However, it says nothing about the relationship of gas prices to oil prices; indeed gas supply and demand fundamentals are likely to be largely independent of oil price levels during this period which, aside from GDP growth levels, will be subject to different dynamics.30
24 See Fattouh and Stern, Chapters 1,3 and 4 and Darbouche. This conclusion was reached prior to the political
upheavals in these countries in early 2011.
25
See Fattouh and Stern, Chapter 15 for Middle Eastern, and Pirani, pp. 401-9, for Caspian analysis.
26
Geny.
27 Rogers; in this context “new” means projects for which a final investment decision has not yet been taken. 28
Yafimava.
29 EU 2008, Annex 1, p.19; DECC 2009, Chart 7, p.104, and DECC 2010, Figure 4a, p.37.
30 For a discussion of the changing dynamics of oil price formation, the different oil markets and the
11
Thus the assertion that, when the gas supply/demand balance tightens, gas prices will “recouple” with oil prices, reflects a fundamental confusion between price level and price formation. A tight supply/demand balance will certainly result in higher prices, but there is no necessary relationship between the latter and oil related price levels.
Hub-based pricing: progress and problems
Trading at Europe‟s natural gas hubs has made significant progress over the past decade – as shown in Figure 2 – but there are still many questions about whether they have sufficient depth and liquidity to be regarded as acceptable price discovery and reference points. Not shown in Figure 2 is data from the British National Balancing Point (NBP) where trading volumes in 2010 were larger than all of the Continental European hubs combined. This hub can be considered mature with limited growth potential.31 The “churn ratio” (of traded volume to physical throughput) was estimated at around 15 (and as high as 19) for the NBP in 2010 while none the Continental European hubs rose significantly above 4, and most were in the range of 2-3; the minimum benchmark for a market to be considered liquid is a churn rate of 10, although some consider a higher figure to be more appropriate.32
The other major problem with Continental European hubs is that, with one exception, they only have significant liquidity of “prompt” daily trades and hence daily prices. These hubs have little or no “curve” ie future trades which would establish forward prices which could provide a basis for hedging future deliveries. The exception is the Dutch TTF where 2-3 year forward trades are possible, but the hub still needs additional depth and liquidity to consolidate the „tradeability‟ of the mid to far curve. The number of active trading participants has continued to grow, reaching 80 and including several companies from Germany‟s NCG hub.
Belgium‟s Zeebrugge Hub (ZEE) and Germany‟s GASPOOL Balancing Services Hub are examples of “physical” hubs, although quite different from each other. ZEE is centred on the actual location of the gas installations and meter points outside Zeebrugge; whereas GASPOOL covers part of the distribution network in the northern half of Germany but is operated as a physical rather than a virtual hub. Trading at ZEE has stagnated and been overtaken by the German and Dutch hubs. Since the BEB hub was re-launched in October 2009 as GASPOOL, trading activity has increased. The operator‟s description of a “balancing services hub” is indicative of the physical nature of this mainly northern German location and, although it does cover quite a large geographical area, it is mainly used by traders to adjust their storage portfolios in relation to NetConnect Germany (NCG). Despite traded volumes increasing appreciably (compared with its predecessor the BEB hub), the absolute traded volumes are the lowest of the main North West European hubs.
31 ICIS-Heren, Figures 2-4, p.31.
32 Ibid, Figure 1; Konoplyanik suggests that a churn rate of 15 or above is required for a market to be
12
Figure 2: Development of traded volumes at Continental European gas hubs 2003-09
Source: IEA, Medium Term Oil and Gas Markets 2010, Paris: IEA WEO 2010, p.207.
NetConnect Germany (NCG), since its inception in October 2009 (having evolved from the previous E.On Gas Transport (EGT)), has become by far the largest gas market area in Germany and, among the Continental European hubs, probably has most potential for further growth. Unlike GASPOOL, it is a virtual trading point within the pipelines of 5 network companies and, as such, has attracted much traded interest from physical and financial players alike. NCG can be traded on the European Energy Exchange (EEX) electronic cleared platform which has made significant progress towards the creation of a German „marker‟ price for natural gas. In January 2011, EEX started to publish an All-German Gas Index (EGIX) which is the arithmetic mean of the daily volume weighted average prices of all the NCG and GASPOOL trades conducted on its exchange.33 In the following month, EdF Trading became a „market maker‟ for the two front months of the NCG contract in order to create and develop further liquidity and therefore traded volume.34 Traded volumes are growing year on year and liquidity is slowly improving, but NCG will need to develop a curve before it can be considered as a true reference point.
33
EEX, Launch of the new EEX Gas Price Index, Press Release, January 27, 2011
http://www.eex.com/en/Press%20Room/Press%20Release/press/86149
34 EEX, EDF New Market Maker in EEX Natural Gas Trading, Press Release, February 1, 2011,
13
Fears of manipulation
Two of the major arguments against moving to hub-based pricing involve the possibility of manipulation either by sellers or buyers of gas, and the likelihood that these prices will be much more volatile than those produced by the traditional oil-linked contracts. While European hub prices are by no means perfectly harmonised, they do not exhibit any marked pattern of divergence over any significant period of time.35 For the four main European hubs (NBP, TTF, ZEE and NCG) in 2010, ICIS-Heren data show some divergence in day-ahead pricing (Figure 3) particularly in September when the Interconnector pipeline was closed for maintenance. However this divergence reduces significantly for month-ahead prices (Figure 4), while season-ahead prices (Figure 5) are almost perfectly correlated across the hubs. Less liquid hubs, such as the Central European Gas Hub (CEGH) at Baumgarten in Austria, and the Punto di Scambio Virtuale (PSV) in Italy are less well correlated, but by early 2011 the spread between day-ahead prices at CEGC and North West European hubs had narrowed significantly.36
Figure 3: Day ahead prices for NBP, NCG, TTF and Zeebrugge, January 2010-January 2011
(Euros/MWh)
Source: ICIS-Heren, Figure 7, p.32.
35
In theory, and other things being equal, the price differences between hubs should reflect the cost of transportation between them. For a debate on whether this did actually happen in the US in the 1990s in the years following the establishment of Henry Hub and NYMEX futures prices see Herbert and Kreil.
36 ICIS-Heren, Figure 9, p.32. 10.000 12.000 14.000 16.000 18.000 20.000 22.000 24.000 26.000 20 /0 1/ 2 … 20 /0 2/ 2 … 20 /0 3/ 2 … 20 /0 4/ 2 … 20 /0 5/ 2 … 20 /0 6/ 2 … 20 /0 7/ 2 … 20 /0 8/ 2 … 20 /0 9/ 2 … 20 /1 0/ 2 … 20 /1 1/ 2 … 20 /1 2/ 2 … 20 /0 1/ 2 … NCG NBP TTF Zeebrugge
14
Figure 4: Month ahead prices for NBP, NCG, TTF and Zeebrugge, January 2010-January 2011
(Euros/MWh)
Source: ICIS-Heren, Figure 8, p.32
Figure 5: Season ahead prices for NBP, NCG, TTF and Zeebrugge, January 2010-January 2011
(Euros/MWh)
Source: ICIS-Heren, Figure 10, p.32
10.000 12.000 14.000 16.000 18.000 20.000 22.000 24.000 20 /01 /20 1 0 20 /02 /20 1 0 20 /03 /20 1 0 20 /04 /20 1 0 20 /05 /20 1 0 20 /06 /20 1 0 20 /07 /20 1 0 20 /08 /20 1 0 20 /09 /20 1 0 2 0 /1 0 /2 0 1 0 20 /11 /20 1 0 20 /12 /20 1 0 20 /01 /20 1 1 NCG NBP TTF Zeebrugge 10.000 12.000 14.000 16.000 18.000 20.000 22.000 24.000 20 /01 /20 1 0 20 /02 /20 1 0 20 /03 /20 1 0 20 /04 /20 1 0 20 /05 /20 1 0 20 /06 /20 1 0 20 /07 /20 1 0 20 /08 /20 1 0 20 /09 /20 1 0 20 /10 /20 1 0 20 /11 /20 1 0 2 0 /1 2 /2 0 1 0 20 /01 /20 1 1 NCG NBP TTF Zeebrugge
15
Thus market manipulation of individual hubs, if it is indeed taking place, was not evident over any significant period during 2010, and it would be reasonable to suggest that a contract price based on month ahead prices, or an average of day ahead prices over a monthly period, for a hub or an average of hubs should be robust against such suspicions. Moreover as hubs gain additional participants liquidity, the scope for manipulation by any single player will diminish.
One of the major problems which is regularly and correctly cited in relation to hub-based pricing is the oligopolistic nature of European gas markets, where relatively few buyers face even fewer sellers and there is thus significant potential for manipulation which is not helped by suspicions of both sides. On the sellers‟ side, this is related to European Commission liberalisation and competition measures, which are suspected of being aimed at reducing both their security of demand and their rents from gas sales. From the buyers‟ side there is suspicion that the Gas Exporting Countries Forum is essentially a „Gas-OPEC‟ in waiting, as evidenced (in this view) by the GECF‟s support for oil indexed pricing.37
This became a topical issue during 2010, when reductions of Qatari exports, officially said to be due to technical problems with six out of twelve LNG trains, led to speculation about deliberate withholding of gas from the market to support prices. In summer 2010, there were reports that 27 Q-class vessels were anchored off Fujairah, including 19 Q-flex (216,000 m3) and eight Q-max (265,000 m3) vessels, leading to further speculation that Qatar was using them for floating storage.38 Some believed they had identified similar reductions in Russian and Algerian deliveries in the second half of 2010, following the Algerian energy minister‟s call for production cuts to support prices, despite this receiving no documented support at the April 2009 GECF meeting in Oran.39 Similar comments were heard in relation to Norwegian technical failures at fields and pipelines during 2009-10 and their impact on NBP prices. While there is nothing to substantiate any of this speculation, in an oligopolistic market any event which deprives the market of supply will create debate about possible cartel behaviour. Under the current long term contractual framework, the scope for short term seller manipulation of prices or volumes is limited. But should that contractual framework change significantly (as we suggest below) the possibility of a gas-OPEC – or a group of countries acting in concert to influence prices - could become more plausible.
Concerns about volatility
Concerns have been expressed that, in comparison to the current oil-linked mechanism, hub based prices will substantially increase volatility. In Figures 3-5 the degree of hub price volatility is evident, and this is unsurprising since one of the effects of the averaging process (described above) used to derive quarterly prices in long term contracts was to minimise such volatility to the maximum possible extent. To a degree, increased price volatility is an
37
Gas Exporters push for oil price parity, International Gas Report, April 26, 2010, pp. 3-4.
38 LNG Storage Off Fujairah Is Equivalent to 3 Months China Demand, Bloomberg, June 29, 2010 39 Carola Hoyos, Algeria calls for united gas supply action, Financial Times, March 16, 2010,
16
inevitable consequence of the need to balance the market in the short term. However, small and medium sized customers will not be exposed to daily or monthly changes, since companies supplying the residential and small industrial and commercial sectors will use a variety of trading strategies to manage volatility and pass through a smoother price pattern to smaller customers. Larger industrial customers and power generators will often have in-house trading capabilities to optimise their own portfolios.
Can there be a single gas price across Europe?
A short paper cannot possibly do justice to the diversity of gas market conditions in 35 European countries. The discussion above focussed on North West European hubs because this is where trading is most advanced and where it will develop most rapidly. Much more could be said about these hubs and about also the French PEGs, Austrian CEGH, Italian PSV and emerging trading points elsewhere in central and southern Europe.40 As hub-based pricing grows stronger in North West Europe, this will have a pan-European impact which will be augmented by additional LNG supplies and increasing pipeline interconnections (and reverse-flow capabilities) between these countries.
In theory, and other things being equal, the price differences between hubs in the same region should reflect only the cost of transportation between them.41 In early 2011, it would require heroic assumptions to suggest a date when these conditions might be reached on a pan-European scale for a number of reasons. First, as we have discussed above, even North West European hubs are not yet perfectly harmonised (although as Figures 3-5 above show the correlation in 2010 was good). Elsewhere in Europe, hubs are less advanced, or are still in the process of being created.
Nevertheless, the fact that from the beginning of 2011, Croatia has been principally supplied by Italian (rather than Russian) gas and has a new pipeline connection to Hungary which in turn has a new pipeline connection to Romania, begins to give an idea of how gas could flow between countries given appropriate price incentives. By 2013, pipeline interconnections will allow LNG arriving in Greece to be delivered to a range of south and central European countries as far north as Austria; or vice-versa for gas to be delivered from the CEGH hub to Greece. While in central and south east Europe these developments are still unfolding, it seems unlikely that any country would wish to remain, and will remain, excluded from the possibility of accessing attractively priced gas from a greater variety of sources. This will be an environment in which hub-based pricing will thrive. A difficult question is whether the new national entry/exit regimes required by the EU‟s 3rd package may create artificial barriers to well-correlated hub prices across Europe.42 We are uncertain as to how this will impact the development of hub-based pricing and the relationship between prices at different national hubs.
40
ICIS-Heren has a complete review of these developments.
41 For a debate on whether this did actually happen in the US in the 1990s in the years following the
establishment of Henry Hub and NYMEX futures prices, see Herbert and Kreil.
42
17
The discussion above has assumed that hub-based prices will become the only commercial reflection of market prices, but this is open to debate. Particularly for power generators, some combination of electricity and carbon prices may be a more accurate reflection of market prices. The Statoil-Poweo contract signed in mid-2010, which features a mix of hub-based gas and spark spread prices – serves as an example of possible future market based gas prices for power generation.43
Moving European gas prices from oil linkage to a hub basis will introduce considerable complexities around the different components of price formation, including the extent to which international gas prices may become subject to the influence of speculators and market sentiment (both of which are factors which affect oil prices). Such issues are beyond the scope of a short paper, but it is certainly possible that speculative elements and market sentiment will play a part in setting a market-based price for gas, as they do for other commodities.44 The historical experience of moving from long term to spot pricing in other markets shows that it can be highly disruptive, and require a significant period of time before a new and adequate status quo is established. There may be attempts to manipulate the market; individual players may also default, giving rise to significant litigation. All of these phenomena were seen in the early years of the Brent market before it became established as a worldwide marker price for crude oil.45 In relation to gas, the NBP encountered serious problems during its early years and its liquidity and depth is still questioned by some.46 A transition to hub-based gas pricing in Continental Europe is likely to experience similar problems.
Pricing in new greenfield gas projects: Shah Deniz and the Southern Corridor as a test case
One of the most usual arguments for retaining long term contracts with oil linked prices has been that only within this commercial framework can new “greenfield” infrastructure – specifically long distance pipelines and LNG terminals – be constructed. Without such “security of demand”, producers will refuse to invest in new gas projects causing future shortages of supply. Gazprom has asserted that moving to hub-based prices may create a “boom and bust” cycle of investments leading to greater long term price volatility.47
But it is not clear (at least to us) that this risk is substantially greater than with oil-linked prices, and we believe that even if it could be demonstrated it would not provide a rationale for retaining oil linkage.
43
Statoil and Poweo conclude innovative gas to power contract, Statoil Press Release, 25 June, 2010.
44
See Konoplyanik for more details of these concerns, but also Komlev who suggests that gas prices will never attract the degree of speculative activity associated with oil prices, which will therefore deprive gas exporters of price advantages which flow from this activity.
45
For a specific account of these events see Horsnell and Mabro, especially pp. 130-147. See Fattouh for a modern account of the evolution of crude oil pricing.
46 Heather pp.4-6. 47
18
While it is certainly true that traditional long term contracts have been the commercial framework favoured by producers (and their bankers) to develop new projects, during the 2000s it became clear that, at least in liberalised markets, projects were being developed where pricing would inevitably be based on hubs. In North America – United States, Canada and Mexico – significant numbers of pipeline and LNG projects were developed during the 2000s for markets based on Henry Hub prices. In the UK, the Ormen Lange project was built in the mid 2000s in order to deliver Norwegian gas to the UK based on NBP prices, as have receiving terminals for Qatari and (largely) north African LNG.48 Significant LNG receiving terminal capacity – for example the Gate terminal in the Netherlands - has been built without a dedicated source of supply, on the basis of capacity commitments from its shareholders, into which, it is assumed, LNG will be sold at hub (in the case of Gate, TTF) prices.49
However, projects requiring large scale investments – in excess of Euros10 billion – have thus far only been built in relation to markets where hub prices were already well established; North America and the UK. But in the 2010s, large projects aimed at supplying Continental European countries are facing the possibility that hub based pricing will be the environment into which they will deliver their product. This particularly applies to the pipeline projects which are aiming to form the “Southern Corridor” – Nabucco, ITGI, TAP and White Stream – bringing gas from the Caspian/ Middle East.50
The project sponsors are seeking long term gas contracts for pipeline capacity and gas supplies, which will initially be the second phase of the Shah Deniz field in Azerbaijan which will produce 16-17 Bcm/year starting in 2017 requiring an investment of $20-25 billion.51
As the first large scale greenfield gas development to be implemented since the start of the price transition in Europe, Shah Deniz Phase 2 will be an important test case for new commercial, and specifically pricing, frameworks, in Europe. Because full production levels will not be reached until 2017, the key commercial question will be the price reference point at that date. In late 2010, the sellers of this gas began negotiations with potential buyers and, although these discussions are confidential, early indications suggest that European gas buyers are willing to sign new long term contracts for these supplies but only at hub-based prices. If this is correct, it will be an important pointer to the future of European gas pricing and could be a complicating factor for the purchase of gas from countries such as Turkmenistan where other external customers – Russia, China and Iran – currently pay oil-related prices.
48
Ormen Lange and other projects are reviewed in Stern and Honore.
49
However, at the time that the capacity holders signed their contracts, they almost certainly did so on the expectation of oil-linked prices.
50
For details of these projects see Honore 2010, pp. 150-154.
51 Firm supplies needed to free up 4 billion Euros in Nabucco pipeline funding, Gas Matters, October 2010, pp.
9-12; this figure is for the upstream investment and pipeline within Azerbaijan, it does not include the cost of any southern corridor pipeline to Europe.
19
The transformation of the commercial structure and culture of European
Gas and energy and gas utilities
The position of the utilities which have traditionally purchased and imported the majority of Continental Europe‟s gas has fundamentally changed over the past two decades due to the merger and acquisition activity created by the liberalisation of gas and power industries. Until the mid 1990s, a single company had a de facto monopoly of gas purchase and sale in each Continental European country. The major exception was Germany where gas companies had regional monopolies but were dominated by Ruhrgas which purchased the majority of imported gas.52
European gas (and power) liberalisation and utility ownership restructuring
The commitment to create a “single market” in energy which was made by the EU in the late 1980s, promised to fundamentally change this status quo. This is not the place to review the long, complex – and for nearly two decades largely unsuccessful - legal/regulatory evolution of liberalisation and competition in European gas industries.53 Suffice it to say that, as EU and national liberalisation programmes began to evolve in the 2000s, following the second EU Gas Directive, European gas utilities began to confront several emerging realities:
Since they were already dominant in their country or region, competition would mean that they would inevitably lose market share. Hence they had an incentive to find other areas of business and probably other countries in which to operate;
They were not large enough companies to compete with electricity utilities, and had no experience in a sector which would inevitably become crucial as gas and power markets became increasingly closely related. The example of Britain, which had liberalised much earlier and where the market had become dominated by a small number of joint gas and power providers, was clear in this respect.54
Network (transmission and distribution) businesses would remain regulated
monopolies which, even if “ownership unbundling” was not required by regulators, would attract a lower rate of return than merchant businesses.
This created a wave of corporate mergers and demergers which, by 2011, had largely been completed except in relation to network ownership. The result was a relatively small number of very large utility companies - E.ON, RWE, EdF, GdFSuez, ENI, Enel, Endesa, Iberdrola and Vattenfall – owning a variety of utility assets across a number of European countries and dominating the European landscape.55
52
For the history and evolution of competition in the German gas market see Lohmann 2006 and 2009.
53 Haase, Chapter 6 has a good review of these developments. 54
Wright, pp. 42-46.
55 By the late 2000s, a combination of European competition decisions, ownership unbundling requirements,
and a desire to raise additional funds, was causing integrated utilities to sell off networks to non-affiliated companies.
20
These changes in industrial organisation were in anticipation of the impacts of “single market” liberalisation and competition measures pursued by the European Commission – and national regulators. In particular, Regulation 715, which became applicable in late 2009, and the “Third Package” of measures (including the third Gas Directive) which became legally binding in March 2011, ushered in fundamental changes to the legal/regulatory status quo in relation to third party access in EU countries.56 These provisions required: much greater separation of network operations, the introduction of network codes in all countries, and the creation of an Agency for the Cooperation of (European) Energy Regulators (ACER).
All of these suggest that regulatory authorities are likely to reinforce existing trends which are pushing gas markets towards greater competition.
Corporate restructuring and cultural change
As a result of this process, the former gas companies became the gas divisions of power (or more general utility) companies where the electricity business was substantially larger than the gas business. The resulting companies – usually with electricity executives dominating the board-level positions – share little of the corporate culture of the old European gas companies. They do not have the multi-decade “relationship culture” created by long term contracts, or any significant commercial experience of relationships with non-European external suppliers. Nor do they have any cultural affinity with traditional long term gas contracts (and oil-linked prices), tending to see these as a “throwback” to a bygone era. In contrast to their counterparts from the former gas companies, the power utilities were much more comfortable with a “trading mindset”, and already had much greater exposure to competitive gas and electricity markets through their ownership of British utility companies. Finally these companies tend to have a “shareholder mentality” which makes them far less tolerant of commercial arrangements which have even a short term negative impact on their share price.
Thus the change in the industrial organisation model in the European utility sector – from single product national/regional companies towards multi-energy pan-European companies – removed much of the historically strong cultural support for the traditional gas business model, and with it much of the support for oil-linkage in long term contracts but not for the contracts themselves.57 This became particularly evident in the post-2008 period as managements recognised the huge financial exposure resulting from oil-linked prices in their long term contracts.
From captive to contestable markets
The commercial model of the traditional gas utilities was relatively simple: they segmented their customer base depending on the ability of the customers to access alternative fuels and
56 EU Regulation 715 and EU Third Gas Directive.
57 Utility managements have continually expressed a desire to see these contracts continue, principally for
21
hence the relative value of gas for each customer group; and they differentially priced between (and sometimes within) classes of customers, safe in the knowledge that without either satisfactory third party access or transparent spot pricing, their customer base was essentially captive.
During the 2010s, European energy and competition law created increasing momentum towards effective third party access, ownership unbundling and regulatory oversight. These developments, combined with the elimination of destination clauses, completely transformed the regulatory and market context in which commodity contracts were operating.58 Two developments were fundamental to that contextual change: the arrival of workable third party access, and the emergence of hubs with transparent prices which could be accessed on a daily basis by any customer with a computer. By early 2011, neither of these developments had reached the level of sophistication of the British market but, to put it at its simplest, the majority of consumers in North West European countries increasingly had a credible choice of suppliers. Thus by the end of the 2000s, the traditional utilities were no longer monopolies which could refuse to take notice of demands from their customers to supply gas at widely available hub price quotations. Nor could they any longer stop customers in their service areas gaining access to lower prices, either by using exclusivity and “no resale” clauses in their contracts with customers, or by maintaining that because they had to pay oil-linked prices under long term contracts, their customers had to accept similar prices.59
Commercial difficulties and strategies 2008-10
As noted above, from around the end of 2008, the co-existence of spot gas traded at hubs and oil-indexed gas created a „hybrid price‟ market. Oil-indexed gas is sold under long term (typically 25 year) contracts. Buyers have the obligation to take or pay for a minimum volume of gas within a contract year (usually from 1st October to 30th September) which is typically 85% of the Annual Contract Quantity. In the context of European hybrid pricing, buyers are able to purchase both spot gas on the traded hubs and oil-indexed contract gas provided that they meet their minimum take commitments in the contract within the contract year.
From early 2009, the traditional utilities found themselves in a precarious commercial situation. Their long term contracts required them to buy minimum quantities of gas at oil-linked prices and sell those volumes at prices at hub-related levels which, as we have seen above, were significantly lower than oil-linked prices during 2009-10. With oil-linked gas increasingly “out of the money”, traditional utilities were required to optimise their purchase and sale activities in a hybrid price market.
58
During the 2000s, the EU competition authorities oversaw the elimination of restrictions on destination in all long term contracts (ie clauses which provided that gas could only be sold in the market of the first buyer of the gas).
59 Exclusivity and “no-resale” clauses were widespread in utility contracts with their customers; the first
obliged customers to purchase their entire gas requirement from a single utility, while the second prohibited customers from reselling any part of the gas which they received.
22
Through a process of arbitrage an importing utility, provided it is confident that it will meet its minimum take level by the end of the contract year in question, will seek to maximise its purchase of cheaper spot gas until:
either it is unable to purchase additional quantities of cheaper spot gas without jeopardising its ability to meet its minimum take commitment;
or the price of spot gas, due to arbitrage reaches the equivalent price of oil-indexed gas and there is no further benefit from buying it in preference to oil-indexed gas, even though the buyer would still be able to reduce its take of oil-indexed gas and meet its minimum take commitment by the end of the Contract Year.
The dilemma facing a European utility, in times of weakened demand and the availability of cheaper spot gas at traded hubs, is how to ensure that all the minimum take volume under a long term contract can be on-sold to end user customers, particularly when spot gas prices are lower and such customers are aware that they have a choice of cheaper supply. This hybrid system came under significant strain during the contract year October 2008 to September 2009.
From an analysis of the European market it is possible to calculate the volume of pipeline imports from Russia, Algeria, Libya, Iran and Azerbaijan in aggregate and compare this to the notional Take or Pay level (assumed to be 85% of Annual Contract Quantity). The key question which emerges from the experience of the 2008/2009 contract year is: why did the buyers fail to take their take or pay volumes? There is a range of possible answers:
They underestimated the scale of the demand downturn and, while maximising their purchase of spot gas, failed to plan their contract nominations to suit demand patterns as the contract year progressed.
They took the view that rolling over the „paid for‟ gas for consumption in a future year (when demand had recovered) was worth the up-front cost, when balanced against access to near term cheaper spot gas.
They effectively „lost control‟ of their end-user customer base, which demanded that gas be supplied at spot prices, and were able to switch supplier if they met a refusal. The importing utilities were thereby placed in a very difficult commercial position: saddled with the liability to pay for minimum quantities of long term contract gas under take or pay commitments; but only able to sell this gas at a loss due to competition with hub-priced supplies available to their customers.
23
Figure 6: European gas balance for contract year 2008/2009
Source: Howard Rogers, OIES
From Figure 6 it is clear that pipeline imports for Contract Year 2008/2009 were lower than the estimated Take or Pay level – in fact they were only 92% of Take or Pay.60 At the end of the contract year several buyers of oil-indexed contract gas from Russia entered discussions which resulted in, among other measures, including the roll-over of physical volumes paid for but not taken until such point in the future as they could be consumed, in addition to the Take or pay volume for future contract years.
Figure 7: European gas balance for contract year 2009/2010
Source:Howard Rogers, OIES
60 Note the Take or Pay level has been adjusted by the estimate of gas which was unavailable for purchase
during the Russia-Ukraine crisis of January 2009, estimated to be 4.5 Bcm. 0 100 200 300 400 500 600 700 Oct 2008 - Sept 2009 Oct 2008 - Sept 2009 bc m
Estimated Pipeline Take or Pay
Net Storage Withdrawal LNG Imports Domestic Production Pipeline Imports -100 200 300 400 500 600 700 Oct 2009 - Sept 2010 Oct 2009 - Sept 2010 bc m
Estimated Pipeline Take or Pay
LNG Imports
Domestic Production Pipeline Imports
24
The situation changed somewhat in Contract Year 2009/2010 (Figure 7). Compared with the previous contract year, demand was noticeably higher as a consequence (noted above) of the cold winter, fuel switching from coal and recovery from the recession. Thus despite the significant increase in LNG imports, pipeline imports were higher at 98% of the estimate of Take or Pay levels.
One explanation of the converging price trend between BAFA and NBP is that upon emerging from the severe winter 2009-10, buyers of oil indexed pipeline gas realised that they could lower their contract nominations and increase their purchases of cheaper spot gas and still (just about) meet their take-or pay levels by the end of September 2010. This certainly corresponds to the pattern of spot gas flowing through IUK from the UK to Europe shown in Figure 8. Arbitrage through the summer of 2010 served to bring the UK and North European hub prices closer to the oil indexed price as represented by the German border (BAFA) price in Figure 1.
Figure 8: Bacton – Zeebrugge Interconnector flows October 2009 – October 2010
Source: IUK Website
The question arises however whether this outcome for contract year 2009/2010 was by design or accident. Another explanation of these events would be that:
Arbitrage led to convergence or near convergence of NBP and North West Europe traded hub prices with the German border (BAFA) price;
Midstream incumbents „lost control‟ of end user customers and were unable to sell on their take or pay volumes in full;
Upstream suppliers of oil-indexed gas, to mitigate their loss of contract sales volumes to midstream incumbents at oil indexed prices, were selling gas at European hubs directly, using their in-house trading capabilities.
-80 -60 -40 -20 0 20 40 60 80 0 1 /1 0 /2 0 0 9 0 1 /1 1 /2 0 0 9 0 1 /1 2 /2 0 0 9 0 1 /0 1 /2 0 1 0 0 1 /0 2 /2 0 1 0 0 1 /0 3 /2 0 1 0 0 1 /0 4 /2 0 1 0 0 1 /0 5 /2 0 1 0 0 1 /0 6 /2 0 1 0 0 1 /0 7 /2 0 1 0 0 1 /0 8 /2 0 1 0 0 1 /0 9 /2 0 1 0 0 1 /1 0 /2 0 1 0 0 1 /1 1 /2 0 1 0 0 1 /1 2 /2 0 1 0 m m c m /d a y Flow Import Capacity Export Capacity
25
It is not possible to determine from European or Russian data whether imports of pipeline gas into Europe are being sold within a long term contractual framework, or directly by upstream suppliers at the hubs. The alternative explanation outlined above would only be borne out by media reports of take-or-pay shortfall-related discussions between contract sellers and buyers relating to the 2009/2010 contract year.
The position of Gazprom
While the minimum take or pay volumes of all European suppliers came under pressure during 2008-10, the position of Gazprom was of special significance because of the size and centrality of its supplies to the European gas market. As far as can be ascertained, the vast majority of the failures to meet take or pay levels during the 2008-10 were in the Russian contracts.
Table 2: Russian gas exports to Europe, contract years* 2007-2010 (Bcm)
2007-08 2008-09 2009-10 Germany 39.72 27.02 36.82 Italy 23.57 19.04 12.43 Turkey 24.43 20.75 16.85 France 11.26 9.64 11.16 UK 6.10 7.47 6.68
Total “Western Europe”** 124.08 99.76 101.12
Total “Central Europe”** 44.53 33.4 40.98
TOTAL EUROPE (Gazprom definition) 168.61 133.16 142.10 Total including Baltic Countries*** 173.21 136.5 146.28
Sources: Interfax Russia & CIS Oil and Gas Weekly: February 14-20, 2008, p.20; November 12-18, 2009, p.27; February 11-17, 2010, p.31; November 11-17, 2010, p.30.
Note: *This is Russian data for contract years (October 1-September 30 of respective years) and therefore differs from either Russian or western data for calendar years. It also differs from data from sources such as IEA, EIA, Cedigaz, some of which do not include exports to countries such as UK. It is also different from Gazprom IAS data which include all gas sold by Gazprom affiliates in Europe whether or not of Russian origin. **These are the old “Cold War” categories reflecting countries which were part of the Soviet economic area (CMEA) prior to 1991 and those which were not.
***Gazprom data for exports to Europe do not include Baltic countries which are included in the category of “former Soviet Union”.
This resulted in renegotiations between Gazprom and its buyers which were exposed to competition from North West European hub prices. At the beginning of 2010, it was widely reported that a number of companies had demanded both reductions in contractual take or pay volumes and reductions in prices.61 As a result, Gazprom agreed with a number of companies that a 15% share of the price indexation would be moved to hub based prices for three years
61 These included E.ON, Wingas, Botas, Eni, RWE and Econgas. `Europe rethinking contracts with Gazprom’,