Applications of mathematical software packages for modelling
and simulations in environmental engineering education
Asher Brenner
a,*
, Mordechai Shacham
b, Michael B. Cutlip
ca
Program of Environmental Engineering, Ben-Gurion University of the Negev, Be’er-Sheva 84105, Israel
b
Department of Chemical Engineering, Ben-Gurion University of the Negev, Be’er-Sheva 84105, Israel
c
Department of Chemical Engineering, University of Connecticut, Storrs, CT 06269, USA
Received 20 June 2004; received in revised form 1 September 2004; accepted 3 September 2004
Abstract
Modelling and simulation of the oxygen-sag model are used to demonstrate the potential benefits of the application of user friendly numerical software packages in environmental engineering education and practice. The simulation is used to obtain the profiles of oxygen concentration, oxygen deficit, as well as de-oxygenation and re-oxygenation rates as function of distance for a steady river velocity. Simulations are carried out for various organic loads and ambient temperatures.
It is shown that the solution profiles obtained by numerical simulation demonstrate the processes involved more than the point values provided by analytical solution. The use of the user friendly software packages encourages the students to ask ‘‘what if’’ questions, to carry out parametric studies and to learn by ‘‘discovery’’. Due to the many benefits of modelling and simulation we can envision rapid spread of the use of simulation in environmental, chemical and biotechnology engineering education and practice.
Ó2004 Elsevier Ltd. All rights reserved.
Keywords:Education; Environmental engineering; Modelling; Oxygen sag; POLYMATH; Simulation; Wastewater treatment
1. Introduction
The Environmental Engineering Graduate Program at The Faculty of Engineering Sciences of The Ben-Gurion University of The Negev, Israel, offers a multidisciplinary approach to solving environmental problems. Research and teaching in the program focus on fundamental understanding of the basic chemical, physical, and biological processes underlying environ-mental engineering and science problems. Areas of research specialization include: physical, chemical, and biological processes for water quality control; aerosols and air pollution modelling and control; aquatic
chemistry; transport and fate of pollutants in water, air, and soil; treatment of solid waste and hazardous materials; membrane separation processes; bioremedia-tion of contaminated soil and groundwater and more. Students with a bachelor of science in engineering or related areas such as chemistry, geology, biology, or environmental science, may apply for admission to the M.Sc. Program in Environmental Engineering. The M.Sc. degree is configured to provide a broad founda-tion in environmental engineering to enable adaptability in industrial, applied or research applications. Comple-mentary courses are required for students who do not have engineering education. The complementary pro-gram is designed on an individual basis to meet the needs and interests of each student. Graduates of engineering departments should complete a few courses according to their specific background.
* Corresponding author. Fax:C972 8 6479030.
E-mail addresses: [email protected] (A. Brenner), shacham@ bgu.ac.il(M. Shacham),[email protected](M.B. Cutlip). 1364-8152/$ - see front matterÓ2004 Elsevier Ltd. All rights reserved. doi:10.1016/j.envsoft.2004.09.007
Computer science is a vital educational prerequisite in all engineering departments of the Ben-Gurion Univer-sity. The advent of computers during the last decades has led to the implementation of advanced computer-based methods in environmental engineering education and practice (Argent, 2004). Computers are powerful devices which have been used in many processes to collect, store, process, and analyze data. The large variety of functions that can be handled simply and efficiently has made the computer an ideally suited tool for simulation and analysis of basic phenomena and of deep mathematical models. Public and statutory awareness to environmen-tal pollution problems have also contributed to the recognition that environmental quality control deserves the same computerization efforts as those applied in industry. Stringent air and water quality standards require the use of advanced design methods and sophisticated computer systems for on-line monitoring, analysis, and control of process performance.
Mathematical modelling and simulation, that involve mathematical replication or representation of a process, are advanced methods which have become popular in recent years. They are used for a design of treatment processes and for evaluations of transport and trans-formation phenomena of various pollutants in natural environments such as air, rivers and groundwater (Spanou and Chen, 2000). They can also serve as powerful tutorial tools in environmental engineering programs for problems that have various levels of complexity. Learning by simulation is very effective since the students have the chance to simply test the effects of various parameters on natural and man-made processes. Simulation can also extend and enrich simple problems enabling the students to try various scenarios and understand their consequences.
In recent years several simulation and data analysis programs such as ASIM (Gujer and Larsen, 1995) or AQUASIM (Reichert, 1995) were published and found broad applications in environmental engineering educa-tion and practice. The POLYMATH package because of its simplicity and versatility can serve as a starting educational tool (in the bachelor degree level) to encourage further study, use and development of more sophisticated computer programs in environmental engineering and related fields.
2. The POLYMATH1package
POLYMATH is a user friendly numerical computa-tion package, which has been specifically created for the educational or professional use by engineers. The various POLYMATH programs allow the user to apply
effective numerical analysis techniques during interac-tive problem solving on personal computers. The types of problems that can be solved using the various programs include linear and nonlinear algebraic equa-tion systems, ordinary and partial differential equaequa-tions, differential algebraic equations and multiple linear, polynomial and nonlinear regressions. The advantages of POLYMATH for undergraduate education are its user friendliness, short learning curve and that it requires only a minimal user intervention in the technical details of the solution process. Some unique features of POLYMATH will be pointed out with reference to the examples presented in the next section. POLYMATH has been incorporated into several textbooks, such as Fogler’s (1999) textbook of ‘‘Ele-ments of Chemical Reaction Engineering’’ and Kyle’s (1999) textbook of ‘‘Chemical and Process Thermody-namics’’. In these textbooks, solutions of many of the examples are presented as direct copy of the POLY-MATH input and tabular and graphical result files. It has been extensively tested and compared with addi-tional software available for numerical problem solving in undergraduate engineering education (Shacham and Cutlip, 1999). The conclusion of this evaluation was that in order to enable engineering students and practicing engineers to solve problems most efficiently they should be familiar with several software packages. The initial problem set-up and debugging can be carried out, most efficiently, with POLYMATH while additional stages of repetitive, parametric solutions and tabular and graph-ical summary of the results are done using a spreadsheet program (such as Excel2) or a software package that supports programming (such as MATLAB3).
The latest version of POLYMATH provides auto-matic migration to Excel and an Excel Add-In for solving ordinary differential equations. POLYMATH models can be converted to MATLAB functions using a few simple rules (Shacham and Cutlip, 2004). Thus in addition to its value as a numerical problem solving tool POLYMATH also enables increasing the level of sophistication in which spreadsheets are used and alleviates the application of programming languages for engineering problem solving.
3. Simulation of the oxygen sag model
The oxygen-sag model is a classical problem, used for demonstration of various subjects in the basic course of ‘‘Water Pollution Control’’. This course is offered as an elective introductory course to all the engineering departments at the Ben-Gurion University.
1
POLYMATH is copyrighted by M. Shacham, M.B. Cutlip and M. Elly (http://www.polymath-software.com/).
2 Excel is a trademark of Microsoft Corporation (http://www.
microsoft.com). 3
MATLAB is trademark of The Math Works, Inc.,http://www. mathworks.com.
The oxygen-sag model was first introduced by Streeter and Phelps (1925)to predict the oxygen concentration and deficit in a river, caused by a discharge of a sewage containing BOD consuming oxygen. This problem demonstrates the connection between ecology and environmental engineering, illustrates the phenomena of transport and transformation processes and serves as an introduction to kinetics and mass balance evaluations for further process design studies. It is included in most text books of Environmental Engineering (see Tchoba-noglous and Schroeder, 1985).
The model consists of several dynamic (differential) equations that describe the processes of de-oxygenation and re-oxygenation as a function of time or distance (related to the river velocity), assuming ideal plug-flow conditions in the flowing river. The natural oxygen balance in the river is disturbed by oxygen depletion (de-oxygenation) due to the sewage BOD which is biodegraded aerobically by natural bacteria. Oxygen replenishment in the river (re-oxygenation) is caused by absorption of atmospheric oxygen stimulated by the turbulent flow. The main parameters involved in this kind of a problem are:
Q flow rate (m3/d)
V river velocity (m/d)
BOD biochemical oxygen demand (mg/L)
L ultimate BOD (mg/L)
C oxygen concentration (mg/L)
Cs oxygen saturation concentration (mg/L)
D oxygen deficit (mg/L)
k first order BOD degradation rate coefficient (de-oxygenation constant) (d1)
r atmospheric oxygen dissolution rate coefficient (re-oxygenation constant) (d1) t time (d) T temperature (C) Indexes: r river sw sewage (wastewater) a dilution point cr critical point de de-oxygenation re re-oxygenation
The change of ultimate BOD in the river as a function of hydraulic detention time (actual time of flow) can be described by a first order reaction:
dL
dtZkL ð1Þ
The integrated form of this equation is:
LtZLaexpð ktÞ ð2Þ
Since BOD depletion is related (ratio of 1:1) to oxygen consumption, the resulting change of oxygen concentration due to the biochemical reaction is: dCde
dt Z
dL
dt ZkLZkLaexpð ktÞ ð3Þ
On the other hand, the rate of re-oxygenation can be described by:
dCre
dt ZrðCsCÞ ð4Þ
Thus the resulting balance of oxygen along the river is: dC dt Z dCre dt C dCde dt ZrðCsCÞ kLaexpð ktÞ ð5Þ Using the definition of deficit (DZCsC), the
oxygen deficit along the polluted river can be described by:
dD
dt ZkLaexpð ktÞ rD ð6Þ
The integrated form of Eq. (6) yields a simple algebraic solution of the deficit as function of time: DtZ
kLa
ðrkÞ½expð ktÞ expð rtÞCDaexpð rtÞ ð7Þ
Further mathematical differentiation, using: dD
dt Z0; d2D
dt2!0 ð8Þ
Yields the critical (maximum) deficit and related time as follows: DcrZ LaexpðktcrÞ f ð9Þ where tcrZ 1 kðf1Þln f 1ðf1ÞDa La ð10Þ and fZr k ð11Þ
The basic parameters that allow dynamic or algebraic solutions of the above equations are the values of the ultimate BOD, oxygen concentration and oxygen deficit at the discharge (dilution) point (a), given as follows:
LaZ ðQrLrCQswLswÞ ðQrCQswÞ ð12Þ CaZðQrCrCQswCswÞ ðQrCQswÞ ð13Þ DaZCsCa ð14Þ
The temperature effect on the kinetic coefficients k andrcan be described by:
kðTÞZkðToÞ1:047ðTToÞ ð15Þ
rðTÞZrðToÞ1:024ðTToÞ ð16Þ
Typical assignments for the students include the calculation of the critical oxygen deficit and the consequent minimum oxygen concentration that endan-gers aquatic life, as a function of the discharged sewage organic load which is determined by the flow-rate and the BOD concentration. These assignments were com-pleted in the past relying on the algebraic equations obtained by analytical solution of the differential equations. The POLYMATH program can simulta-neously solve the differential and algebraic equations, enabling comparison of the results. It can calculate separately the de-oxygenation (Eq. (3)) and the re-oxygenation (Eq. (4)) to demonstrate the first order kinetics and concentration-gradient kinetics, respec-tively. The resulting trends of change (curves) of the oxygen concentration and the oxygen deficit along the river can be obtained by the solution of Eqs. (5) and (6). The POLYMATH results include both the graphical solution of Eqs. (3)–(6) and the related numerical values of the main parameters. Among the parameters dis-played are the maximum deficit and the minimum oxygen concentration, which can be compared to the solution of the algebraic Eqs. (9) and (10). Further simulations can be carried out in order to assess the effect of sewage BOD load (namely,Lswand/orQsw) on
the oxygen concentration and deficit (values and locations), to demonstrate the effect of a preliminary wastewater treatment. The values of the two kinetic constants and their temperature dependence can also be used in simple simulations to show their combined effect on the two processes and on the specific extreme parameters (minimal oxygen concentration and the consequent critical oxygen deficit).
4. POLYMATH solution
The system of differential and algebraic equations entered into the POLYMATH package is shown in
Fig. 1. It can be seen that only very minor modifications of Eqs. (3)–(16) are required. In practice, the model equations, the constants definitions and the initial values of the variables can be ‘‘Copied’’ from an external text (such as Word or Excel), ‘‘Pasted’’ into POLYMATH and slightly modified. If another program (Matlab for example) is used for simulation, the equations must be rewritten in the syntax and format required by the particular program.
Note that POLYMATH automatically reorders the equations to allow explicit expression of the algebraic variables. The POLYMATH entry screen also displays a list of undefined variables during problem entry which is extremely helpful in debugging the mathematical model. The POLYMATH model, as shown inFig. 1, serves as a clear and compact documentation of the problem solution. This documentation includes all the equations, initial values of the dependent and independent variables, final value of the independent variables and comments to describe the notation and units used.
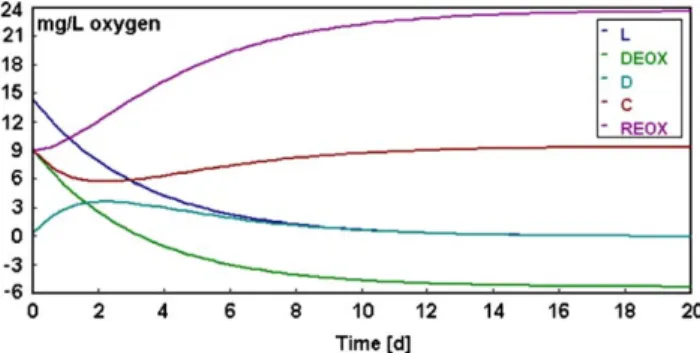
POLYMATH is menu driven, and all the available options are presented on the screen. No technical information regarding the integration method, step-size, and error criterion needs to be provided by the user. The software has a default relative error tolerance value which halts the integration with an error message if a solution cannot be obtained with the desired accuracy. The output shown inFig. 2indicates that the results can be displayed in graphical form of such quality that they can be directly included in student reports. The scaling and labeling is accomplished automatically but can be modified if desired.
4.1. Calculation of the profiles of de-oxygenation, re-oxygenation, oxygen concentration
and oxygen deficit
This is a basic problem demonstrating how the rates of the two main processes (i.e., de-oxygenation and re-oxygenation) change with time, as function of the residual organic matter L (first order kinetics for de-oxygenation) and with the oxygen gradientCs–C(Fick’s
law for re-oxygenation). This information is shown clearly in Fig. 2, which demonstrates the higher rate of oxygen consumption (DEOX curve, parallel to the L depletion curve) at the beginning of the combined process (i.e., close to the dilution point). The trend is affected also by the relative values of the two kinetic coefficients: k and r. The result is an initial gradual decrease of the oxygen concentration (C) and a mirror-shape increase of the oxygen deficit (D). At the critical
point, the combined effect of the higher kinetic co-efficient r and the reduced driving force (low residual organic matter L) for the first order BOD degradation (and for the consequent oxygen depletion) results in a gradual increase of the oxygen concentration to the saturation level Cs, and a mirror-shape decrease of the
oxygen deficit to zero. The concentration profiles,
obtained as a function of time or distance for a steady river velocity by the simulation, contribute much more to the students’ understanding of the processes involved than seeing just the point values obtained from solution of the algebraic equation.
It should be noted that in addition to the graphical
output shown in Fig. 2 POLYMATH also provides
textual output that includes all the equations and the initial, final, minimum and maximum values of all problem variables. This enables to compare the differ-ential and algebraic solutions and to check possible input errors.
4.2. The effect of organic load
To simulate the effect of organic load, the basic problem was solved using three values of Qsw (1000,
1500 and 2000 m3/d) for the same data presented in
Fig. 1. This resulted in the solution of the problem for three different organic load values of 300, 450 and 600 kg BOD per day. This simulation represents the case
Fig. 1. POLYMATH input screen for the oxygen SAG model.
Fig. 2. POLYMATH graphical output of the oxygen SAG problem solution.
of population growth (wastewater flow rate increase) that may require the application of a preliminary sewage treatment in order to reduce the BOD concentration and thus to enable a secured disposal. POLYMATH graphical output given in Fig. 3 shows oxygen deficit curves (as a function of time) for the three organic loads tested, where the critical oxygen deficit increases with the increase of organic load. The critical time for the three loads does not change and remains constant at 2.204 days since the ratio Da/La does not change with
the change ofQsw(see Eqs. (10), (12), (13) and (14)). The
oxygen deficit curves or the mirror-shape oxygen concentration curves (that can be obtained simulta-neously) are simple and efficient tutoring tools that demonstrate the changes of oxygen balance along the river and the consequent regions where aquatic ecosys-tem might be jeopardized.
4.3. The effect of temperature
Temperature is a very important parameter in environmental systems involving chemical, physical and biological processes. It affects the reaction rates and the solubility of gases and solids. The combined effect of temperature on the two kinetic coefficients and on the ultimate BOD of the sewage (k, r and Lsw
increase with increasing temperature) and on the oxygen saturation concentration (Cs decreases with increasing
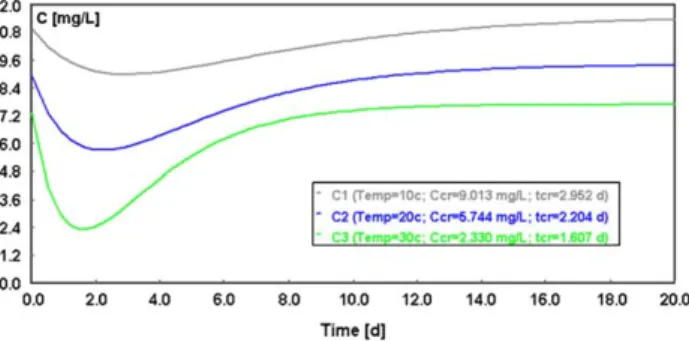
temperature) results in a significant change of the oxygen mass balance in the river.Fig. 4shows the river oxygen profiles (as a function of time or distance from the disposal point) for three temperatures (10, 20 and 30C) obtained by POLYMATH simulations using the basic data shown in Fig. 1. This figure demonstrates nicely the significant decrease of the critical oxygen concentration caused by the increase of temperature.
Fig. 4also shows that the increased temperatures cause the critical point downstream to be reached sooner (tcr
decreases). Thus, the changes caused during the warmer months of the summer become clearly visible to the students by the simulation, and consequences of a thermal pollution become understandable.
5. Conclusions
It has been shown that the use of a simple numerical computation tool for modelling and simulation can be very beneficial in environmental engineering education and practice. It can provide profiles of various variables changing with time instead of the point values of the same variables usually obtained by analytical solution. Seeing a profile considerably contributes to the un-derstanding of the processes involved.
The use of the simulation encourages the students to ask ‘‘what if’’ questions (such as what is the effect of organic load and/or of the temperature) and to carry out parametric studies (change of oxygen concentration, oxygen deficit and biochemical oxygen demand with time or with distance) because of the speed and the simplicity in which the answers to those questions can be found. Thus, the simulation enables learning by ‘‘discovery’’ instead of the traditional learning techni-ques, which are much less exciting.
It is important, however, that the computer program used is simple to understand and use and the results are easy to interpret. This way the learning effort is concentrated on the subject matter of the course, not on the technical details of the program being used. With the introduction of user friendly numerical simulation programs (such as POLYMATH) with short learning curve and only minimal user intervention in the technical details of the solution process, we can envision rapid introduction and effective use of simulations in environmental, chemical and biotechnology engineering education and practice.
References
Argent, R.M., 2004. An overview of model integration for environ-mental applications – components, frameworks and semantics. Environmental Modelling and Software 19 (3), 219–234. Fogler, H.S., 1999. Elements of Chemical Reaction Engineering.
Prentice Hall, Upper Saddle River, NJ, USA.
Gujer, W., Larsen, T.A., 1995. The implementation of biokinetics and conservation principles in ASIM. Water Science and Technology 31 (2), 257–266.
Kyle, B.G., 1999. Chemical and Process Thermodynamics. Prentice Hall, Upper Saddle River, NJ, USA.
Reichert, P., 1995. Design techniques of a computer program for the identification of processes and the simulation of water quality in aquatic systems. Environmental Software 10 (3), 199–210. Shacham, M., Cutlip, M.B., 1999. A comparison of six numerical
software packages for educational use in the chemical engineering curriculum. Computers in Education Journal IX (3), 9–15. Shacham, M., Cutlip, M.B., 2004. Enhancing computer-based problem
solving skills by combination of software packages. Proceedings of the 2004 ASEE Annual Conference, Salt Lake City, Utah, June 20–23.
Spanou, M., Chen, D., 2000. An object-oriented tool for the control of point-source pollution in river systems. Environmental Modelling and Software 15 (1), 35–54.
Streeter, N.W., Phelps, E.B., 1925. A study of the pollution and natural purification of the Ohio River, III. Factors concerned in the phenomena of oxidation and reaeration. U.S. Public Health Service Bulletin No. 146.
Tchobanoglous, G., Schroeder, E.D., 1985. Water Quality – Charac-teristics, Modeling, Modification. Addison-Wesley Publishing Company, USA.