2013
Public Transportation
Fact Book
2013 PUBLIC TRANSPORTATION
FACT BOOK
64th Edition
October 2013
PUBLISHED BY
American Public Transportation Association
Fact book historical tables and additional data are available at:
http://www.apta.com/resources/statistics/Pages/transitstats.aspx
American Public Transportation Association
1666 K Street, N.W., Suite 1100
Washington, DC 20006
TELEPHONE: (202) 496-4800
E-MAIL: [email protected]
www.apta.com
APTA’s Vision Statement
Be the leading force in advancing public transportation.
APTA’s Mission Statement
APTA serves and leads its diverse membership through advocacy, innovation,
and information sharing to strengthen and expand public transportation.
prepared by
John Neff, Senior Policy Researcher
(202) 496-4812
[email protected]
Matthew Dickens, Policy Analyst
(202) 496-4817
[email protected]
PUBLIC TRANSPORTATION FACT BOOK
American Public Transportation Association
Washington, DC
October 2013
Material from the
2013 Public Transportation Fact Book
may be quoted or reproduced
without obtaining the permission of the American Public Transportation Association.
Suggested Identification: American Public Transportation Association:
2013 Public
Transportation Fact Book
, Washington, DC, October, 2013.
TABLE OF CONTENTS
3
Table of Contents
APTA AND THE FACT BOOK ... 5
NATIONAL DATA SUMMARY ... 6
Table 1: Number of Public Transportation Systems by Mode ... 6
Table 2: National Totals ... 7
Table 3: 50 Largest Transit Agencies Ranked by Unlinked Passenger Trips and Passenger Miles ... 8
Table 4: 50 Urbanized Areas with the Most Transit Travel, Ranked by Unlinked Passenger Trips, Passenger Miles, and Population ... 9
PASSENGER TRAVEL ... 10
Table 5: Unlinked Passenger Trips and Passenger Miles by Mode ... 10
Figure 1: Transit Ridership is at Highest Level in Five Decades ... 11
Figure 2: Since 2004 Transit Use Has Grown More Than Population or Highway Travel ... 11
Figure 3: Average Unlinked Passenger Trip Length ... 12
SERVICE PROVIDED ... 12
Table 6: Vehicle Miles Operated, Vehicle Hours Operated, and Transit Service Speed by Mode ... 12
MODAL SHARES OF SERVICE PROVIDED AND CONSUMED ... 13
Figure 4: Vehicle Revenue Miles ... 13
Figure 5: Vehicle Revenue Hours ... 13
Figure 6: Unlinked Passenger Trips ... 13
Figure 7: Passenger Miles ... 13
CUSTOMER INFORMATION SYSTEMS ... 14
Figure 8: Information Systems for Riders: Availability of Static Data ... 14
Figure 9: Percent of Systems with Proprietary Limits on Base Data ... 15
Figure 10: Percent of Systems with Static Data Available to 3rd Party Apps ... 15
Figure 11: Percent of Systems with Arrival Time Formats ... 15
VEHICLES ... 16
Table 7: Revenue Vehicles by Mode ... 16
Table 8: Vehicle Characteristics by Mode ... 16
Figure 12: Increase in Transit Vehicle Accessibility ... 17
Table 9: Vehicle Equipment by Mode ... 17
Figure 13: Growth in Percentage of Buses with Passenger Equipment ... 18
Table 10: Vehicle Power Sources by Mode ... 18
INFRASTRUCTURE ... 19
Table 11: Rail Track Miles and Directional Route Miles ... 19
Table 12: Bus and Ferryboat Lane Miles and Directional Route Miles ... 19
Table 13: Passenger Stations by Mode ... 20
Table 14: Maintenance Facilities by Mode ... 20
Figure 14: Growth in Percentage of Passenger Stations with Electronic Amenities ... 21
Table 15: Passenger Station Equipment by Mode ... 21
PASSENGER STATION PARKING ... 21
Table 16: Passenger Station Parking Supply by Mode ... 22
EMPLOYEES ... 22
Table 17: Employees by Mode and Function ... 22
Table 18: Jobs Supported by Transit Expenditures... 23
ENERGY AND ENVIRONMENT ... 23
Table 19: Energy and Emission Benefits from Public Transportation ... 23
Figure 15: Growth in Transit Congestion Savings ... 24
Table 20: Vehicle Fuel Consumption by Mode of Service ... 24
TABLE OF CONTENTS
4
SAFETY ... 25
Figure 16: Passenger Fatality Rates ... 25
CAPITAL AND OPERATING EXPENSES ... 25
Table 21: Capital Expense by Mode and Type ... 25
Table 22: Operating Expense by Mode and Function Class ... 26
Table 23: Operating Expense by Mode and Object Class ... 26
Table 24: Total Expense by Mode ... 27
Figure 17: Comparative Operating Costs Among Modes ... 27
Table 25: Short-Term Economic Impact per Billion Dollars of National Investment in Transit ... 28
CAPITAL AND OPERATING FUNDING ... 28
Table 26: Funding Sources ... 28
Figure 18: Growth in Capital Funding by Source... 29
Figure 19: Growth in Operating Funding by Source ... 29
Table 27: Passenger Fares by Mode ... 30
MODAL DATA ... 30
Table 28: Roadway Modes National Totals ... 34
Table 29: 50 Largest Bus Agencies Ranked by Unlinked Passenger Trips and Passenger Miles ... 35
Table 30: Bus Rapid Transit Agencies Ranked by Unlinked Passenger Trips and Passenger Miles ... 36
Table 31: Commuter Bus Agencies Ranked by Unlinked Passenger Trips and Passenger Miles ... 36
Table 32: 50 Largest Demand Response Agencies Ranked by Unlinked Passenger Trips and Passenger Miles ... 37
Table 33: 30 Largest Transit Vanpool Agencies Ranked by Unlinked Passenger Trips and Passenger Miles ... 38
Table 34: Trolleybus Agencies Ranked by Unlinked Passenger Trips and Passenger Miles ... 38
Table 35: Rail Modes and Ferryboat National Totals ... 39
Table 36: Commuter Rail and Hybrid Rail Agencies Ranked by Unlinked Passenger Trips and Passenger Miles ... 40
Table 37: Heavy Rail Agencies Ranked by Unlinked Passenger Trips and Passenger Miles ... 40
Table 38: Light Rail and Streetcar Agencies Ranked by Unlinked Passenger Trips and Passenger Miles ... 41
Table 39: Other Rail Agencies Ranked by Unlinked Passenger Trips and Passenger Miles by Type of Rail Agency ... 41
Table 40: Ferryboat Agencies Ranked by Unlinked Passenger Trips and Passenger Miles ... 42
INTERCITY PASSENGER RAIL ... 42
Table 41: Systemwide Intercity Passenger Rail ... 42
Figure 20: Amtrak Systemwide Intercity Ridership Shows Long-Term Growth ... 43
Figure 21: Amtrak Stations with Over 1,000,000 Tickets ... 43
Figure 22: Ridership on Busiest Intercity Passenger Rail Services ... 43
CANADIAN DATA ... 44
Table 42: Canadian Transit Data Summary ... 44
APTA ASSOCIATION HISTORY ... 45
APTA Association Ancestry ... 45
APTA Chief Executive Officers... 46
APTA Lifetime Achievement Award Recipients ... 46
APTA Senior Elected Officers ... 46
APTA Hall of Fame ... 48
MILESTONES IN PUBLIC TRANSPORTATION AND HIGH-SPEED RAIL ... 49
APTA STATISTICAL PUBLICATIONS ... 55
FACT BOOK METHODOLOGY ... 56
APTA AND THE FACT BOOK
5
APTA and the Fact Book
The American Public Transportation Association (APTA) is a nonprofit international association of 1,500 public and private sector organizations, engaged in the areas of bus, paratransit, light rail, commuter rail, subways, waterborne services, and intercity and high-speed passenger rail. This includes: transit systems; planning, design, construction, and finance firms; product and service providers; academic institutions; transit associations and state departments of transportation. APTA is the only association in North America that represents all modes of public transportation. APTA members serve the public interest by providing safe, efficient and economical transit services and products. More than 90 percent of the people using public transportation in the United States and Canada ride APTA member systems.
This is the 64th edition of the Public Transportation Fact Book (formerly the Transit Fact Book), which was first published in 1943. Available data are expanded by standard statistical methods to estimate U.S. national totals. All
data are for the U.S. only, except for the section on Canada. Data for Canada were provided by the Canadian Urban
Transit Association (CUTA). A Glossary of Terms, a History of The Fact Book, and a discussion of the methodology used to estimate Fact Book data may be found at the end of this report. The 63 previous editions of the Fact Book are available on-line at http://www.apta.com/resources/statistics/Pages/transitstats.aspx.
In addition to this book, there are two Appendices to the Fact Book available online at http://www.apta.com/ resources/statistics/Pages/transitstats.aspx. The Public Transportation Fact Book, Appendix A: Historical Tables reports data items for the entire time period that they have been reported in Fact Books and other statistical reports prepared by APTA and its predecessor organizations. Many data items are reported for every year beginning in the 1920s, and ridership is reported from 1907. The Public Transportation Fact Book, Appendix B: Transit Agency and Urbanized Area Operating Statistics presents six operating statistics for each transit agency in size order, totaled for all service modes operated by the agency and in size order for each individual mode. Data are also summed for urbanized areas, both all modes totaled and for individual modes.
Data in the Fact Book are reported for "modes of service." Modes of service in the Fact Book are the same as the modes of service used to report data in the Federal Transit Administration's National Transit Database (NTD).
Data in the Fact Book are statistical expansions of sample data and represent the total activity of all transit agencies. Base data are taken from the NTD. These data are supplemented by data from other sources including state departments of transportation and APTA surveys of APTA transit system members. Because NTD data are collected for "report years," Fact Book data are also calculated for report years. A report year is each transit agency's fiscal year that ends during a specified calendar year.
NATIONAL DATA SUMMARY
6
National Data Summary
Public transportation was provided in the United States during 2011 by 7,100 organizations ranging from large multi-modal systems to single-vehicle special demand response service providers. The number of transit agencies operating each mode of service ranges from a single cable car operator to approximately 6,600 demand response providers. Table 1 reports the number of transit agencies in the United States in three categories. The largest number of service providers are non-profit organizations that exclusively operate demand response service, primarily for senior citizens and persons with disabilities. Non-profit organizations are eligible for federal financial assistance for vehicle purchases and provide specialized service designed to meet the special needs of their clientele. These non-profit organizations provide service in both rural and urbanized areas.
The second largest number of transit agencies, 1,440, operate in rural areas and 825 transit agencies provide service in urbanized areas. Transit agencies in urbanized areas are much larger than those in rural areas. Transit agencies in urbanized areas carried over 98 percent of all transit passenger trips in 2011, those in rural areas carried about 1 and ½ percent of passenger trips, and non-profit senior citizen and persons with disabilities transit service providers carried less than one-half of one percent of all passenger trips. Exact proportions are not certain because many agencies headquartered in urbanized areas provide service outside of those areas and similarly many rural providers operate service into larger areas.
Table 1: Number of Public Transportation
Systems by Mode, Report Year 2011
ModeNumber of Systems, 2011 (a) Urbanized
Areas (b) Rural (b)
Non-Profit
Providers (c) Total
Aerial Tramway 2 0 0 2
Automated Guideway Transit 7 0 0 7
Bus 520 558 0 1,078
Bus Rapid Transit 5 0 0 5
Cable Car 1 0 0 1 Commuter Bus 37 55 0 92 Commuter Rail 27 0 0 27 Demand Response (b,d) 645 1,120 4,835 6,600 Ferryboat 34 4 0 38 Heavy Rail 15 0 0 15 Hybrid Rail 4 0 0 4 Inclined Plane 4 0 0 4 Light Rail 27 0 0 27 Monorail 2 0 0 2 Publico 1 0 0 1 Streetcar 7 0 0 7 Transit Vanpool 66 18 0 84 Trolleybus 5 0 0 5 Total (d,e) 825 1,440 4,835 7,100
(a) Systems operating during 2011, all amounts are estimated.
(b) Some urban providers operate service into surrounding rural areas and rural providers operate service into nearby urban areas.
(c) May be either urban or rural.
(d) Includes non-profit providers of service for seniors and persons with disabilities. (e) Total is not sum of all modes since many providers operate more than one mode.
NATIONAL DATA SUMMARY
7
Table 2: National Totals, Report Year 2011
Statistical Category All Roadway Modes (a) Modes (b) All Rail Ferryboat Total All Transit
Systems, Number of (c) 7,865 96 38 (c) 7,100
Trips, Unlinked Passenger (Millions) 5,596 4,642 80 10,319 Miles, Passenger (Millions) 24,503 31,160 416 56,077
Trip Length, Average (Miles) 4.4 6.7 5.2 5.4
Miles, Vehicle Total (Millions) 4,272.0 1,101.5 4.3 5,377.8 Miles, Vehicle Revenue (Millions) 3,721.0 1,052.8 4.2 4,778.0
Hours, Vehicle Total (Millions) 296.3 51.9 0.4 348.4
Hours, Vehicle Revenue (Millions) 264.6 48.3 0.4 313.4
Speed, Vehicle in Revenue Service, Average (mph) 14.1 21.8 9.6 15.2 Fares Collected, Passengers (Millions) 6,050.7 7,347.0 160.0 13,557.6
Fare per Unlinked Trip, Average $1.08 $1.58 $2.00 $1.31
Expense, Operating Total (Millions) 24,564.0 13,210.1 588.0 38,362.1 Operating Expense by Object Class:
Salaries and Wages (Millions) 8,673.9 5,451.0 206.3 14,331.2 Fringe Benefits (Millions) 6,104.7 4,412.3 80.2 10,597.3
Services (Millions) 1,437.8 1,061.5 45.2 2,544.5
Materials and Supplies (Millions) 3,071.2 1,136.0 156.9 4,364.0
Utilities (Millions) 276.2 1,002.2 6.6 1,285.0
Casualty and Liability (Millions) 648.0 331.3 27.5 1,006.7 Purchased Transportation (Millions) 115.3 -976.9 12.0 -849.6
Other (Millions) 4,237.0 792.7 53.3 5,083.0
Operating Expense by Function Class:
Vehicle Operations (Millions) 11,957.7 5,297.5 334.5 17,589.8
Vehicle Maintenance (Millions) 3,858.4 2,535.9 86.7 6,481.0
Non-vehicle Maintenance 868.5 2,630.6 35.2 3,534.2
General Administration (Millions) 3,642.4 1,953.4 78.3 5,674.1 Purchased Transportation (Millions) 4,237.0 792.7 53.3 5,083.0 Expense, Capital Total (Millions) 5,458.2 11,284.4 314.6 17,057.1 Facilities, Guideway, Stations, Administration Buildings 1,636.1 8,227.0 119.5 9,982.6
Rolling Stock (Millions) 3,137.0 1,515.2 173.4 4,825.6
Other (Millions) 685.1 1,542.1 21.7 2,249.0
Revenue Vehicles Available for Maximum Service 153,956 21,118 184 175,258 Revenue Vehicles Operated at Maximum Service 124,287 17,013 148 141,448
Employees, Operating 293,778 89,188 4,186 387,152
Employees, Vehicle Operations 211,869 34,925 3,046 249,840
Employees, Vehicle Maintenance 42,096 20,285 465 62,845
Employees, Non-Vehicle Maintenance 9,565 25,178 236 34,980 Employees, General Administration 30,249 8,800 439 39,487
Employees, Capital 2,265 8,380 135 10,779
Diesel Fuel Consumed (Gallons, Millions) 518.5 95.0 36.4 649.9 Other Fossil Fuel Consumed (Gallons, Millions) 366.2 1.3 0.4 367.9 Electricity Consumed (kWh, Millions) 62.1 6,523.6 0.0 6,585.7 (a) Bus, Bus Rapid Transit, Commuter Bus, Demand Response, Publico, Transit Vanpool, and Trolleybus.
(b) Commuter Rail, Heavy Rail, Hybrid Rail, Light Rail, Other Rail, and Streetcar.
(c) This statistical category only, "number of systems" counts each system multiple times for multiple "roadway modes" or "rail modes" but only once for "total all transit" regardless of the number of modes the system operates.
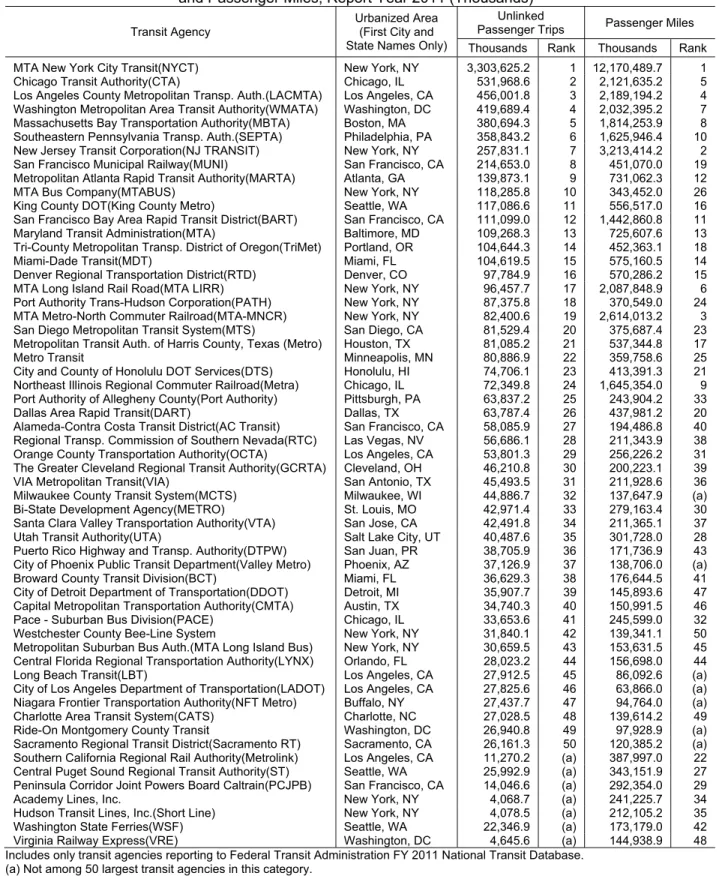
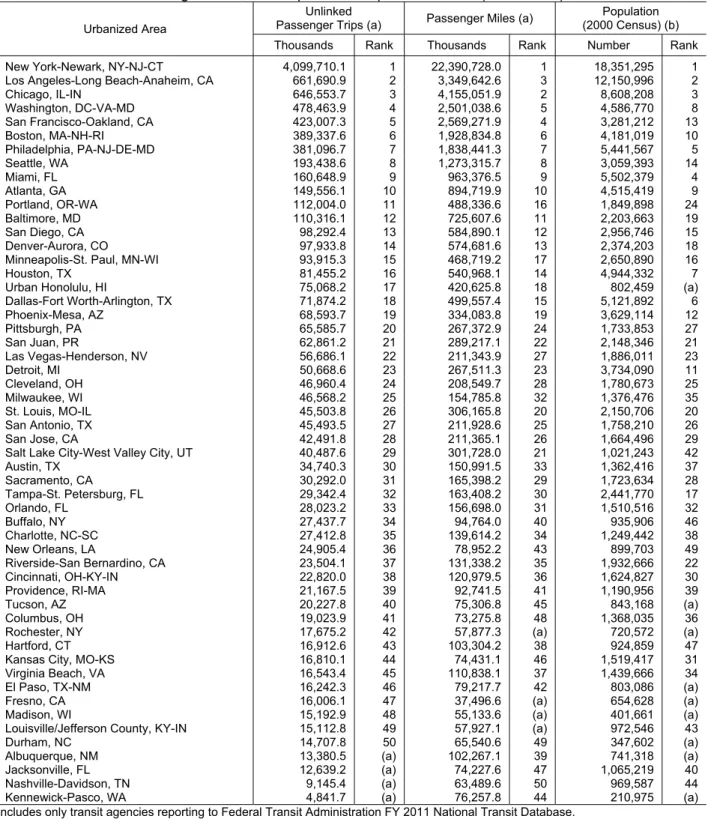
Public transportation agencies spent $55 billion for operation of service and capital investment in 2011. Passengers took 10.3 billion trips and rode transit vehicles for 56.1 billion miles. Summary data for the entire U.S. transit industry is shown on Table 2, and each data item on that table is shown in detail by mode in the tables later in this publication. Table 3 shows the 50 largest transit systems ranked in order of unlinked passenger trips. Table 4 shows the 50 urbanized areas with the most transit use ranked by unlinked passenger trips. The largest transit agency, MTA New York City Transit, carried passengers on 3.3 billion unlinked trips for 12.2 billion miles. The New York-Newark, NY-NJ-CT urbanized area was the site of the most transit use with all the transit agencies headquartered in the area carrying 4.1 billion unlinked passenger trips for 22.4 billion passenger miles.
NATIONAL DATA SUMMARY
8
Table 3: 50 Largest Transit Agencies Ranked by Unlinked Passenger Trips
and Passenger Miles, Report Year 2011 (Thousands)
Transit Agency
Urbanized Area (First City and State Names Only)
Unlinked
Passenger Trips Passenger Miles Thousands Rank Thousands Rank MTA New York City Transit(NYCT) New York, NY 3,303,625.2 1 12,170,489.7 1 Chicago Transit Authority(CTA) Chicago, IL 531,968.6 2 2,121,635.2 5 Los Angeles County Metropolitan Transp. Auth.(LACMTA) Los Angeles, CA 456,001.8 3 2,189,194.2 4 Washington Metropolitan Area Transit Authority(WMATA) Washington, DC 419,689.4 4 2,032,395.2 7 Massachusetts Bay Transportation Authority(MBTA) Boston, MA 380,694.3 5 1,814,253.9 8 Southeastern Pennsylvania Transp. Auth.(SEPTA) Philadelphia, PA 358,843.2 6 1,625,946.4 10 New Jersey Transit Corporation(NJ TRANSIT) New York, NY 257,831.1 7 3,213,414.2 2 San Francisco Municipal Railway(MUNI) San Francisco, CA 214,653.0 8 451,070.0 19 Metropolitan Atlanta Rapid Transit Authority(MARTA) Atlanta, GA 139,873.1 9 731,062.3 12 MTA Bus Company(MTABUS) New York, NY 118,285.8 10 343,452.0 26 King County DOT(King County Metro) Seattle, WA 117,086.6 11 556,517.0 16 San Francisco Bay Area Rapid Transit District(BART) San Francisco, CA 111,099.0 12 1,442,860.8 11 Maryland Transit Administration(MTA) Baltimore, MD 109,268.3 13 725,607.6 13 Tri-County Metropolitan Transp. District of Oregon(TriMet) Portland, OR 104,644.3 14 452,363.1 18 Miami-Dade Transit(MDT) Miami, FL 104,619.5 15 575,160.5 14 Denver Regional Transportation District(RTD) Denver, CO 97,784.9 16 570,286.2 15 MTA Long Island Rail Road(MTA LIRR) New York, NY 96,457.7 17 2,087,848.9 6 Port Authority Trans-Hudson Corporation(PATH) New York, NY 87,375.8 18 370,549.0 24 MTA Metro-North Commuter Railroad(MTA-MNCR) New York, NY 82,400.6 19 2,614,013.2 3 San Diego Metropolitan Transit System(MTS) San Diego, CA 81,529.4 20 375,687.4 23 Metropolitan Transit Auth. of Harris County, Texas (Metro) Houston, TX 81,085.2 21 537,344.8 17
Metro Transit Minneapolis, MN 80,886.9 22 359,758.6 25
City and County of Honolulu DOT Services(DTS) Honolulu, HI 74,706.1 23 413,391.3 21 Northeast Illinois Regional Commuter Railroad(Metra) Chicago, IL 72,349.8 24 1,645,354.0 9 Port Authority of Allegheny County(Port Authority) Pittsburgh, PA 63,837.2 25 243,904.2 33 Dallas Area Rapid Transit(DART) Dallas, TX 63,787.4 26 437,981.2 20 Alameda-Contra Costa Transit District(AC Transit) San Francisco, CA 58,085.9 27 194,486.8 40 Regional Transp. Commission of Southern Nevada(RTC) Las Vegas, NV 56,686.1 28 211,343.9 38 Orange County Transportation Authority(OCTA) Los Angeles, CA 53,801.3 29 256,226.2 31 The Greater Cleveland Regional Transit Authority(GCRTA) Cleveland, OH 46,210.8 30 200,223.1 39 VIA Metropolitan Transit(VIA) San Antonio, TX 45,493.5 31 211,928.6 36 Milwaukee County Transit System(MCTS) Milwaukee, WI 44,886.7 32 137,647.9 (a) Bi-State Development Agency(METRO) St. Louis, MO 42,971.4 33 279,163.4 30 Santa Clara Valley Transportation Authority(VTA) San Jose, CA 42,491.8 34 211,365.1 37 Utah Transit Authority(UTA) Salt Lake City, UT 40,487.6 35 301,728.0 28 Puerto Rico Highway and Transp. Authority(DTPW) San Juan, PR 38,705.9 36 171,736.9 43 City of Phoenix Public Transit Department(Valley Metro) Phoenix, AZ 37,126.9 37 138,706.0 (a) Broward County Transit Division(BCT) Miami, FL 36,629.3 38 176,644.5 41 City of Detroit Department of Transportation(DDOT) Detroit, MI 35,907.7 39 145,893.6 47 Capital Metropolitan Transportation Authority(CMTA) Austin, TX 34,740.3 40 150,991.5 46 Pace - Suburban Bus Division(PACE) Chicago, IL 33,653.6 41 245,599.0 32 Westchester County Bee-Line System New York, NY 31,840.1 42 139,341.1 50 Metropolitan Suburban Bus Auth.(MTA Long Island Bus) New York, NY 30,659.5 43 153,631.5 45 Central Florida Regional Transportation Authority(LYNX) Orlando, FL 28,023.2 44 156,698.0 44 Long Beach Transit(LBT) Los Angeles, CA 27,912.5 45 86,092.6 (a) City of Los Angeles Department of Transportation(LADOT) Los Angeles, CA 27,825.6 46 63,866.0 (a) Niagara Frontier Transportation Authority(NFT Metro) Buffalo, NY 27,437.7 47 94,764.0 (a) Charlotte Area Transit System(CATS) Charlotte, NC 27,028.5 48 139,614.2 49 Ride-On Montgomery County Transit Washington, DC 26,940.8 49 97,928.9 (a) Sacramento Regional Transit District(Sacramento RT) Sacramento, CA 26,161.3 50 120,385.2 (a) Southern California Regional Rail Authority(Metrolink) Los Angeles, CA 11,270.2 (a) 387,997.0 22 Central Puget Sound Regional Transit Authority(ST) Seattle, WA 25,992.9 (a) 343,151.9 27 Peninsula Corridor Joint Powers Board Caltrain(PCJPB) San Francisco, CA 14,046.6 (a) 292,354.0 29
Academy Lines, Inc. New York, NY 4,068.7 (a) 241,225.7 34
Hudson Transit Lines, Inc.(Short Line) New York, NY 4,078.5 (a) 212,105.2 35 Washington State Ferries(WSF) Seattle, WA 22,346.9 (a) 173,179.0 42 Virginia Railway Express(VRE) Washington, DC 4,645.6 (a) 144,938.9 48 Includes only transit agencies reporting to Federal Transit Administration FY 2011 National Transit Database.
(a) Not among 50 largest transit agencies in this category.
For complete size ranking lists of all transit agencies reporting to the Federal Transit Administration 2011 National Transit Database see the 2013 Public Transportation Fact Book, Appendix B: Transit Agency and Urbanized Area Operating Statistics at
NATIONAL DATA SUMMARY
9
Table 4: 50 Urbanized Areas with the Most Transit Travel, Ranked by Unlinked Passenger Trips,
Passenger Miles, and Population, Report Year 2011 (Thousands)
Urbanized Area
Unlinked
Passenger Trips (a) Passenger Miles (a)
Population (2000 Census) (b) Thousands Rank Thousands Rank Number Rank New York-Newark, NY-NJ-CT 4,099,710.1 1 22,390,728.0 1 18,351,295 1 Los Angeles-Long Beach-Anaheim, CA 661,690.9 2 3,349,642.6 3 12,150,996 2
Chicago, IL-IN 646,553.7 3 4,155,051.9 2 8,608,208 3 Washington, DC-VA-MD 478,463.9 4 2,501,038.6 5 4,586,770 8 San Francisco-Oakland, CA 423,007.3 5 2,569,271.9 4 3,281,212 13 Boston, MA-NH-RI 389,337.6 6 1,928,834.8 6 4,181,019 10 Philadelphia, PA-NJ-DE-MD 381,096.7 7 1,838,441.3 7 5,441,567 5 Seattle, WA 193,438.6 8 1,273,315.7 8 3,059,393 14 Miami, FL 160,648.9 9 963,376.5 9 5,502,379 4 Atlanta, GA 149,556.1 10 894,719.9 10 4,515,419 9 Portland, OR-WA 112,004.0 11 488,336.6 16 1,849,898 24 Baltimore, MD 110,316.1 12 725,607.6 11 2,203,663 19 San Diego, CA 98,292.4 13 584,890.1 12 2,956,746 15 Denver-Aurora, CO 97,933.8 14 574,681.6 13 2,374,203 18
Minneapolis-St. Paul, MN-WI 93,915.3 15 468,719.2 17 2,650,890 16
Houston, TX 81,455.2 16 540,968.1 14 4,944,332 7
Urban Honolulu, HI 75,068.2 17 420,625.8 18 802,459 (a)
Dallas-Fort Worth-Arlington, TX 71,874.2 18 499,557.4 15 5,121,892 6 Phoenix-Mesa, AZ 68,593.7 19 334,083.8 19 3,629,114 12 Pittsburgh, PA 65,585.7 20 267,372.9 24 1,733,853 27 San Juan, PR 62,861.2 21 289,217.1 22 2,148,346 21 Las Vegas-Henderson, NV 56,686.1 22 211,343.9 27 1,886,011 23 Detroit, MI 50,668.6 23 267,511.3 23 3,734,090 11 Cleveland, OH 46,960.4 24 208,549.7 28 1,780,673 25 Milwaukee, WI 46,568.2 25 154,785.8 32 1,376,476 35 St. Louis, MO-IL 45,503.8 26 306,165.8 20 2,150,706 20 San Antonio, TX 45,493.5 27 211,928.6 25 1,758,210 26 San Jose, CA 42,491.8 28 211,365.1 26 1,664,496 29
Salt Lake City-West Valley City, UT 40,487.6 29 301,728.0 21 1,021,243 42
Austin, TX 34,740.3 30 150,991.5 33 1,362,416 37 Sacramento, CA 30,292.0 31 165,398.2 29 1,723,634 28 Tampa-St. Petersburg, FL 29,342.4 32 163,408.2 30 2,441,770 17 Orlando, FL 28,023.2 33 156,698.0 31 1,510,516 32 Buffalo, NY 27,437.7 34 94,764.0 40 935,906 46 Charlotte, NC-SC 27,412.8 35 139,614.2 34 1,249,442 38 New Orleans, LA 24,905.4 36 78,952.2 43 899,703 49 Riverside-San Bernardino, CA 23,504.1 37 131,338.2 35 1,932,666 22 Cincinnati, OH-KY-IN 22,820.0 38 120,979.5 36 1,624,827 30 Providence, RI-MA 21,167.5 39 92,741.5 41 1,190,956 39 Tucson, AZ 20,227.8 40 75,306.8 45 843,168 (a) Columbus, OH 19,023.9 41 73,275.8 48 1,368,035 36
Rochester, NY 17,675.2 42 57,877.3 (a) 720,572 (a)
Hartford, CT 16,912.6 43 103,304.2 38 924,859 47
Kansas City, MO-KS 16,810.1 44 74,431.1 46 1,519,417 31
Virginia Beach, VA 16,543.4 45 110,838.1 37 1,439,666 34
El Paso, TX-NM 16,242.3 46 79,217.7 42 803,086 (a)
Fresno, CA 16,006.1 47 37,496.6 (a) 654,628 (a)
Madison, WI 15,192.9 48 55,133.6 (a) 401,661 (a)
Louisville/Jefferson County, KY-IN 15,112.8 49 57,927.1 (a) 972,546 43
Durham, NC 14,707.8 50 65,540.6 49 347,602 (a)
Albuquerque, NM 13,380.5 (a) 102,267.1 39 741,318 (a)
Jacksonville, FL 12,639.2 (a) 74,227.6 47 1,065,219 40
Nashville-Davidson, TN 9,145.4 (a) 63,489.6 50 969,587 44
Kennewick-Pasco, WA 4,841.7 (a) 76,257.8 44 210,975 (a)
Includes only transit agencies reporting to Federal Transit Administration FY 2011 National Transit Database.
(a) Summed from data reported by individual transit agencies in the Federal Transit Administration 2011 National Transit Database. Total amounts reported by each agency are included in the urbanized area in which that agency is headquartered regardless of the number of urbanized areas in which the agency operates transit service.
(b) Not among 50 largest areas in this category; only areas in the top 50 in unlinked trips and passenger miles are included For complete size ranking lists of all transit agencies reporting to the Federal Transit Administration 2011 National Transit Database see the 2013 Public Transportation Fact Book, Appendix B: Transit Agency and Urbanized Area Operating Statistics at
PASSENGER TRAVEL
10
Passenger Travel
Transit systems carried over 10 billion unlinked passenger trips and over 50 billion passenger miles for the sixth consecutive year in 2011. Unlinked passenger trips are the metric required for federal reporting in the National Transit Database and count a person each time they board a vehicle, whether they are starting their transit trip or transferring from another transit vehicle. Passenger miles measure how far all transit riders travelled in total. They both measure the consumption of transit service, but in different ways – passenger trips recognize each time a passenger boards or alights a transit vehicle during travel while passenger miles measure the total amount of travel.
Table 5: Unlinked Passenger Trips and Passenger Miles by Mode, Millions
Report Year 2011
Mode of Service Millions Percent Millions Percent Passenger Trips Passenger Miles
Bus 5,191 50.3% 20,408 36.4%
Bus Rapid Transit 6 0.1% 23 < 0.1%
Commuter Bus 37 0.4% 984 1.8% Commuter Rail 466 4.5% 11,427 20.4% Demand Response 191 1.9% 1,580 2.8% Ferryboat 80 0.8% 416 0.7% Heavy Rail 3,647 35.3% 17,317 30.9% Hybrid Rail 6 0.1% 70 0.1% Light Rail 436 4.2% 2,203 3.9%
Other Rail Modes (a) 44 0.4% 47 0.1%
Publico 39 0.4% 172 0.3%
Streetcar 43 0.4% 96 0.2%
Transit Vanpool 34 0.3% 1,176 2.1%
Trolleybus 98 0.9% 160 0.3%
Total All Modes 10,319 100.0% 56,077 100.0%
(a) Aerial tramway, automated guideway transit, cable car, inclined plane, and monorail.
Unlinked Passenger Trips by Mode data from 1902 through 2011 can be found in the 2013 Public Transportation Fact Book,
Appendix A: Historical Tables at www.apta.com.
Passenger trips can be measured in two ways called linked trips and unlinked trips. Linked trips are an entire journey from its origin, for instance at home in the morning, to the destination which may be school or work or some other place. If a traveler transfers and takes another transit vehicle such as two buses or rides a bus and then transfers to a heavy rail train, it is still only one linked trip. The other way to measure trips is unlinked trips where a new trip is counted each time you get on a transit vehicle. If a rider takes a bus and then transfers to a train to reach a destination, the rider takes only one linked trip but takes two unlinked trips, one on the bus and one on the train. The federal government, through the National Transit Database (NTD), requires transit agencies to report their ridership measured in unlinked passenger trips. There are several reasons for this. Primarily it is because transit agencies cannot always tell if a passenger is starting a trip or transferring. If a passenger has a pass and simply shows it to the driver, there is no exact record if that passenger is starting a trip or transferring. The NTD, however, deals in exact numbers. The NTD also collects data for each transit mode to better measure the performance of each mode. If a linked trip was on more than one mode, as in the example of a person transferring from a bus to a train, the trips would need to be assigned to one of the modes and would distort the measurement of each mode's performance. Since the early 1970s, public transportation has shown a long-term growth in ridership. Since 1971, as shown in Figure 1, overall transit ridership has grown more than 50 percent. The rate of growth differs significantly among modes of service. Bus ridership has grown 11 percent over that time period while heavy rail and light rail ridership have each more than doubled. Demand response service was barely existent at that time and commuter rail was not measured as transit service, so both have grown by non-measurable amounts.
PASSENGER TRAVEL
11
Since 1995, transit ridership has grown by nearly 3 billion trips. Reasons for this increase include continued and constant investment in public transportation as well as renewed interest in central city living. Continued investment in public transportation has meant better service across the country and the construction of new services in many cities. Cities like Washington, DC are pursuing development opportunities around rail stations to create transit-oriented environments, revitalizing parts of the city that were previously underdeveloped. Cities like Los Angeles and Denver are adding new lines to their rail networks, making high-quality transit available to more people. Other cities like Dallas, Salt Lake City, Phoenix, and Charlotte have built new rail systems from the ground up, dramatically increasing their ridership.
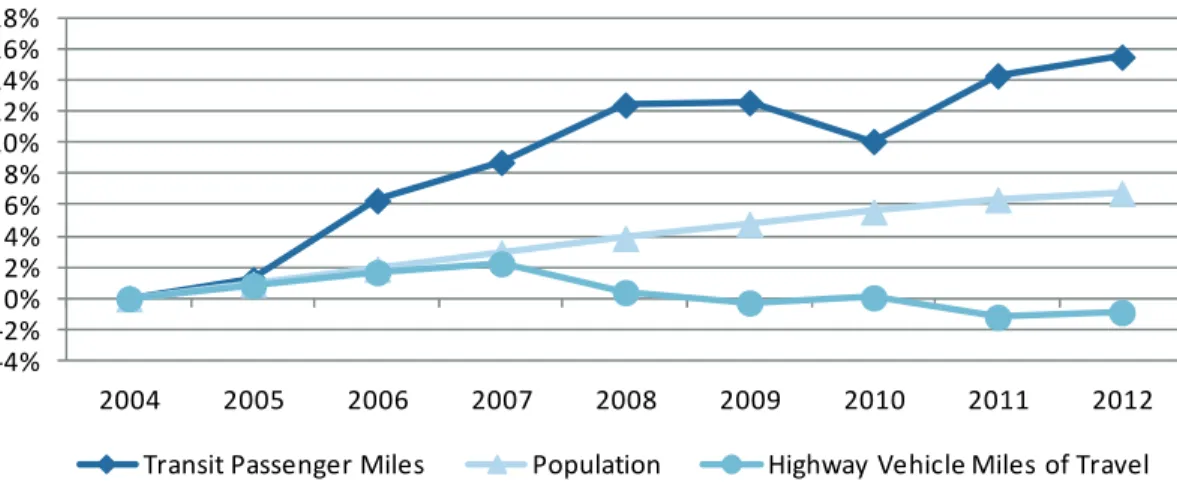
Figure 2 compares transit ridership growth in the short-term to other measures. Over the eight years since 2004, transit passenger miles of travel have increased 15 percent and population the has grown 7 percent, while highway travel has stopped growing.
Sources: Transit Passenger Miles from APTA Public Transportation Fact Book for 2004 through 2011 and estimated from APTA Public Transportation Ridership Report unlinked trip data for 2012, Population from U.S. Census Bureau, Highway Vehicle Miles of Travel from Federal Highway Administration Travel Volume Trends.
0 1 2 3 4 5 6 7 8 9 10 11 1971 1981 1991 2001 2011 Un lin ke d Pa sse ng er Tr ip s (B illio ns )
Figure 1: Transit Ridership Is At Highest Level in Five Decades
Bus Heavy Rail All Other
‐4% ‐2% 0% 2% 4% 6% 8% 10% 12% 14% 16% 18% 2004 2005 2006 2007 2008 2009 2010 2011 2012
Figure 2: Since 2004 Transit Use Has Grown More Than Population or Highway Travel
PASSENGER TRAVEL/SERVICE PROVIDED
12
The average length of a trip on each transit mode varies. The average commuter rail trip is 24.5 miles, longest of theall transit modes shown on Figure 3; while the average trip on a trolleybus is 1.6 miles, shortest of all transit modes. Transit vanpool has the longest average trip length at 34.6 miles. Trip length is a factor in both trip costs and speed. A longer trip means that a smaller portion of each passengers trip time is spent boarding and alighting from the transit vehicle, reducing the portion of costs and trip time for those activities.
Service Provided
In 2011, transit systems in the United States provided 4.8 billion vehicle revenue miles of service; operating transit vehicles for 313 million hours of revenue service. The fastest service was provided by transit vanpool and commuter rail service, which carry passengers on long trips. Heavy rail, because of a right-of-way separate from other traffic, offers service for higher density urban areas. Modes operating entirely in traffic on city streets are slower. Bus service, which operates in suburbs as well as central cities averages 12.7 miles per hour and trolleybus service, which operates primarily in central cities has an average speed of 7.1 miles per hour. Other modes operate at lower speeds in denser areas with more frequent stop services.
Table 6: Vehicle Miles Operated, Vehicle Hours Operated, and Speed in Transit Service
by Mode, Report Year 2011
Mode Total Vehicle Miles (Millions) Vehicle Revenue Miles (Millions) Total Vehicle Hours (Millions) Vehicle Revenue Hours (Millions) Average Speed in Revenue Service (Miles per Hour)
Bus 2,339.2 2,030.5 176.9 159.8 12.7
Bus Rapid Transit 2.1 1.9 0.2 0.1 12.7
Commuter Bus 72.2 50.8 2.8 2.0 25.6 Commuter Rail 345.2 316.9 10.9 9.7 32.7 Demand Response 1,611.8 1,393.9 106.4 92.9 15.0 Ferryboat 4.3 4.2 0.4 0.4 9.6 Heavy Rail 654.9 636.3 33.9 31.7 20.0 Hybrid Rail 2.1 2.1 0.1 0.1 23.6 Light Rail 89.2 87.5 5.8 5.6 15.6
Other Rail Modes (a) 5.0 5.0 0.6 0.6 8.1
Publico 40.2 37.8 3.4 3.2 11.9
Streetcar 5.1 5.0 0.6 0.6 8.2
Transit Vanpool 195.0 195.0 5.0 5.0 39.3
Trolleybus 11.6 11.2 1.6 1.6 7.1
Total 5,377.8 4,778.0 348.4 313.4 15.2
(a) Aerial tramway, automated guideway transit, cable car, inclined plane, and monorail.
Vehicle mile data by mode from 1926 through 2011; vehicle hour data by mode from 1996 through 2011; and average speed data by mode from 1996 through 2011 can be found in the 2013 Public Transportation Fact Book, Appendix A: Historical Tables at www.apta.com. 0 5 10 15 20 25 30
All Bus Commuter and Hybrid
Rail
Demand Response
Heavy Rail Light Rail and Streetcar
Trolleybus Average All Modes A vera g e Trip le ngth, Mile s
MODAL SHARES OF SERVICE PROVIDED AND CONSUMED
13
Modal Shares of Service Provided and Consumed
The shares of service provided and service consumed among transit modes vary substantially. The size and capacity of transit vehicles varies from ferryboats carrying over 1,000 passengers down to demand response vehicles which often carry only one or two passengers. The distance passengers are carried by different modes is also a function of speed. Transit vanpools and commuter rail vehicles average over 30 miles per hours while ferryboats and trolley buses operate at less than 10 miles per hour.
Figures 4 through 7 compare the portions of all public transportation service provided and consumed by groups of similar modes. Over one-half of vehicle revenue hours operated are provided by buses, which carry over one-half of all passengers. Because bus passengers take shorter trips and buses operate at lower speeds compared to other modes, they carry less than two-fifths of all passenger miles traveled. Conversely, rail vehicles provide only 15 percent of vehicle revenue hours of service but due to longer and higher speed trips carry 56 percent of all passenger miles traveled on transit.
Bus, 43.6% Demand Response, 29.2% Rail, 22.0% Other, 5.2%
Figure 4: Vehicle Revenue Miles
Bus, 50.7% Demand
Response,
1.9% Rail, 45.0%
Other, 2.4%
Figure 6: Unlinked Passenger Trips
Bus, 51.7% Demand Response, 29.7% Rail, 15.4% Other, 3.3%
Figure 5: Vehicle Revenue Hours
Bus, 38.2% Demand
Response,
2.8% Rail, 55.6%
Other, 3.4%
CUSTOMER INFORMATION SYSTEMS
14
Customer Information Systems
Transit agencies are developing new technologies to provide customers with information about transit service. A June 2013 survey by the Pew Internet and American Life Project found that over 50 percent of Americans now own smartphones, and APTA-commissioned research shows that 65 percent of millenials have smartphones; clearly more and more transit riders want to have transit information readily available. Real-time data provides transit with a sense of spontaneity and freedom like that once associated with automobiles.
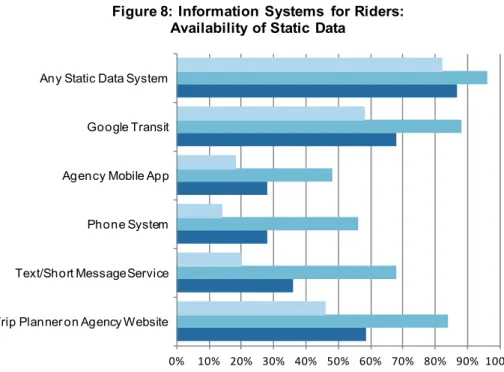
Transit agencies are providing both schedule and real-time data to customers through a variety of platforms as reported on Figure 8. These different platforms help transit riders with access to all different types of technology get the information they need every day.
More than 85 percent of agencies are providing their static data (schedules/routes/fares) to customers in some electronic manner. Sixty-eight percent of agencies responding to APTA provide data for Google Transit directions, and nearly 60 percent have a trip planner on their website. Around one-third of those respondents provide this information via text message, and around 28 percent have an automated phone system or a mobile app created by their agency.
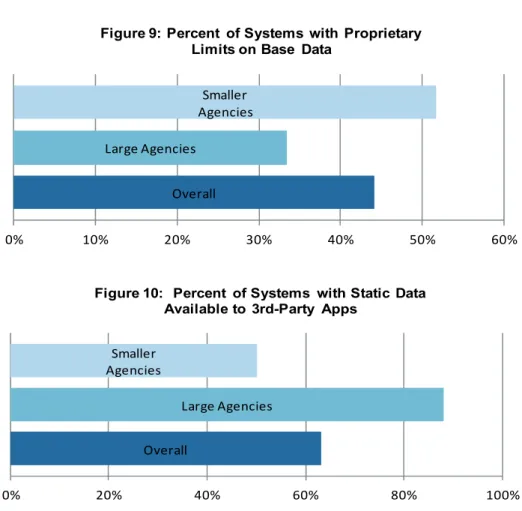
As expected, smaller agencies (those with fewer than 25 million annual unlinked trips) are less likely to provide these services to customers, but 58 percent participate in Google Transit, and over 80 percent of these smaller agencies provide one of these services to customers. Eighty-eight percent of large agencies participate in Google Transit. Transit agencies often contract with outside vendors who have the experience in setting up and maintaining the IT systems for providing data to customers. Smaller agencies are more likely to have limits placed on their use of the data for these products as shown on Figure 9.
Overall, as reported on Figure 10, nearly two-thirds of agencies said that they make their static data available to third-party apps. Large agencies were more likely to encourage third-third-party activities – 88 percent of those agencies make their data available. Making data available to third-party apps helps transit riders have a wide variety of tools on different platforms that they can use to access transit agency service information.
0% 10% 20% 30% 40% 50% 60% 70% 80% 90% 100% Trip Planner on Agency Website
Text/Short Message Service Phone System Agency Mobile App Google Transit Any Static Data System
Figure 8: Information Systems for Riders: Availability of Static Data
CUSTOMER INFORMATION SYSTEMS
15
Over half of all the transit agencies surveyed provide arrival times to customers. Over two-thirds (68%) of large agencies provide arrival times in some format. A large portion of transit agencies is now using their AVL systems for new applications like providing real-time information to their customers.
Across the board, large agencies were more likely to provide customer facing arrival times as indicated above, but there are interesting gaps indicated below. Figure 11 shows that large agencies are more likely to provide arrival times across all formats, and especially hold an edge in participating in Google Transit real-time arrival information. Providing a wide variety of ways to access arrival times helps to serve the entire spectrum of transit customers.
Overall Large Agencies
Smaller
Agencies
0% 10% 20% 30% 40% 50% 60%
Figure 9: Percent of Systems with Proprietary Limits on Base Data
Overall
Large Agencies Smaller
Agencies
0% 20% 40% 60% 80% 100%
Figure 10: Percent of Systems with Static Data Available to 3rd-Party Apps
0% 10% 20% 30% 40% 50% 60%
Agency Website Third‐Party Provider Website
Text/SMS Phone System Agency App Google Transit Real‐Time Figure 11: Percent of Systems with Arrival Time Formats
VEHICLES
16
Vehicles
U.S. transit systems operated 141,448 railcars, buses, and vans in a typical peak period during 2011, out of a total of 175,258 vehicles available for service. Bus service has the largest fleet of vehicles, with 67,288 vehicles available for peak service, while demand response service vehicles are a close second, with 65,336 vehicles available for peak service. The heavy rail fleet of 11,342 vehicles is the largest rail vehicle fleet. Table 7 provides information on the number of public transportation vehicles.
Table 7: Revenue Vehicles by Mode
Report Year 2011
Mode Vehicles Available for Maximum Service Vehicles Used in Maximum Period Service
Number Percent Number Percent
Bus 67,288 38.4% 53,805 38.0%
Bus Rapid Transit 80 < 0.1% 59 < 0.1%
Commuter Bus 1,807 1.0% 1,400 1.0% Commuter Rail 7,193 4.1% 6,198 4.4% Demand Response 65,336 37.3% 53,648 37.9% Ferryboat 184 0.1% 148 0.1% Heavy Rail 11,342 6.5% 9,089 6.4% Hybrid Rail 44 < 0.1% 29 < 0.1% Light Rail 1,986 1.1% 1,338 0.9%
Other Rail Modes (a) 282 0.2% 185 0.1%
Publico 5,624 3.2% 3,259 2.3%
Streetcar 271 0.2% 174 0.1%
Transit Vanpool 13,342 7.6% 11,713 8.3%
Trolleybus 479 0.3% 403 0.3%
Total 175,258 100.0% 141,448 100.0%
Revenue vehicles by mode data from 1926 through 2011 can be found in the 2013 Public Transportation Fact Book, Appendix A: Historical Tables at www.apta.com.
The Federal Transit Administration establishes a minimum useful life that a vehicle must exceed before federal financial assistance can be used to replace the vehicle. As reported on Table 8, a large portion of transit vehicles exceed that age. Many transit vehicles, however, have been rehabilitated, which not only extends their useful lives and reduces their maintenance costs, but also extends the age at which they may be replaced.
Table 8: Vehicle Characteristics by Mode
As of January 2011
Mode Average Age
Percent with Alternative Power (a) Minimum Useful Life (b) Percent Accessible (c) Percent Rehabili-tated During Lifetime Average Length (Feet)
Bus, All Modes 8.0 35.6% 12 99.8% 5.0% 40.4
Commuter and Hybrid Rail Cars 18.2 (d) 99.8% 25 85.1% 34.1% 85.0
Commuter Rail Locomotives 20.4 11.8% 25 1.9% 43.1% 62.5
Demand Response 4.1 7.7% 4 89.2% 0.5% 21.8
Ferryboat 18.8 45.5% 25 100.0% 4.3% 165.4
Heavy Rail 20.2 100.0% 25 98.7% 27.7% 61.7
Light Rail and Streetcar 16.6 98.4% 25 88.2% 28.4% 81.7
Other Rail Modes 57.4 58.4% 25 59.4% 7.5% 35.7
Transit Vanpool 4.3 2.8% 4 5.5% 0.0% 17.5
Trolleybus 9.9 100.0% 15 100.0% 9.4% 44.9
All Modes --- 39.9% --- 90.5% --- ---
Based on a sample from annual APTA Public Transportation Vehicle Database.
(a) Alternative-powered is defined as vehicles powered by anything other than diesel or gasoline, but including particulate-trap-equipped buses.
(b) Federal requirement for "Minimum Useful Life" in FTA C 9300.1B Capital Investment Program Guidance and Application Instruction, at www.fta.dot.gov.
(c) Accessible by lift, ramp, or station infrastructure. (d) Self-propelled cars only
Vehicle Characteristics data by mode from 1990 through 2011 can be found in the 2013 Public Transportation Fact Book, Appendix A: Historical Tables at www.apta.com.
VEHICLES
17
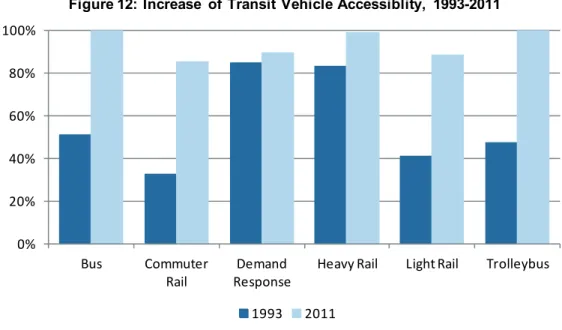
As shown on Figure 12, the transit vehicle fleet has reached near total accessibility to persons using wheelchairs and persons with other travel disabilities. From 1995 to 2011, the percentage of buses that are accessible increased from 60 percent to 99 percent. Over the same period, the accessible portion of the commuter rail fleet went from 43 percent to 85 percent, the light rail fleet from 49 percent to 88 percent, the heavy rail fleet from 83 percent to 99 percent, and the trolleybus fleet from 47 percent to 100 percent. The accessible portion of the demand response fleet, where specific vehicles can be assigned to trips to meet a passenger's individual needs, increased from 84 percent of vehicles accessible to 89 percent.
Table 9: Vehicle Equipment by Mode
as of January 2011
Type of Equipment Bus, All Modes Commuter and Hybrid Rail Heavy Rail Light Rail and Streetcar Ferryboat
Two-Way Radio 95.0% 56.2% 81.5% 96.3% 82.6%
Public Address System 91.0% 95.9% 99.2% 95.1% 82.6%
Automated Stop Announcement 53.0% 30.3% 55.1% 73.3% NA
Automatic Passenger Counter 33.8% 1.5% NA 21.3% 8.7%
Passenger-Operator Intercom 3.8% 22.9% 71.2% 56.6% 0.0%
Security or CCTV Type Camera 55.5% 2.3% 6.7% 45.2% 56.5%
Exterior Bicycle Rack 74.2% NA NA 42.3% 21.7%
Automatic Vehicle Location or GPS 64.2% 27.1% 2.9% 64.5% 17.4%
Traffic Light Preemption 6.7% NA NA 23.5% NA
Restroom 0.2% 51.0% NA NA 73.9%
Wi-Fi 1.4% 6.8% 1.4% 0.0% 13.0%
Electrical Outlets 1.7% 19.6% 0.0% 8.0% 52.2%
NA = Not Applicable
Based on a sample from annual APTA Public Transportation Vehicle Database.
Vehicle amenities data by mode from 2001 through 2011 can be found in the 2013 Public Transportation Fact Book, Appendix A: Historical Tables at www.apta.com.
Communications between transit vehicle operators and their central control and between transit vehicle operators and their passengers, is a primary purpose of many types of equipment bring added to transit vehicles. Two-way radios and automatic vehicle location equipment allow transit agencies to know where vehicles are and operate them in an efficient manner and provide real time information to passengers waiting for vehicles at stops and stations. Public address systems, automated stop announcements, passenger-operator intercoms and closed circuit cameras keep passengers informed and increase the safety and security of their transit trip.
0% 20% 40% 60% 80% 100% Bus Commuter Rail Demand Response
Heavy Rail Light Rail Trolleybus
Figure 12: Increase of Transit Vehicle Accessiblity, 1993-2011
VEHICLES
18
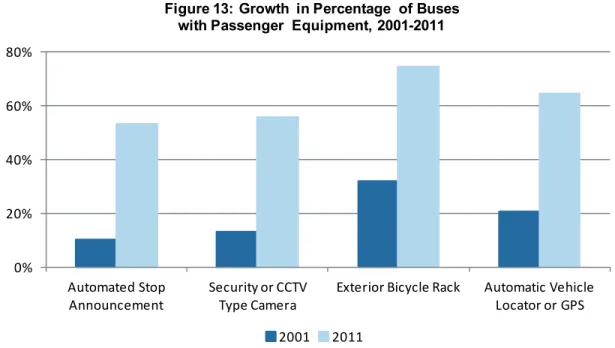
The increase in the percentage of buses with equipment for providing customer amenities shows a dramatic effort has been made by the transit industry to make travel safer and easier and improve the efficiency of operation. Increased security is demonstrated by the increase in buses equipped with closed circuit security cameras from 13 percent to 53 percent between 2001 and 2011. As shown on Figure 13, enhanced amenities to improve passengers' trips include an increase in buses equipped with automated stop announcements from 10 percent to 53 percent in 10 years and buses with exterior bicycle racks from 32 percent to 74 percent. Efficiency is enhanced by the growth of automatic vehicle location systems, which improve the operation of bus fleets as well as improve the availability of information on bus arrival times, from 21 percent of the bus fleet to 64 percent. Further use of technology can help better deploy transit vehicles, manage congestion, and enhance system performance.
Transit vehicles use a variety of fuels. Several modes, heavy rail, light rail, and trolleybus are nearly all electrically powered. However, road modes such as bus and demand response use several fuels. Over 95 percent of buses were diesel powered as recently as 1995 but that percentage has declined as more environmentally friendly natural gas and hybrid buses have been introduced into the transit fleet. Table 10 reports the percentage of vehicles powered by different fuels at the beginning of 2011.
Table 10: Vehicle Power Sources by Mode
Percent of Vehicles as of January 2011
Mode Electricity Diesel Fuel Electric and Other(Hybrid)
Gasoline CNG, LNG, and Blends Other Total
Bus 0.1% 63.5% 8.8% 0.8% 18.6% 8.2% 100.0%
Commuter Rail Self-
Propelled Cars 99.4% 0.6% --- --- --- --- 100.0%
Commuter Rail
Locomotives 11.6% 88.4% --- --- --- --- 100.0%
Demand Response --- 49.3% 0.1% 43.0% 1.9% 5.7% 100.0%
Ferryboat --- 54.5% 45.5% --- --- --- 100.0%
Heavy Rail 100.0% --- --- --- --- (a) >0.0% 100.0%
Light Rail 98.4% 1.6% --- --- --- --- 100.0%
Other Rail Modes 58.4% --- --- --- --- (a) 41.6% 100.0%
Transit Vanpool --- 3.1% 0.3% 93.8% 0.1% 2.7% 100.0%
Trolleybus 93.7% --- --- --- --- (b) 6.3% 100.0%
(a) Unpowered vehicles.
(b) Overhead wire electric with diesel for off-wire operation.
Based on a sample from annual APTA Public Transportation Vehicle Database.
Vehicle Power Sources data by mode from 1996 through 2011 can be found in the 2013 Public Transportation Fact Book, Appendix
A: Historical Tables at www.apta.com.
0% 20% 40% 60% 80% Automated Stop Announcement Security or CCTV Type Camera
Exterior Bicycle Rack Automatic Vehicle
Locator or GPS
Figure 13: Growth in Percentage of Buses with Passenger Equipment, 2001-2011
INFRASTRUCTURE
19
Infrastructure
Rail transit systems own track and rights-of-way, stations, administrative buildings, and maintenance facilities. Bus systems have some dedicated roadways and also have passenger stations and stops, maintenance facilities, parking lots, and administrative buildings. Table 11 reports the miles of track owned and operated by rail systems and the directional route miles over which rail cars are operated. Directional route miles are a National Transit Database metric that counts all the right-of-way rail vehicles operate over. If they operate in one direction the right-of way is counted as one mile for each physical mile; if vehicles operate in both directions the right-of-way is counted as 2 miles, but the number of "routes" in the normal sense of trains going to different destinations does not affect the count of directional route miles.
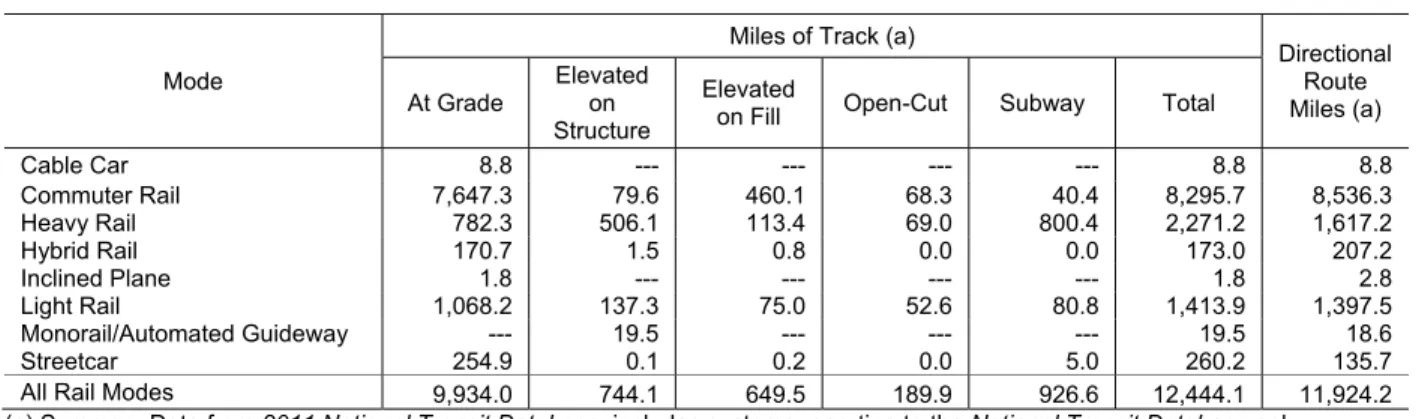
Commuter railroads have the most route mileage, while heavy rail and light rail have nearly the same route mileage. The largest portion of commuter rail and light rail mileage is at grade level while a large amount of heavy rail mileage is elevated or in subways. Nearly all heavy rail at grade mileage is separated from road and pedestrian traffic.
Table 11: Rail Track Miles and Directional Route Miles, Report Year 2011 (a)
Mode
Miles of Track (a)
Directional Route Miles (a) At Grade Elevated on Structure Elevated
on Fill Open-Cut Subway Total
Cable Car 8.8 --- --- --- --- 8.8 8.8 Commuter Rail 7,647.3 79.6 460.1 68.3 40.4 8,295.7 8,536.3 Heavy Rail 782.3 506.1 113.4 69.0 800.4 2,271.2 1,617.2 Hybrid Rail 170.7 1.5 0.8 0.0 0.0 173.0 207.2 Inclined Plane 1.8 --- --- --- --- 1.8 2.8 Light Rail 1,068.2 137.3 75.0 52.6 80.8 1,413.9 1,397.5 Monorail/Automated Guideway --- 19.5 --- --- --- 19.5 18.6 Streetcar 254.9 0.1 0.2 0.0 5.0 260.2 135.7
All Rail Modes 9,934.0 744.1 649.5 189.9 926.6 12,444.1 11,924.2 (a) Summary Data from 2011 National Transit Database; includes systems reporting to the National Transit Database only.
Rail Track Miles and Directional Route Miles data by mode from 2002 through 2011 can be found in the 2013 Public Transportation Fact Book, Appendix A: Historical Tables at www.apta.com.
Although most bus service is operated in mixed service on roads and streets, bus service is also operated over nearly 5,000 miles of exclusive and controlled right-of-way directional route miles, over 40 percent of the amount of rail directional route miles. Bus and ferryboat lane and directional route miles are reported on Table 12.
Table 12: Bus and Ferryboat Lane Miles and Directional Route Miles, Report Year 2011 (a)
Lane Miles (a) Directional Route Miles (a) ExclusiveRight-of-Way Right-of-Way Controlled Right-of-Way Exclusive Right-of-Way Controlled Traffic Mixed
Bus 1,110.8 1,071.5 1,177.9 1,046.5 158,940.1
Bus Rapid Transit 12.0 1.2 12.0 1.2 70.3
Commuter Bus 455.9 174.2 474.5 159.4 10,087.4
Ferryboat 0.0 0.0 675.0 0.0 0.0
Trolleybus 128.1 0.0 4.5 0.0 451.4
Total Non-Rail Modes 2,206.1 2,229.3 2,882.0 2,149.5 227,015.7
(a) Summary Data from 2011 National Transit Database; includes systems reporting to the National Transit Database only. Bus and Ferryboat Lane Miles and Directional Route Miles data by mode from 2002 through 2011 can be found in the 2013 Public Transportation Fact Book, Appendix A: Historical Tables at www.apta.com.
INFRASTRUCTURE
20
Approximately one-third of the 4,680 passenger stations in urbanized areas are multi-modal. As shown on Table 13, there are over 1,000 stations for each of three modes: bus, commuter rail, and heavy rail. Using directional route mile data to estimate total rights-of-way distances, ferryboat stations are on average 4.2 miles apart, commuter rail stations 3.5 miles, and heavy rail stations 0.9 mile. Other modes also have street stops for which data are not available.
Table 13: Passenger Stations by Mode, Report Year 2011 (a)
Mode Number of Stations Number of Escalators Number of Elevators Total Accessible ADA Multimodal
Bus 1,247 1,239 308 155 348
Bus Rapid Transit 54 54 2 5 2
Commuter Bus 71 71 18 82 51 Commuter Rail 1,229 812 569 178 455 Ferryboat 87 82 14 7 13 Heavy Rail 1,041 530 232 1,785 1,193 Hybrid Rail 49 49 42 0 1 Inclined Plane 8 7 0 0 2 Light Rail 761 691 290 197 332 Monorail/Automated Guideway 43 42 3 51 39
Street Car Rail 85 41 7 1 4
Trolleybus 5 5 1 0 0
Total 4,680 3,623 1,486 2,461 2,440
(a) Summary Data from 2011 National Transit Database; includes systems reporting to the National Transit Database only. Passenger Stations data by mode from 2002 through 2011 can be found in the 2013 Public Transportation Fact Book, Appendix A: Historical Tables at www.apta.com.
Dependability is a basic characteristic of quality transit service. Table 14 reports that transit agencies in urbanized areas operate over 1,600 maintenance facilities to ensure their vehicles are ready to provide service.
Table 14: Maintenance Facilities by Mode, Report Year 2011 (a)
Mode
Number of Maintenance Facilities (a) General Purpose Maintenance Facilities
Heavy Maintenance Facilities Total Maintenance Facilities Under 200
Vehicles 200 to 300 Vehicles Over 300 Vehicles
Total General Facilities
Bus 680.3 94.8 17.4 792.5 30.6 823.1
Bus Rapid Transit 2.3 0.1 0.0 2.4 0.0 2.4
Cable Car 1.0 0.0 0.0 1.0 0.0 1.0 Commuter Bus 31.1 2.1 0.0 33.2 0.0 33.2 Commuter Rail 59.0 7.0 7.0 73.0 15.9 88.9 Demand Response 469.5 14.0 5.4 488.9 2.4 491.3 Ferryboat 15.0 0.0 0.0 15.0 1.0 16.0 Heavy Rail 28.6 8.0 12.0 48.6 11.3 59.9 Hybrid Rail 6.0 0.0 0.0 6.0 1.0 7.0 Light Rail 33.4 1.0 0.0 34.4 4.3 38.7 Monorail/Automated Guideway 4.0 0.0 0.0 4.0 0.0 4.0
Street Car Rail 9.3 0.0 0.0 9.3 1.5 10.8
Transit Vanpool 20.3 0.0 2.2 22.5 0.0 22.5
Trolleybus 4.0 1.0 0.0 5.0 0.0 5.0
Total 1,363.8 128.0 44.0 1,535.8 68.0 1,603.8
(a) Summary Data from 2011 National Transit Database; includes systems reporting to the National Transit Database only. Maintenance Facilities data by mode from 2002 through 2011 can be found in the 2013 Public Transportation Fact Book, Appendix A: Historical Tables at www.apta.com.
INFRASTRUCTURE/PARKING
21
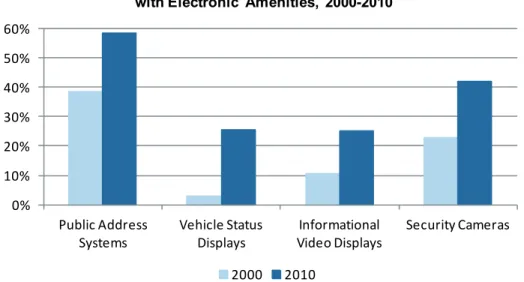
Figure 14 depicts the increased prevalence of electronic devices in passenger stations for better passenger information and improved passenger safety. Communication of passenger information improved between 2000 and 2010 as the portion of stations with public address systems grew from 38 percent to 58 percent, the portion of stations with vehicle status displays grew from 3 percent to 25 percent, and the portion of stations with informational video displays grew from 11 percent to 25 percent. Passenger safety has improved with 42 percent of stations having security cameras in 2010 compared to 23 percent in 2000. The percentages of stations with these amenities by mode are shown on Table 15.
Table 15: Passenger Station Equipment by Mode as of January 1, 2010 (a)
Mode
Number Stations in
Sample
Percent of Stations with: Public Address Systems Vehicle Status Displays Informa-tional Video Displays Security Cameras Conces-sions Restrooms Bus 977 13.3% 15.3% 8.2% 35.3% 12.2% 27.3% Ferry 55 45.5% 0.0% 1.8% 52.7% 18.2% 65.5%
All Rail Modes 2,666 76.0% 29.7% 32.0% 44.1% 26.6% 27.9%
Total 3,698 58.3% 25.4% 25.3% 41.9% 22.7% 28.3%
(a) Based on a sample from annual APTA Public Transportation Infrastructure Database. Includes data only for transit agencies included in that database.
Passenger Station Equipment data by mode from 2000 through 2010 can be found in the 2013 Public Transportation Fact Book, Appendix A: Historical Tables at www.apta.com.
Passenger Station Parking
Parking facilities are important to provide access to transit stations. Nearly 30 percent of rail passengers drive to rail stations and an additional 10 percent of them arrive at stations as passengers in private vehicles. To accommodate drivers, transit agencies provide parking at their stations. Nearly 850,000 all day spaces offer commuter parking at transit stations and an additional 17,770 spaces offer short-term parking for quicker trips. Nearly 35,000 spaces in racks or storage facilities are also provided for bicycles. Table 16 reports the number of these types of parking spaces by mode. 0% 10% 20% 30% 40% 50% 60% Public Address Systems Vehicle Status Displays Informational Video Displays Security Cameras
Figure 14: Growth in Percentage of Passenger Stations with Electronic Amenities, 2000-2010
PARKING/EMPLOYEES
22
Table 16: Passenger Station Parking Supply by Mode as of January 1, 2010 (a)
Mode
Number of Parking Spaces in Sample (a) Number of Stations in Sample Number All-Day Auto Parking Spaces Number Part-Day Auto Parking Spaces Number of Bicycle Spaces Number of Motorcycle Spaces Bus 977 252,136 10,623 10,733 426 Ferry 55 8,200 1,964 183 7
All Rail Modes 2,666 587,238 5,183 23,784 806
Total 3,698 847,574 17,770 34,700 1,239
(a) Based on a sample from annual APTA Public Transportation Infrastructure Database. Includes data only for transit agencies included in that database.
Passenger Station Parking Supply data by mode from 2000 through 2010 can be found in the 2013 Public Transportation Fact Book, Appendix A: Historical Tables at www.apta.com.
Employees
In 2011, the transit industry employed 387,152 operating employees and 10,779 capital employees. Transit operating employees include workers in the functions of vehicle operations, vehicle maintenance, non-vehicle maintenance, and general administration. Transit agency capital employees are employees on transit agency staffs performing capitalized activities and do not include employees of vehicle manufacturers, engineering firms, building contractors, or other companies with capital investment contracts from transit agencies. Direct transit employees were paid a total of $14.3 billion and received benefits of $10.6 billion, for a total compensation of $24.9 billion.
Table 17: Employees by Mode and Function
Report Year 2011
Mode Operations Vehicle
Vehicle Mainte-nance Non-Vehicle Mainte-nance General Admin-istration Operating
Total Capital Total
Bus 130,113 33,651 7,223 18,171 189,158 2,053 191,210
Bus Rapid Transit 150 35 9 19 213 8 221
Commuter Bus 2,786 759 144 393 4,082 27 4,109 Commuter Rail 10,275 8,186 6,414 2,815 27,689 2,706 30,396 Demand Response 77,581 7,268 2,051 11,187 98,087 146 98,233 Ferryboat 3,046 465 235 439 4,186 135 4,321 Heavy Rail 19,393 9,315 16,114 4,540 49,362 4,839 54,202 Hybrid Rail 48 38 30 13 130 13 142 Light Rail 4,253 2,039 2,229 1,069 9,590 735 10,325
Other Rail Modes 523 486 316 299 1,623 36 1,659
Streetcar 434 220 76 64 793 51 844
Transit Vanpool 73 74 11 349 508 2 511
Trolleybus 1,165 308 128 130 1,730 28 1,759
Total 249,840 62,845 34,980 39,487 387,152 10,779 397,931
NR = Not Reported
Employees by mode data from 1931 through 2011 can be found in the 2013 Public Transportation Fact Book, Appendix A: Historical Tables at www.apta.com.
Transit spending supports many more jobs than solely the employees reported on Table 17. Table 18 reports the jobs supported by transit calculated from the Economic Impact of Public Transportation Investment by Glen Weisbrod and Arlee Reno, 2009. As shown on Table 18, Weisbrod and Reno estimated the direct, indirect, and induced jobs supported by transit spending. Direct jobs include transit system employees who operate and maintain the system's vehicles and facilities and those who administer the system as well as employees of companies building transit station, rights-of way, and other facilities, or manufacturing transit vehicles. Indirect jobs are in industries that supply goods and services that enable direct spending such as materials and parts for building vehicles, guideways, and stations. Induced jobs result from workers re-spending income on consumer goods and services.
The report estimated jobs per $1 billion in expenditures. The expenditure of $1 billion for capital investment would result in 23,788 jobs and for operations would result in 41,140 jobs. Based on the typical mix of capital and operating expenditures, $1 billion in federal spending would support 30,000 jobs and $1 billion in average transit agency spending would support 36,000 jobs. Transit spending in 2011, $17.1 billion for capital investment and $38.4 billion for operations, supports nearly 2 million jobs based on the rates in their analysis.
EMPLOYEES/ENERGY AND ENVIRONMENT
23
Table 18: Jobs Supported by Transit Expenditures
Report Year 2011
Category of Job
Total Transit Expenditures, Billions of Dollars
Jobs Supported per $1 Billion Dollars (a)
Total Jobs Supported by RY 2011 Transit Spending
Capital Operating Capital Operating Capital Operating Total
Direct Jobs --- --- 8,202 21,227 139,902 814,312 954,215
Indirect Jobs --- --- 7,875 2,934 134,325 112,554 246,879
Induced Jobs --- --- 7,711 16,979 131,527 651,350 782,877
Total Spending/Jobs 17.1 38.4 23,788 41,140 405,754 1,578,217 1,983,971 (a) from Weisbrod, Glen and Arlee Reno. Economic Impact of Public Transportation Investment, October 2009. Available at
www.apta.com.
Energy and Environment
Public transportation plays an important role in reducing the nation’s energy use and greenhouse gas emissions. Due to the combined reduction in private passenger vehicle miles, reduced automobile congestion and reduced travel distances due to the proximity created by public transportation, over 4 billion gallons of gasoline are saved and 37 million metric tons of carbon dioxide emissions are avoided as described on Table 19. According to the US Environmental Protection Agency’s Greenhouse Gas Calculator, it would require 7.2 million acres of new pine or fir forests per year to match the annual carbon dioxide reductions provided by public transportation. Priced at $3.60 per gallon, the 4 billion gallons of gasoline saved annually saves the US consumer $14.4 billion per year.
Table 19: Energy and Emission Benefits from Public Transportation
Changes in Fuel Use Due To Public TransportationTotal Energy Savings (Billion Gallons of Gasoline
Equivalent)
Carbon Dioxide Emission Reductions (Million Metric Tons) Reduction Directly from Riding Public Transportation as
Replacement of Private Vehicle Miles, Gross 1.80 16.2
(Less Fuel Currently Used by Public Transportation) (1.38) (12.3) Savings to Private Vehicle Drivers Because of Congestion
Reduction Due to Public Transportation 0.34 3.0
Secondary Reduction Due to Reduced Travel Distance
Related to Public Transportation Related Location Decisions 3.40 30.1
Total Savings Due to Public Transportation 4.16 37.0
Sources: ICF International, The Broader Connection between Public Transportation, Energy Conservation and Greenhouse Gas Reduction, 2008 and SAIC, Public Transportation's Contribution to U.S. Greenhouse Gas Reduction, 2007. Both are available at www.apta.com.
As shown on Figure 15, transit’s impact on reducing congestion has also resulted in significant savings for drivers and their communities. Without transit, drivers would have used 450 million more gallons of gasoline because of added roadway congestion during 2011. Drivers would have been stuck in traffic an additional 865 million hours if there were no transit. Overall, the costs of congestion to drivers would have been an additional $20.8 billion if there had been no transit service. The leveling off of transit benefits since 2007 results from the decline in roadway vehicle miles of travel over that period which was described on Figure 2 on Page 11.
ENERGY AND ENVIRONMENT
24
Source: 2012 Urban Mobility Report, Texas Transportation Institute, Texas A&M University, see
http://mobility.tamu.edu/ums/
Transit vehicles used a total of 6.59 billion kilowatt hours of electricity for propulsion power in RY 2011 and 1,018 million gallons of fossil fuels as reported on Table 20.
Table 20: Vehicle Fuel Consumption by Mode of Service
Report Year 2011
Mode Electricity (Millions of Kilowatt Hours)Fossil Fuels (Millions of Gallons) Diesel
Fuel Gasoline
LNG and Blends
CNG and
Blends Biodiesel Other Total
Bus 1.1 440.1 8.8 21.6 130.4 51.0 4.0 655.9
Bus Rapid Transit 0.0 0.6 0.0 0.0 0.0 0.0 0.0 0.6
Commuter Bus 0.0 14.5 0.1 0.0 0.7 0.1 0.0 15.3 Commuter Rail 1,813.1 93.9 0.0 0.0 0.0 1.2 0.0 95.1 Demand Response 0.0 63.4 117.8 0.0 4.0 10.7 0.8 196.8 Ferryboat 0.0 36.4 0.0 0.0 0.0 0.3 0.0 36.8 Heavy Rail 3,853.8 0.0 0.0 0.0 0.0 0.0 0.0 0.0 Hybrid Rail 0.0 1.1 0.0 0.0 0.0 0.1 0.0 1.2 Light Rail 750.4 0.0 0.0 0.0 0.0 0.0 0.0 0.0 Other Rail 67.2 0.0 0.0 0.0 0.0 0.0 0.0 0.0 Publico 0.0 0.0 3.4 0.0 0.0 0.0 0.0 3.4 Streetcar 39.0 0.0 0.0 0.0 0.0 0.0 0.0 0.0 Transit Vanpool 0.0 0.0 12.8 0.0 0.0 0.0 0.0 12.9 Trolleybus 61.0 0.0 0.0 0.0 0.0 0.0 0.0 0.0 Total 6,585.7 649.9 142.9 21.6 135.1 63.4 4.8 1,017.8
Vehicle Fuel Consumption data by mode from 1945 through 2011 can be found in the 2013 Public Transportation Fact Book, Appendix A: Historical Tables at www.apta.com.
0.0 5.0 10.0 15.0 20.0 25.0 0 200 400 600 800 1,000 1,200 1983 1987 1991 1995 1999 2003 2007 2011 B ill io n s of Dolla rs Sa ve d Mi lli o n s of Gal lo n s an d Ho u rs Sa ve d
Figure 15: Growth of Transit Congestion Savings
Millions of Hours of Travel Saved (left‐hand axis) Million of Gallons of Fuel Saved (left‐hand axis) Billions of Dollars Saved (right‐hand axis)