This is an Open Access document downloaded from ORCA, Cardiff University's institutional
repository: http://orca.cf.ac.uk/124664/
This is the author’s version of a work that was submitted to / accepted for publication.
Citation for final published version:
Turner, Liam, Allen, Stuart and Whitaker, Roger 2019. The influence of concurrent mobile
notifications on individual responses. International Journal of Human-Computer Studies 132 , pp.
70-80. 10.1016/j.ijhcs.2019.07.011 file
Publishers page: https://doi.org/10.1016/j.ijhcs.2019.07.011
<https://doi.org/10.1016/j.ijhcs.2019.07.011>
Please note:
Changes made as a result of publishing processes such as copy-editing, formatting and page
numbers may not be reflected in this version. For the definitive version of this publication, please
refer to the published source. You are advised to consult the publisher’s version if you wish to cite
this paper.
This version is being made available in accordance with publisher policies. See
http://orca.cf.ac.uk/policies.html for usage policies. Copyright and moral rights for publications
made available in ORCA are retained by the copyright holders.
The influence of concurrent mobile notifications on individual responses
Liam D. Turner, Stuart M. Allen, Roger M. Whitaker
School of Computer Science & Informatics, Cardiff University, UK
Abstract
Notifications on mobile devices punctuate our daily lives to provide information and prompt for further engagement. Investigations into the cognitive processes involved in consuming notifications are common across the literature, however most research to date investigates notifications in isolation of one another. In reality, notifications often coexist together, forming a “stack”, however the behavioural implications of this on the response towards individual notifications has received limited attention. Through an in-the-wild study of 1,889 Android devices, we observe user behaviour in a stream of 30 million notifications from over 6,000 applications. We find distinct strategies for user management of the notification stack within usage sessions, beyond the behaviour patterns observable from responses to individual notifications. From the analysis, we make recommendations for collecting and reporting data from mobile applications to improve validity through timely responses, and capture potential confounding features.
Keywords: Notifications, smartphone, mobile computing, experience sampling
1. Introduction
Notifications form an integral part of mobile device usage by providing users with information relevant to individual applications and system operation [1]. However, notifica-tions can arrive at inopportune moments, where they are not immediately attended to [2, 3], creating a backlog and a burden on the user to manually manage and filter based on their perceived relevance. For applications that use notifications to prompt an individual to provide data (i.e., the experience sampling method (ESM) [4]), delayed or ignored responses can have an adverse effect on the data quality, particularly for those that require time or context-sensitive data in situ. Previous studies have empirically highlighted the extent that requests for data collection via notifications are ignored (e.g., [5, 6]). This has led to exam-ination of the cognitive processes involved in responding to notifications, leading to recommendations for notification design (e.g., [7, 8]), as well as the development of intelligent delivery systems (e.g., [9, 10]).
Previous investigations into the decision processes in-volved in notification management have implicitly assumed that mobile users review and respond to individual notifi-cations in isolation of each other (e.g., [5, 6, 7, 11, 12, 13]). While it has been acknowledged that notifications can ar-rive frequently (e.g., [1, 14]) and that removal behaviour
∗LDT is the corresponding author: [email protected] This article has been published in the International Journal of Human-Computer Studies: https://doi.org/10.1016/j.ijhcs. 2019.07.011
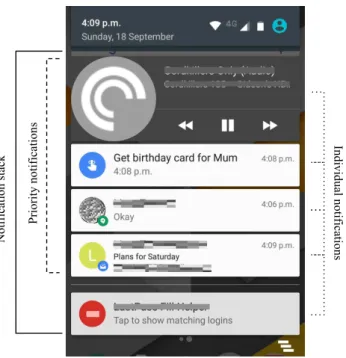
can be selective (e.g., [6, 15]), the potential influence from the arrival or presence of other notifications has not been explicitly considered. In particular, this overlooks the po-tential for notifications to build up and coexist together as a list or “stack” (as shown in Figure 1) where they compete for attention.
Presenting the user with a stack of notifications creates more cognitive effort as a result of the implicit or explicit decisions on what to remove when; with the diverse nature of notification design and functionality increasing the com-plexity further. This issue forms the focus of this study, where we investigate the extent that notification stacks occur and how individual notifications are reviewed and removed within a stack. To enable this, a bespoke Android application (Boomerang Notifications) was developed and released “in-the-wild”. The application monitored when notifications occur on the device, collects their properties, and records when they are removed, enabling us to observe user behaviour towards notification stacks. The application offered utility to its users to encourage uptake (as proved successful in [1]) by enabling notifications on the device to be saved and “boomeranged” back to the user at a later time. It was released on the Google Play Store with 3,106 users installing the application over a 10-week period. How-ever, as some users only tried the application for less than a day, we subsequently filtered these to 1,889 users (discussed further in Section 3.1), resulting in a dataset of 30,298,226 notification arrival events across 6,372 applications.
Analysis of the dataset results in two main contributions. Firstly, we provide insight into how often notifications build up into stacks, highlighting that the convention of considering notifications in isolation along with the
con-Indi vi dua l not ifi ca tions Not ifi ca tion st ac k Pri ori ty not ifi ca tions
Figure 1: Example Android notification drawer showing a stack of notifications.
textual features of the device only provides a partial view of notification decision making behaviour. Secondly, we explore behavioural patterns concerning when and how notifications are removed from the stack, or retained for later attention. From this, we find correlations suggesting that individual notifications can both positively and nega-tively impact the response behaviour towards others. In light of our analysis, we conclude with a discussion of rec-ommendations concerning the behaviours and features of notification stacks that should be considered in the design, delivery, and evaluation of individual notifications. For ESM-based applications, these recommendations present strategies for delivery and redelivery depending on whether data collection needs to be near real-time or just reported daily.
2. Background
To date, the study of human behaviour towards mobile notifications has primarily concerned determining when they should be delivered so that they provide maximum utility and minimum annoyance (e.g., [5, 16, 12, 17, 18, 19]). Towards this, individual research studies typically examine
what is received, (i.e., the frequency and diversity of notifi-cations) and/orhow they are acted upon (i.e., whether they are removed or kept until a later time). While conclusions of how humans typically handle high volumes of notifi-cations can be drawn from aggregating their behaviour towards individual notifications (e.g., [1, 13]), a common limitation across the literature is that notifications and re-sponses are examined individually [20]. In particular, there has been little investigation into the potential conscious or sub-conscious influence of multiple notifications being
presented to the user at the same time (e.g., as shown in Figure 1), with research surrounding other types of media (e.g., email inboxes [21]) suggesting that this is a task that we frequently face.
2.1. The daily presence and diversity of notifications
A significant focus of the literature has been to explore the extent to which notifications punctuate our lives in order to attract attention, including whether notifications from some types of applications (e.g., communication) oc-cur more frequently than others (e.g., [1, 14]), and whether context such as time of day are relevant (e.g., [3, 12]). A common conclusion from these studies is that notifica-tions arrive frequently but non-uniformly, reflective of the unregulated nature in which they are generated by appli-cations. Combined with studies examining the response behaviour towards individual notifications, this motivates design principles and systems for delivering notifications at more opportune moments (e.g., [7, 15, 17]).
Despite this, there are some limitations in current work that motivate further attention [20]. Firstly, studies typ-ically examine notifications as a collection of individual events (e.g., [3, 5, 13, 14]), and do not explore the extent to which notifications build-up and coexist. Secondly, the originating application and content are no longer the only distinguishing characteristics of notifications, which have evolved to have a range of properties (e.g., an assigned pri-ority) that affect how they are shown and can be interacted with.
2.2. Cognitive processes in managing notifications
A typical notification prompts the user to review some content and, based on the perceived utility it offers, either remove it or keep it until a later time. This has motivated the examination of the decision processes that underpin if and how notifications are responded to (e.g., [6, 15, 22]), as seen more generally in wider electronic-based systems (e.g., [23]). The conclusions of these studies have found that users devote a limited amount of time and resources to reviewing notifications [2, 24, 25, 26] and as a result they may be removed at a later time than their first appearance. In these cases, the user may in fact physically be reachable, since they interact with the device, but not receptive to respond to the specific content [5].
Furthermore, several software-based mechanisms on the device can be used to support the user in managing notifi-cations [27]. Historically, this simply enabled the user to set the device’s “ringer mode” to be silent so that audible cues are suppressed [28]. The recent evolution of mobile operating systems such as Android has allowed for further customisation, for example, policies that suppress notifi-cations only from specific applinotifi-cations for specific time periods. While existing studies have shed light on the use of silent mode to support notification management [24, 29], there has been limited empirical investigation of notification policies [6] and the settings that affect where notifications are displayed.
Studies have shown that user behaviour does not always reflect their use of policies. For example, Mehrotra et al. [6] find that users still responded to individual notifications during periods of self-declared unavailability. Additionally, Lopez et al. [18] find that people consciously adjust the interruption settings of their device based on proximity to themselves, rather than to suppress their interruptive nature. However, this has been limited to the perspective of individual notifications. Examining the effect of this suppression on the wider notification stack during these pe-riods could offer further insights into whether self-declared interruption policies reflect the other cognitive processes being used.
Finally, research surrounding the broader topic of inter-ruptibility [20] has investigated the development of tools or “notification management systems” [30] to help schedule interruptions at appropriate times. These systems are not exclusive to mobile notifications and span a variety of tech-nology platforms, such as personal computers [31] through to more ambient environments [32]. Broadly speaking, these systems can be classified into those that help medi-ate delivery on behalf of the user and those that medimedi-ate delivery on behalf of the application. As an example of the first, PrefMiner [33] creates notification delivery rules managed by the user, with NHistory [34] allowing users to defer notifications until a later time. From the applica-tion perspective, Attelia [9] analyses low-level interacapplica-tions with the device in order to deliver notifications alongside common tasks, and there is an emerging body of predictive models to support notification delivery (e.g., [5, 7, 12, 35]). However, current systems only consider individual notifi-cations in isolation, whereas the focus of this paper is to demonstrate the potential benefits of a holistic approach.
3. Methodology
A bespoke Android application was developed to collect information surrounding all notifications that occur on the device (e.g., similar to [1, 14, 36]). This contrasts with a common convention of previous studies (e.g., [3, 7, 24]) that only examine behaviour towards notifications generated by the study application.
3.1. Data collection
We developedBoomerang Notifications and distributed the application freely for self-selecting participants through the Google Play Store. Before doing so, the study un-derwent the ethics approval processes of the authors’ in-stitution. The in-the-wild study environment (as used in related works, e.g. [17, 5, 7]) motivates users to take part in the study through some other utility than monetary compensation. In this case, the application enabled users to save notifications in the application for the purpose of archiving or to act as reminders (similar to [34]), a feature that enabled uptake for large-scale data collection.
After installing the application, users were presented with a setup process describing the research study and asking for
informed consent to collect anonymised data. The choice of implicit background data collection (as used in [5, 6, 12, 19]) enables the capture of natural behaviour at scale and lon-gitudinally, minimising the behavioural bias that can occur from controlled experiment environments [37]. The applica-tion runs as a background service and collects anonymised notification meta-data accessed via the NotificationListener API, as used in related works [6, 36]. Alongside notification meta-data, contextual events relevant to the device and its usage (e.g., screen on/off events) and device preferences (e.g., whether notifications were present on the lock screen) were also collected. To avoid privacy concerns, the contents of notifications (e.g., text) and sensitive contextual data such as fine-grained application usage and location were not collected.
Data was collected from 3,106 users over a 67-day period. The first day of usage for each user was removed, as this only covers a partial day and may be inconsistent as users exper-iment with functionality. This removes 1,217 users (39.2%) who only used the application briefly from the dataset. The resulting dataset contains 1,889 users that used the application for an average of 7 days (SD = 4.6, Mdn = 6), spanning a variety of Android versions (API-21: n= 151, API-22: n = 249, API-23: n = 1236, API-24: n = 1), across 332 device models and 45 manufacturers (this data was not available for n = 252 users). Users providing less than a weeks data showed no significant difference in the mean time spent on the device compared to longer users (Mann-Whitney rank test after testing for normality,
U = 433,158, p= 0.32). There were also no significant differences in overall device usage in the first and second weeks (for those that used the app for at least 2-weeks), based on a Wilcoxon signed-rank test (Z = 8303, p= 0.51). From this we assume that the data provided by users rep-resent typical days of usage irrespective of their overall participation time.
3.2. Usage subgroups
Similar to existing large-scale works focusing on indi-vidual notifications (e.g., [1, 38]), we examine behaviour averaged over users for all active days. However, as indi-viduals have been shown to be active to a different extent on their devices per day [39], we also split the users into tertiles based on their mean time spent on the device each day. We define the lower tertile group as ‘low usage users’ (LUU) with 1.65 hours per day on average (SD = 0.68, Mdn = 1.77, n= 630); the middle tertile group as ‘medium usage users’ (MUU) with 3.48 hours per day on average (SD = 0.53,Mdn = 3.44, n= 629); and the higher tertile group as ‘high usage users’ (HUU) with 7.05 hours per day on average (SD = 2.38, Mdn = 6.31, n = 630). We examine the notification stacks and behaviour of these groups in addition to an aggregated set of all users, and comment on where results for a given group are notably dif-ferent from the aggregated dataset, supported by statistical tests after testing for normality.
3.3. Sessions of device usage
Users review and address notifications as part of device usage. Before examining the dataset, pre-processing is performed in order to construct sessions [40]. Similar to [16, 41, 42], we define ausage session as the period between a screen on/boot event and screen off/shut down event, when a user can be assumed to be using their device in some way. The data set contains 1,066,475 usage sessions across all users after discarding cases of mismatched pairs of screen on/off events (e.g., as a result of the device losing power) or data gaps in the notification meta-data at the start of the session (e.g., as a result of notifications existing before the application was activated). This corresponds to an average of 81.30 usage sessions per user per day (SD = 110.38, Mdn = 65). However, this is lower for LUU (M = 58.92, SD = 50.12, Mdn = 50), higher for HUU (M = 100.43, SD = 171.98, Mdn = 71), and similar to the aggregate for MUU. A Kruskal-Wallis H-test reveals that the average number of sessions a user has per day is statistically significant across the subgroups (χ2(2) =
189.61, p < 0.001), with Dunn post-hoc tests showing significance between LUU and MUU and LUU and HUU. Overall, this suggests that the number of times the device is used in a day correlates with the total time on the device per day.
4. Notifications build up into stacks
To motivate exploring how notification stacks are man-aged, we begin by examining the extent to which they occur. Notifications are issued to devices frequently, with an average of 218 new notifications per user per day (SD = 259.75, Mdn = 161), in addition to 1,882 updates (SD = 3,512, Mdn = 827). Users in the LUU subgroup typically received less than this (new: M = 143.59, SD = 202.24, Mdn = 111.17; updates: M = 1297.37, SD = 2326.31, Mdn = 647.59), HUU typi-cally more (new: M = 310.89, SD = 374, Mdn = 232.95; updates: M = 2,499.63, SD = 3,129.24, Mdn = 1,451.05), and MUU similar to the aggregate. A Kruskal-Wallis H-test reveals significant differences between the subgroups (χ2(2) = 317.30 (new) 175.28 (updates), both p <0.001)
with Dunn’s post-hoc tests showing significance between all pairs. This is unsurprising as using the device is likely to involve activities that induce notifications (e.g., messaging apps).
It is important to consider that users are unlikely to consciously perceive these high rates of notification deliv-ery, as some are presented in groups (e.g., emails), have no interruptive cues (e.g., download progress updates), or are relatively minor (e.g., changes to playing media). We find support for this in the features of notifications, with 6.35% of all notifications (including updates) typically displayed in a group, only 9.69% having explicit interrup-tive cues beyond appearing visually, and 82.09% not being removable through a swipe (a common feature of media
Figure 2: An example showing the icons of two priority notifications being shown along the top of the screen
and other status-based notifications). These results show that notifications have evolved from being synonymous with communication or alarm based interruptions (as high-lighted by [1, 14, 38]). Nevertheless, this highlights the extent in which notifications compete for our attention, with each update intending to provide some utility to the user.
The multifaceted design of notifications, their arrival and update frequency, and the freedom given to users to manage their presence enables notifications to co-exist over time as a stack, however we note that notifications within the stack can be accessed and acted upon individually. At the start of a usage session, a user can be faced with a stack of one or more notifications (as shown in Figure 1), containing those that were either not removed in the previous session, or arrived in the interim, with the stack then updated from notification events during a usage session.
Analysis of notification stacks at the start of the usage sessions reveals that a user is typically faced with an av-erage of 6.37 notifications (SD = 6.26, Mdn = 5). From another perspective, 90.2% of all sessions started with 2 or more notifications (n= 962,305), 7.9% a single notification (n= 84,382), and only 1.9% contained no notifications at all (n= 19,788), with a chi-square test of the contingency table between user subgroups showing no significant differ-ences. Overall, this shows that users often face multiple notifications to review (or review again), even if they were only interrupted by one of these.
Stacks are also diverse in terms of applications and design properties, increasing the complexity of reviewing them beyond their individual content exclusively. We find that a typical stack contains notifications generated across 5.11 applications (SD = 3.60, Mdn = 4), with 1.15 notifications part of a group (SD = 2.87, Mdn = 0), and each notifica-tion having an average of 1.79 acnotifica-tions (e.g., tap acnotifica-tions and buttons) that could be performed (SD = 0.68, Mdn = 1). Analysis for usage subgroups shows similar results, except that HUU has a notably higher average of 7.22 notifica-tions at the start of a session (SD = 5.77, Mdn = 5). A Kruskal-Wallis H-test revealed that this difference is sig-nificant (χ2(2) = 8.13, p = 0.017), with Dunn post-hoc
tests showing significance between HUU and both LUU and MUU (p= 0.037 andp= 0.045 respectively). The diversity of the stacks are also similar across the user subgroups, despite the slight differences in number of notifications.
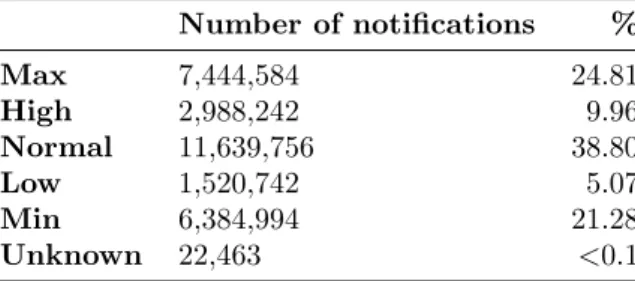
The cognitive burden on the user at the start of a session may be slightly lessened as Android only displays lower pri-ority notifications in the full notification drawer (as shown in Figure 1) and therefore they may not be immediately seen. Table 1 shows the distribution of notification priori-ties in the dataset, with a chi-square test showing no
signif-Table 1: Frequency of priority usage Number of notifications % Max 7,444,584 24.81 High 2,988,242 9.96 Normal 11,639,756 38.80 Low 1,520,742 5.07 Min 6,384,994 21.28 Unknown 22,463 <0.1
icance in the contingency table of the frequencies between the usage subgroups. We note that notifications are fre-quently set to either high or maximum priority, highlighting notification competition further. We extracted the subset of notifications with a priority of normal and above as these will be shown directly on the lock-screen (if user preferences allow for it) and in a smaller form factor along the top bar (Figure 2). We term these to be thepriority notifications
of the stack (shown in Figure 1) and find that sessions typi-cally have 4.26 priority notifications (SD = 5.70, Mdn = 3), however 14.46% (n= 154,219) of sessions had no priority notifications at the start. All usage subgroups are similar in this regard, however HUU typically contains slightly more priority notifications (M = 4.73, SD = 5.64,Mdn = 3). A Kruskal-Wallis H-test shows that this difference is sig-nificant (χ2(2) = 17.46, p <0.001), with Dunn post-hoc
tests showing significance between HUU and both LUU and MUU (p= 0.002 and p <0.001 respectively).
Overall, this analysis highlights that users are often faced with a stack of multiple, diverse notifications to re-view. From the perspective of the design and delivery of individual notifications, this suggests that notification man-agement could be (consciously or subconsciously) perceived as a single task, rather than a set of cognitively indepen-dent tasks. Particularly for those where a timely response is important (e.g., for the accuracy of data collection via notifications), this presents initial evidence that the design and response processes towards the notification should not be considered in isolation of what else is occurring on the device. Investigating the behavioural effects of the notifi-cation stack on individual notifinotifi-cations forms the focus of the following analysis, in which we examine when and how the notification stack is managed.
5. When the stack is managed
As users are often faced with a stack of notifications to review, we examine when management occurs over time, comparing behaviour across sessions, within sessions, and the effect of interruption policies as a mediating factor.
5.1. Frequency of notification stack management
We begin by exploring the nature of usage sessions that include notification stack management. Just under half
(N = 478,845) of all sessions see at least one notifica-tion removed, with a similar propornotifica-tion for each usage subgroup. Sessions containing notification removals last 5.45 minutes on average (SD = 25.93, Mdn = 1.23), consistent with previous literature [39]. They are sepa-rated by 34.38 minutes on average (over a 24-hour period) (SD = 208.63, Mdn = 6.42) and involve 5 removal events (SD = 13.67, Mdn = 2).
For the three usage subgroups, removals broadly corre-late with the time spent on the device, as well the number of sessions and notifications. LUU have shorter sessions (M = 3.14, SD = 17.75, Mdn = 0.95), longer time be-tween them (M = 51.40, SD = 307.24, Mdn = 9.66), and slightly less removals (M = 3.94, SD = 10.10, Mdn = 2). HUU have longer sessions (M = 8.29, SD = 37.26, Mdn = 1.65), much less time between them (M = 24.75, SD = 107.73, Mdn = 4.63), and remove more notifications from the stack (M = 6.38, SD = 19.25, Mdn = 3). MUU behaves similar to the aggregate. A Kruskal-Wallis H-test shows that the distributions in the mean values for each user across the subgroups is statistically signif-icant (Session length: χ2(2) = 1641.0, p < 0.001; Time
in-between: χ2(2) = 1621.69, p < 0.001; # removals: χ2(2) = 1667.18, p < 0.001), with Dunn post-hoc tests
showing significance between all pairs. Overall, despite the differences between the user groups it is clear that notifi-cation management forms an integral part of device usage. Relative to the overall time spent on the device, this sug-gests that users typically adopt an approach of managing the notification stack often, in short bursts, which may be reflective of the frequent arrival of notifications observed in Section 4.
Additionally, we examined whether the number of no-tifications received since the last session was negatively correlated with the time since, which would indicate that users are drawn towards a likely increasing stack. How-ever, we find this not to be the case with a Spearman correlation test showing a strong, positive correlation (rs = 0.54, p < 0.001), where unsurprisingly the longer
the time between sessions, the more notifications that oc-cur. This is further supported by a positive correlation (rs = 0.29, p < 0.001) between the time since the last
session and difference in stack size since the last session. All user subgroups are similar in this regard, suggesting that the presence of a growing notification stack does not induce usage.
Usage sessions involving removals may have been trig-gered by the arrival of a notification [7, 12], or the user may have explicitly chosen to check their notifications, or simply done so alongside their other device usage. To examine the impact of notification arrivals, we extracted usage sessions that started at least 30 seconds after the previous session (N = 732,187), and also had notifications arrive within the previous 30 seconds (n= 284,773, 38.89%). This has previously been shown to be enough time for a user to unlock the device, open the notification drawer and remove a notification [5]. The majority, but not all of these
ses-sions, (n = 225,245, 79.10%) had notification removals, with all subgroups similar in this regard. This reflects previous findings that individuals can sometimes choose to investigate notifications, but delay removing them until a later time (e.g., [12, 15]).
Closer inspection reveals that notification arrivals of-ten prompt the user to review the notification stack as a whole, rather than solely focus on those that may have directed their attention towards the device. Only a small proportion of sessions involved the exclusive re-moval of notifications that arrived within the 30 sec-onds beforehand (n = 26,482, 11.76%), with users of-ten processing earlier notifications as well, either in addi-tion (n= 53,205, 23.62%), or in some cases only those older notifications (n = 82,984, 36.84%). The remain-ing sessions account for those where the user only pro-cessed notifications which occurred after the session started (n= 62,574, 27.78%). While the user may have chosen to interact with the device for another task, this speculatively suggests that notification arrivals trigger the user to use their smartphone for some other use. All usage subgroups had similar frequencies suggesting that this is a common behaviour, with a chi-square test of the contingency table showing no significant difference between the groups.
These results have important implications where a near immediate response is required, such as for ESM-based data collection. While notification management happens often, a user may not respond to a notification in isolation and their attention is likely shared across the stack. The arrival of other notifications may also direct the user to review existing notifications, where the data collection notification may receive attention without prompting the user again. On the other hand, there are potential confounding factors for the specific case of ESM, where interrupting a user (for example to ask about their level of smartphone usage) may trigger an increase in usage. In these cases, an additional data collection device could be used [43].
5.2. Stack management within sessions
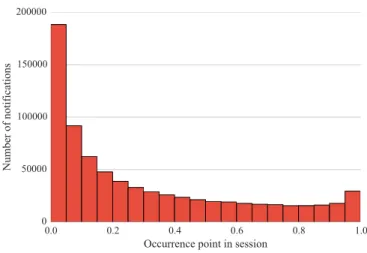
We investigate whether there are patterns in when noti-fication management occurs in the context of wider smart-phone usage and other tasks. Figures 3 and 4 show the distribution of removal times, split between those notifi-cations present in the stack at the start of the sessions (N = 745,386) and those that were added and removed during a given session (N = 1,599,411) respectively. A chi-square test applied to the normalised frequencies re-veals that the difference between the two distributions is significant (χ2(19) = 84.71, p <0.001), a result which also
holds for each of the usage subgroups.
For notifications that were present in the stack at the start (Figure 3), the results show spikes in removals at the start and end of sessions. The larger proportion of consumption at the start is expected, given that notifica-tions are typically shown on the lock-screen and that usage sessions could be triggered by a notification (Section 5.1). This is further supported by the long-tail distribution of
0.0 0.2 0.4 0.6 0.8 1.0
Occurrence point in session 0 50000 100000 150000 200000 Number of notifications
Figure 3: Normalised time (0 = session start, 1 = session end) of removal for notifications present at start
0.0 0.2 0.4 0.6 0.8 1.0
Occurrence point in session 0 50000 100000 150000 200000 Number of notifications
Figure 4: Normalised time (0 = session start, 1 = session end) of removal for notifications arriving during session
removals. However, the larger proportion of removals at the end of sessions is more surprising, suggesting that typical behaviour is to review notifications at the end of sessions, and remove those that no longer serve a purpose. For noti-fications that arrived and were removed during the same session (Figure 4), the removals occurred at a relatively even rate, with small peaks at the start and end. This suggests that users will disrupt their current task on the device to manage stack changes in situ. These distributions are very similar across the subgroups when normalised to the number of notification removals in each, suggesting that these are common behaviours. Chi-square tests on the con-tingency tables containing the frequencies between the bins for each of the subgroups show no significant difference.
To further explore the impact of arrival times, we analysed the lifetimes of notifications that arrive dur-ing sessions (includdur-ing updates to those in the startdur-ing stack) and found that the average period between ar-rival and consumption was 60 seconds, but with a much
smaller median of 4.84 seconds (SD = 579.42). All sub-groups have a similar median between 4-5 seconds (LUU: M = 32.06, SD = 551.90; MUU: M = 36.36, SD = 340.61; HUU: M = 83.08, SD = 689.17), but significantly different distributions overall (χ2(2) = 3914.10, p < 0.001) and
between all pairs. Overall, this shows that the majority of notifications that occur within a session are reviewed and removed quickly. However, the overall distribution suggests that users may not attend to notifications immediately and may instead prolong usage in order to review and manage notifications at the end of sessions (as shown in Figure 4). This could also reflect findings in previous studies that find that breakpoints in tasks (e.g., at the end of smartphone usage) can be suitable moments to deliver information (e.g., [9, 31]).
5.3. The influence of interruption policies
Interruption policies enable “do-not-disturb” capability for notifications over a set time period, extending the histor-ical device-wide silent mode by providing application-level policies. While notifications still arrive as usual, the asso-ciated audio, and haptic cues are suppressed. By design, this could lead to the recommendation that interruption policies should be considered for experience sampling no-tifications. However, we find that the majority of users (n= 1282,67.87%) did not use an interruption policy at all, suggesting that manually managing these may be undesir-able. In these cases, users only suppressed interruptions by setting the device to a global vibrate rule (if at all), where the audio cues of all notifications are silenced but vibrate and visual cues still occur. A chi-square test showed no significant difference between the usage subgroups, suggest-ing that use of these policies does not correlate with the amount of daily usage.
For those users that did adopt interruption policies (n= 607,32.13%), the majority of these (n= 480, 79.07%) only applied selective policies to allow audio and haptic cues from specific notifications (e.g., only alarms). A small number of users (n= 79, 13.01%) only used policies that silence all notifications, and a few users (n = 34,5.6%) used both types (14 users had this level of detail missing). Additionally, we find that these frequencies are similar for each subgroup, with a chi-square test on the contingency table not showing a significant difference. API restrictions and privacy permissions prevent the exploration of indi-vidual rules; however, the results indicate that users are generally not using Androids built in interruption policies. This shows that notification management behaviour is not always consistent with the policies put in place. This reflects other findings in the literature, such as users still responding to individual notifications in silent mode [6] and that they consciously prefer different interruptive cues (e.g., LED or vibrate) depending on where the device is in the environment in relation to the user, rather than suppressing them as a measure of self-declared uninterruptibility [18]. From the viewpoint of designing the delivery of individual notifications, this shows that interruption policies are not
a reliable source for response estimation and that multi-notification stack management is still evident (supporting the findings of Section 5.1).
Overall, the results surrounding when notifications are managed highlight that notification management is a fre-quently performed task of reviewing multiple, concurrent notifications, even if a single notification may have trig-gered a response process. This suggests that users may not be considering individual notifications in cognitive isola-tion of one another, and that the presence of others may have positive or negative consequences on if, and how, a particular notification is responded to.
6. How the stack is managed
Examining how the notification stack is managed can provide further insight into the decision-making processes taking place, and in particular, the extent to which the stack affects how individual notifications are perceived. To examine this, we structure the analysis under 3 areas: i) differences in user preferences in how notifications are made known to the user, ii) the manner in which the user reviews the notification stack, and iii) the extent to which stacks are consumed during device usage or kept across multiple usage sessions.
6.1. How notifications are made known to the user
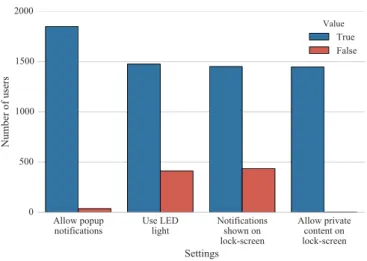
Android enables some customisation of when and where notifications are presented to the user through a number of device-wide settings, including: whether the notification stack is shown on the lock-screen; whether private content of notifications in the stack is concealed if they are shown on the lock-screen; whether high priority notifications are shown as pop-ups during usage; and whether the LED pat-terns on notifications are performed (if an LED is present on the device). This can impact if, and where, notifications are displayed either singularly, or together, and in the case of the lock-screen, could impact the potential influence of the stack when responding to a trigger from an individual, interrupting notification. Figure 5 shows their relative use in the dataset. Unfortunately, as API limits prevent us from detecting the device’s default settings, we are unable to determine if the users made a conscious choice or if the setting was left as the default. However, we note that previous research has shown that users typically do not deviate from the default settings [44].
From the perspective of applications designing and plementing a new notification delivery strategy, it is im-portant to consider that not all users have the same no-tification environment. For example, almost a quarter of users (n= 437, 23.14%) do not see notification content on the lock-screen. This has fundamental ramifications for applications prompting the user for data via notifications, as the user will need to unlock the device in order to access and act upon it. Previous research [5] shows that users are more willing to respond a notification to the point of
Allow popup
notifications Use LEDlight Notificationsshown on lock-screen Allow private content on lock-screen Settings 0 500 1000 1500 2000 Number of users Value True False
Figure 5: Distribution of notification presentation settings across users
the lockscreen but exit the process without unlocking the device if they find the content undesirable. Additionally, just over a fifth of users (n= 412, 21.81%) did not allow a notification’s LED pattern to play on arrival (however, API limits prevent us from knowing whether LED hardware is present in the device). A chi-square test revealed that these frequencies to are similar across the user subgroups, indicating that notification settings do not correlate with the extent of usage.
6.2. Ordering within the stack
Section 5.2 showed that individuals prioritise notifica-tion management around other usage, however this does not indicate how the stack is reviewed once the decision is made. To investigate whether the notification stack is likely reviewed as a set of cognitively independent tasks, we firstly examine the order in which notifications are re-moved. Figure 6 shows the distribution of the absolute position of notifications in the stack when they were re-moved. This shows a long-tail distribution, suggesting that users typically adopt a top-down approach to managing the notification stack. Notifications could appear below other non-dismissible or grouped content in the stack (as highlighted by Section 4), which may explain why the sec-ond and third positions are also common, whereby users may be removing the highest notification possible. This behaviour can be seen as a common behaviour across the user subgroups, with a chi-square test of the contingency table of frequencies across the bins showing no statistical significance between the groups.
As notification stacks can vary in size, we also explore the distribution using the relative position of removed notifications in the stack. The results mirror that of the absolute position with a long-tail distribution and a low average position of 20.85% into the stack (from the top), (SD = 23.25%, Mdn = 14.0%). As stacks typically contain multiple notifications (as shown in Section 4), this further
1 5 10 15 20+
Absolute position in stack 0 200000 400000 600000 800000 1000000 Number of notifications
Figure 6: The absolute position of notifications that were removed during usage sessions
supports that stacks of notifications are reviewed top-down. Additionally, as only a small number of notifications are typically removed per session (as shown in Section 5), this tentatively suggests that notification management is perceived to some extent as a stack problem, with some bias towards those at the top of the stack. Based on this, applications may wish to review the position of their notifications over time and potentially redeliver if they drift towards the bottom of the stack. Care should also be taken in ESM-based applications, where a lack of response may be due to the weight of other notifications rather than a conscious decision to ignore.
6.3. Extent of stack removals and deferred removals
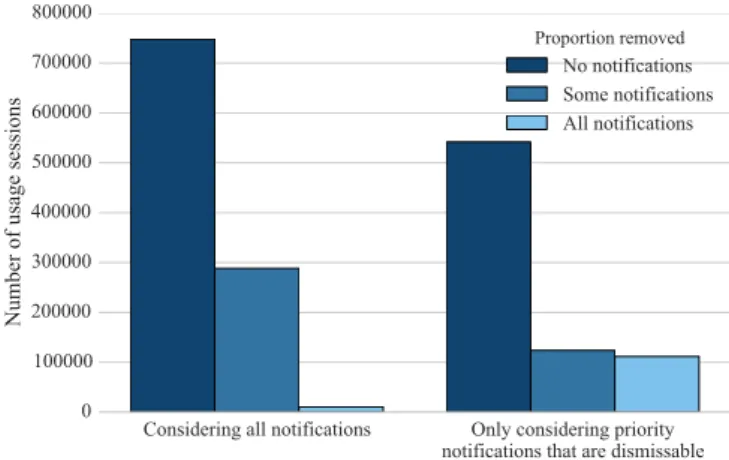
The analysis so far has suggested that notification re-movals are selective, reflecting previous findings that indi-viduals are not always receptive to removing notifications when they are seen [3, 5, 12]. To build on this, Figure 7 examines which notifications were present in the stack at the start of usage sessions and were removed by the end (19,886 sessions were omitted for either having no notifica-tions in the stack at the start of the session, or incomplete meta-data at the end of the session). Figure 7 also shows the distribution if only priority notifications that could be dismissed are considered; as these notifications are designed to be the most visible and arguably intended to be removed (an additional 269,357 sessions were removed as the notifi-cation stack at the start of these sessions did not contain any of this type of notification). Each subgroup produced similar frequencies to the aggregate for both all notifica-tions and priority notificanotifica-tions, with chi-square tests on the contingency table showing no statistical significance.
Overall, the results show that while sessions with removal events occur frequently (Section 5.1), typically only a sub-set of notifications present at the start of the session are removed. A chi-square test shows that the normalised fre-quencies in none, some, and all notifications being removed
Considering all notifications Only considering priority notifications that are dismissable
Proportion of the notification stack at the start of the session
0 100000 200000 300000 400000 500000 600000 700000 800000
Number of usage sessions
Proportion removed No notifications Some notifications All notifications
Figure 7: Distribution of the number of sessions in which none, some, or all of the notifications present in the starting stack are removed by the end of the session. Considering both: all notifications regardless of their properties (shown on the left) and only priority notifications that are individually dismissible (shown on the right)
is different between all notifications and only priority noti-fications that are dismissable (χ2(2) = 20.92, p <0.001),
with similar results for each of the usage subgroups. Com-bining this with the findings that individuals are typically selective in when removals occur (Section 5) and prioritise those at the top of the stack (Section 6.2), this suggests that limited resources are spent in reviewing notifications and the decision processes made in responding to individual notifications is influenced to some degree from the presence and behaviour towards others.
This selectivity can be supported further by examin-ing the notification stack at the end of sessions, irrespec-tive of the starting stack (as notifications can also occur during usage). The results show that 67.70% of sessions (n = 712,549) ended with at least 1 dismissible prior-ity notification remaining in the stack (M = 4.07, SD = 5.19, Mdn = 2), counted over those sessions which either had notifications present at the start or had at least one arrive during (N = 1,052,545). All usage subgroups are similar in this regard, with a chi-square test of the con-tingency table between the frequencies of sessions ending with and without these types of notifications showing no significant difference between the groups.
However, each subgroup did have a varying number of no-tifications remaining, (LUU: M = 3.70, SD = 4.52, Mdn = 2, MUU: M = 3.97, SD = 5.81, Mdn = 2, HUU: M = 4.38, SD = 4.94, Mdn = 3), inline with the num-ber of notifications received and notification stack size at the start of sessions (Section 4). A Kruskal-Wallis H-test shows that the difference in the mean number of notifications remaining per user, per session is significant (χ2(2) = 10.09, p < 0.006), but only between LUU and
HUU (p= 0.01), and MUU and HUU (p= 0.035). Overall the results highlight that regardless of the usage per day,
1 2-3 4-5 6-10 11-20 20+
Number of priority notifications at the start of a session 0.0 0.2 0.4 0.6 0.8 1.0
Proportion of priority notifications removed
Figure 8: The proportion of removed priority notifications, grouped by the number of dismissible priority notifications
dealing with notifications can often be deferred to a later session.
Android allows notifications containing a similar type of content to be grouped together in the stack by applications. For example, an email application may consolidate multiple messages into a single grouped notification. Notification groups are comprised of a single summary notification, with one or more child notifications that can be accessed by ‘expanding’ the summary notification with a gesture. All child notifications are removed when a summary no-tification is deleted, however they can also be accessed and removed individually. To examine whether users typi-cally remove these notifications en masse or individually, we examine the average pairwise distance in the removal times among all notifications removed from a group in a session (N = 81,956 groups). We assume that the no-tifications were likely removed as a group if the mean gap is less than 2 seconds. If longer, we assume that at least a subset of notifications were reviewed and removed individually. We find that the majority of notification groups are removed en masse (73.94%), with similar high proportions for the user subgroups. The distribution in mean removal times is long-tailed, suggesting that group removals can spread across a session (M = 100.52 seconds, SD = 959.24, Mdn = 0.12). A Kruskal-Wallis H-test shows that the difference between the user subgroups is significant (χ2(2) = 1034.17, p <0.001), with Dunn post-hoc tests
showing significance between all pairs.
The selective removal behaviour observed leads to the question of whether this is due to intentional retention, or whether the presence and behaviour towards other no-tifications has some degree of conscious or subconscious influence (as suggested by the position of removed notifi-cations in Section 6.2). To examine this, Figure 8 shows the extent that priority notifications (that are individually dismissible) at the start of a usage session are consumed by the end. The results show that the proportion of the
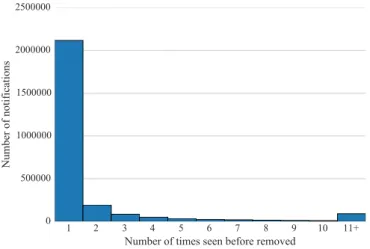
1 2 3 4 5 6 7 8 9 10 11+ Number of times seen before removed
0 500000 1000000 1500000 2000000 2500000 Number of notifications
Figure 9: The number of usage sessions unique notifications existed within
notification stack consumed does not scale linearly with its size, with typically only a small number of notifica-tions being removed. A Krusal-Wallis H-test reveals that the difference between the notification-stack size groups was significant overall (χ2(5) = 4581.25, p <0.001), with
Dunn post-hoc tests revealing significance between all pairs (p <0.001) except between 11-20 and 20+. Interestingly, this also suggests that users rarely dismiss all notifications and start over when the size gets too big, but rather chip away at it over multiple sessions. We find this to be a common behaviour, with significance for each of the user subgroups (LUU: χ2(5) = 950.88, MUU:χ2(5) = 727.85,
HUU: χ2(5) = 2969.95, all p < 0.001), with most pairs
significant in post-hoc tests (except MUU: 11-20 and 20+; HUU: 6-10 and 11-20, 6-10 and 20+, and 4-5 and 20+).
Collectively, these findings suggest that while some cog-nitive effort is frequently given to notifications, users con-sciously leave some or all of the notification stack until a later time. To examine this from the perspective of indi-vidual notifications, Figure 9 shows the number of sessions each notification was present in before being removed, for those that were present at some point in at least 1 session (N= 2,583,630 as this includes those that were removed outside of a session, such as if the device was restarted). Interestingly, the results show that the majority of notifi-cations were removed in the first session they appeared in, however, 20.31% of notifications (n= 524,615) persisted across multiple sessions before being removed (M = 2.80 sessions, SD= 19.92, M dn= 1). This behaviour is seen across each of the user subgroups, with a chi-square test on the contingency table comprised of frequencies in removal in first or later sessions showing no significant difference. Additionally, the mean number of sessions that a notifi-cation exists in was similar to the aggregate across the subgroups. However, a Kruskal-Wallis H-test showed signif-icance (χ2(2) = 33.51, p <0.001), with Dunn post-hoc tests
between LUU and HUU, MUU and HUU (allp <0.001).
Combining these results with Section 5.2, this suggests that applications requiring a timely response should aim to deliver notifications when the device is in use. We find support for this as the majority of notifications removed in the first session seen (Figure 9) were also delivered in that session (76.59%, n = 1,577,104). However, from another perspective, 93.17% of notifications that occurred outside of sessions (n = 481,911) were removed in the next session, in comparison to 76.32% of those that arrived during usage (χ2(1) = 15.71, p < 0.001). This suggests
that the competition between notifications is large during usage and that deferral is less likely if the notification is pushed outside of usage. However, this may not be a viable strategy depending on the timeliness of the data required as predicting when the device will next be used is a challenge in its own right.
Overall, the results indicate that users typically traverse the notification stack in a top-down manner, treat groups of notifications together, and often defer at least part of the stack for later sessions, with some differences between those added to the stack inside and outside of usage. This highlights the extent that concurrent notifications are com-peting for our attention, yet they are designed from an application’s point of view to be reviewed in cognitive isolation of other one another. Combining this with the observations of when removals occur (Section 5), we can conclude that the positive and negative behavioural effects of other notifications should be considered by applications where feasible.
7. Discussion
The accuracy of many ESM-based applications require avoiding deferment of prompts and obtaining timely re-sponses that capture the user’s experience in a specific en-vironment or context (e.g., mood reporting [45, 46], health reporting [47], or capturing situational understanding [48]). This also applies to applications trying to deliver informa-tion to influence the user in some way (e.g., locainforma-tion-driven recommendations, e.g., [49, 50] or health-based interven-tions, e.g., [51, 52, 53]). However, notifications can be freely pushed by applications for a variety of purposes and subsequently often coexist together in competition, with the empirical analysis conducted highlighting that notifi-cation stacks frequently form (Section 4). This supports the motivation of this paper in questioning a common as-sumption in the literature that notifications are received, interpreted, and responded to in cognitive isolation.
Our analysis has examined user behaviour towards the notification stack, resulting in an overarching finding that the arrival and presence of notifications can positively and negatively impact others. We also find that the behaviour observed is consistent irrespective of the daily time spent on the device and number of notifications received. This forms the primary recommendation of this paper: applications should consider the wider notification stack where
possi-ble in designing their notification’s delivery and reporting potential confounding factors.
It is clear that complex conscious or subconscious pro-cesses are applied in managing stacks of notifications, which may affect the accurate collection and reporting of data from mobile users. In particular, we highlight the following observations and recommendations:
• Users are subjected to large numbers of notifications
and are often faced with multiple, concurrent notifi-cations to review when they use their device. These typically contain notifications from multiple apps and are dealt with frequently (in just under half of all usage sessions). Applications pushing a notification should therefore consider that the user is unlikely to be reviewing it in cognitive isolation of other notifications competing for attention.
• The arrival of a notification from one app may trigger
management of other notifications. Experiments re-porting response rates, or evaluating the effectiveness of delivery decision mechanisms, should record (where possible) the context of other notifications as this can positively and negatively impact the attention that their notification receives.
• The timing of delivery can greatly impact when a
response will likely take place. Those arriving outside of usage are often removed at the start of the next session (but this may not happen immediately), and those that arrive during usage are often removed within that session but are more likely to be deferred to a later session than those arriving outside of usage. This should be carefully considered in notification design, for example to maximise response rates and avoid deferment. Given the potential for this to act as a confounding factor, where possible experiments should record whether the device was in use or not at the point of delivery.
• Notification removals frequently occur at the start
and end of sessions, where users may prolong usage to perform notification management. Applications should consider that if a notification is not responded to immediately, it may have still been successful in grabbing the user’s attention but not prioritised until after other smartphone tasks.
• Users appear to approach management in a top down
fashion, meaning that notifications lower down the priority stack may be easily ignored. Given the com-petition between concurrent notifications within the stack, the notification’s position and deferment across sessions should be regularly reviewed if response rates need to be maximised. However, this should be bal-anced with the potential negative impacts that an interruptive redelivery can have when designing the updated notification’s characteristics.
• Groups of notifications from the same application are
predominantly removed as groups, rather than indi-vidually. This suggests that for applications pushing multiple notifications, the user may limit their atten-tion to the summary notificaatten-tion rather than each individual notification in turn.
• Interruption policies are not widely used and where
they are, behaviour towards the notification stack is not always reflective of the policy. Applications should consider observing the interruption policy but should not assume that it definitively represents user preferences.
• Overall, despite a wide variation in the amount of time
that users spend on their device and the number of no-tifications received, there is little evidence that this is linked to significant differences in how the notification stack is managed.
7.1. Limitations
While the dataset was collected in-the-wild, offering large-scale observation of natural notification behaviour, limitations in the Android APIs available at the time of the study leave unavoidable data gaps and potential sources of bias. For example, API limitations prevented us from knowing the manner in which notifications were removed from the stack (e.g., dismissed, tapped on to open the app, a specific action button, removed by the app, etc.). The ability to collect this information would provide additional granularity and insight. For example, the spike in removals at the start of a usage session could be a combination of user clicks, dismissals, and system removals (due the device waking from sleep) and unfortunately the proportions of each are unknown in the data presented here. Recent modifications to the NotificationListener API now allow data on how a notification was removed to be observed, providing a basis for future work (see Section 7.2). Despite this, it is appropriate to assume that a notification is removed when it no longer offers useful utility (or intended to offer utility), and therefore the conclusions highlighted remain applicable. Additionally, individual applications have fine grained interaction information with their own notifications, with the results here suggesting that, where possible, information about the wider notification presence and behaviour can provide additional utility in the design, delivery, and evaluation processes.
To facilitate large-scale “in-the-wild” data collection, the associated application has to offer enticing features. In doing so, we have introduced additional notifications. How-ever, these represented a small proportion of the dataset and their presence was controllable by each user. Further-more, we did not request access to data that is highly sensitive but could offer further insight, such as application interaction data and notification content, due to privacy concerns, which would also likely deter participation.
We conducted our analysis using a dataset of implicitly machine-collected data, rather than adopting human ex-perience sampling. While the inclusion of qualitative data on the processes adopted would have provided additional insight, the method would not be scalable for this study due to the number of notifications users receive. Addi-tionally, we only observe notification behaviour from usage sessions on the device, and not on companion devices such as smart watches, with previous studies highlighting that notification management can involve multiple devices to different extents [43]. Finally, the analysis examined no-tification stack behaviour holistically in order to expose considerations for individual notifications. However, this does not consider the potential motivational impact [54] that compensation may have on responses to individual responses (e.g., monetary compensation for answering ques-tions for a research study). Nevertheless, the overarching contributions in considering the wider notification stack remain relevant.
7.2. Future work
The findings of this analysis provide a basis for several avenues of future work. Firstly, there would be interest in investigating behaviour towards notification stacks at a finer granularity (e.g., user interface interactions [55] or application switches [56]) in order to determine how management is scheduled around different tasks on the de-vice. Such an approach has been successful in the context of individual interruptions and notifications more broadly (e.g., [9, 31]). Recent changes to the Android’s Notifica-tionListener API since the data in this paper was collected (as discussed in Section 7.1) now offer an opportunity to examine the manner in which a notification was removed, which could expose more specific behaviours to those ob-served. Additionally, the available meta-data surrounding notifications continues to evolve (e.g., Apps can now add a notification ‘category’ to their notifications), as does the ways in which notifications can be managed (e.g., Notifi-cations can now be snoozed). Future work should collect and analyse this additional detail in order to unpick if, and how, these changes affect the behaviours observed.
Secondly, future work can build on these findings by exploring stack behaviour at a personal level to extract insights based on individual differences (as seen in email management [57]). Collecting additional qualitative data surrounding personal motivation and reasoning behind the observed behaviour could further inform the recommen-dations proposed in this study. Finally, in the context of applications collecting data through notification responses (e.g., experience sampling), the results motivate further explicit experimentation into the impact of stack-based strategies for notification delivery.
8. Conclusions
Notifications offer valuable utility, however their fre-quency creates a persistent stream of content that needs
regular management, with the wide diversity in their design increasing the complexity of doing so further. A typical convention in the study of notification management has been to examine the response processes to a set of individ-ual notifications [20] and build design considerations from aggregated findings (e.g., [3, 7, 10, 12]). However, this does not consider that notifications frequently coexist together and the potential behavioural effects from this.
Using a dataset of over 30 million notifications across 1889 users, collected in an in-the-wild context, we have examined the extent in which notifications coexist and form a stack. From this, we have explored behavioural patterns concerning when and how the notification stack is reviewed and removed across periods of device usage, in which we find that the arrival and presence of notifications can have positive and negative behavioural effects on one another. Overall, we conclude that examining notification management from the wider viewpoint of notification stacks has utility as it captures additional behavioural insights in comparison to considering individual notifications in isola-tion. For applications where a timely response is important, such as those adopting experience sampling, this presents considerations for the design and delivery of notifications, as well as during reflections on why a notification was or was not responded to.
References
[1] A. Sahami Shirazi, N. Henze, T. Dingler, M. Pielot, D. Weber, A. Schmidt, Large-scale assessment of mobile notifications, in: Proc. CHI’14, ACM, 2014, pp. 3055–3064.
[2] C. Stothart, A. Mitchum, C. Yehnert, The attentional cost of receiving a cell phone notification., Journal of experimental psychology: human perception and performance 41 (4) (2015) 893.
[3] V. Pejovic, M. Musolesi, Interruptme: designing intelligent prompting mechanisms for pervasive applications, in: Proc. UbiComp’14, ACM, 2014, pp. 897–908.
[4] N. V. Berkel, D. Ferreira, V. Kostakos, The experience sampling method on mobile devices, ACM Computing Surveys (CSUR) 50 (6) (2017) 93.
[5] L. D. Turner, S. M. Allen, R. M. Whitaker, Reachable but not receptive: Enhancing smartphone interruptibility prediction by modelling the extent of user engagement with notifications, Pervasive and Mobile Computing 40 (2017) 480–494.
[6] A. Mehrotra, V. Pejovic, J. Vermeulen, R. Hendley, M. Musolesi, My phone and me: Understanding people’s receptivity to mobile notifications, in: Proc. CHI’16, ACM, 2016, pp. 1021–1032. [7] A. Mehrotra, R. Hendley, M. Musolesi, V. Pejovic, Designing
content-driven intelligent notification mechanisms for mobile applications, in: Proc. UbiComp’15, ACM, 2015.
[8] M. B¨ohmer, C. Lander, S. Gehring, D. P. Brumby, A. Kr¨uger, Interrupted by a phone call: Exploring designs for lowering the impact of call notifications for smartphone users, in: Proc. CHI’14, ACM, 2014, pp. 3045–3054.
[9] T. Okoshi, J. Ramos, H. Nozaki, J. Nakazawa, A. K. Dey, H. Tokuda, Attelia: Reducing user’s cognitive load due to in-terruptive notifications on smart phones, in: Proc. PerCom’15, IEEE, 2015, pp. 96–104.
[10] A. Visuri, N. van Berkel, C. Luo, J. Goncalves, D. Ferreira, V. Kostakos, Predicting interruptibility for manual data collec-tion: a cluster-based user model, in: Proc. MobileHCI’17, ACM, 2017, p. 12.
[11] J. E. Fischer, N. Yee, V. Bellotti, N. Good, S. Benford, C. Green-halgh, Effects of content and time of delivery on receptivity to mobile interruptions, in: Proc. MobileHCI’10, ACM, 2010, pp. 103–112.
[12] M. Pielot, R. de Oliveira, H. Kwak, N. Oliver, Didn’t you see my message?: predicting attentiveness to mobile instant messages, in: Proc. CHI’14, ACM, 2014, pp. 3319–3328.
[13] F. Yuan, X. Gao, J. Lindqvist, How busy are you?: Predicting the interruptibility intensity of mobile users, in: Proc. CHI’17, ACM, 2017, pp. 5346–5360.
[14] M. Pielot, K. Church, R. de Oliveira, An in-situ study of mobile phone notifications, in: Proc. MobileHCI’14, Vol. 14, 2014. [15] L. D. Turner, S. M. Allen, R. M. Whitaker, Push or delay?
decomposing smartphone notification response behaviour, in: Human Behavior Understanding, Vol. 9277 of Lecture Notes in Computer Science, Springer International Publishing, 2015, pp. 69–83.
[16] A. Mathur, N. D. Lane, F. Kawsar, Engagement-aware comput-ing: modelling user engagement from mobile contexts, in: Proc. UbiComp’16, ACM, 2016, pp. 622–633.
[17] B. Poppinga, W. Heuten, S. Boll, Sensor-based identification of opportune moments for triggering notifications, Pervasive Computing, IEEE 13 (1) (2014) 22–29.
[18] H. Lopez-Tovar, A. Charalambous, J. Dowell, Managing smart-phone interruptions through adaptive modes and modulation of notifications, in: Proc. IUI’15, ACM, 2015, pp. 296–299. [19] M. Choy, D. Kim, J.-G. Lee, H. Kim, H. Motoda, Looking
back on the current day: interruptibility prediction using daily behavioral features, in: Proc. UbiComp’16, ACM, 2016, pp. 1004–1015.
[20] L. D. Turner, S. M. Allen, R. M. Whitaker, Interruptibility pre-diction for ubiquitous systems: Conventions and new directions from a growing field, in: Proc. UbiComp’15, ACM, 2015, pp. 801–812.
[21] C. Grevet, D. Choi, D. Kumar, E. Gilbert, Overload is over-loaded: email in the age of gmail, in: Proc. CHI’14, ACM, 2014, pp. 793–802.
[22] S. Pizza, B. Brown, D. McMillan, A. Lampinen, Smartwatch in vivo, in: Proc. CHI’16, ACM, 2016, pp. 5456–5469.
[23] D. McFarlane, K. Latorella, The scope and importance of human interruption in human-computer interaction design, Human-Computer Interaction 17 (1) (2002) 1–61.
[24] Y.-J. Chang, J. C. Tang, Investigating mobile users’ ringer mode usage and attentiveness and responsiveness to communication, in: Proc. MobileHCI’15, ACM, 2015, pp. 6–15.
[25] F. Schulze, G. Groh, Conversational context helps improve mo-bile notification management, in: Proc. Momo-bileHCI’16, ACM, 2016, pp. 518–528.
[26] M. Z¨uger, T. Fritz, Interruptibility of software developers and its prediction using psycho-physiological sensors, in: Proc. CHI’15, ACM, 2015, pp. 2981–2990.
[27] S. Grandhi, Q. Jones, Knock, knock! who’s there? putting the user in control of managing interruptions, International Journal of Human-Computer Studies 79 (2015) 35–50.
[28] R. Fisher, R. Simmons, Smartphone interruptibility using density-weighted uncertainty sampling with reinforcement learn-ing, in: ICMLA’11, Vol. 1, IEEE, 2011, pp. 436–441.
[29] S. Grandhi, Q. Jones, Technology-mediated interruption man-agement, International Journal of Human-Computer Studies 68 (5) (2010) 288–306.
[30] S. T. Iqbal, B. P. Bailey, Effects of intelligent notification man-agement on users and their tasks, in: Proc. CHI’08, ACM, 2008, pp. 93–102.
[31] S. T. Iqbal, B. P. Bailey, Oasis: A framework for linking notifi-cation delivery to the perceptual structure of goal-directed tasks, ACM Transactions on Computer-Human Interaction (TOCHI) 17 (4) (2010) 15.
[32] A. Voit, B. Poppinga, D. Weber, M. B¨ohmer, N. Henze, S. Gehring, T. Okoshi, V. Pejovic, Ubittention: smart & ambient notification and attention management, in: Proc. UbiComp’16 (Adjunct), ACM, 2016, pp. 1520–1523.
[33] A. Mehrotra, R. Hendley, M. Musolesi, Prefminer: mining user’s preferences for intelligent mobile notification management, in: Proc. UbiComp’16, ACM, 2016, pp. 1223–1234.
[34] D. Weber, A. Voit, J. Auda, S. Schneegass, N. Henze, Snooze!: investigating the user-defined deferral of mobile notifications, in: Proc. MobileHCI’18, ACM, 2018, p. 2.
[35] T. Dingler, M. Pielot, I’ll be there for you: Quantifying attentive-ness towards mobile messaging, in: Proc. MobileHCI’15, ACM, 2015, pp. 1–5.
[36] D. Weber, A. Voit, N. Henze, Notification log: An open-source framework for notification research on mobile devices, in: Proc. UbiComp’18, ACM, 2018, pp. 1271–1278.
[37] C. N. Scollon, C.-K. Prieto, E. Diener, Experience sampling: promises and pitfalls, strengths and weaknesses, Journal of Happiness Studies 4 (2003) 5–34.
[38] M. Pielot, A. Vradi, S. Park, Dismissed!: a detailed exploration of how mobile phone users handle push notifications, in: Proc. MobileHCI’18, ACM, 2018, p. 3.
[39] T. Soikkeli, J. Karikoski, H. Hammainen, Diversity and end user context in smartphone usage sessions, in: 2011 Fifth Inter-national Conference on Next Generation Mobile Applications, Services and Technologies, IEEE, 2011, pp. 7–12.
[40] C. Jesdabodi, W. Maalej, Understanding usage states on mobile devices, in: Proc. UbiComp’15, ACM, 2015, pp. 1221–1225. [41] A. Oulasvirta, T. Rattenbury, L. Ma, E. Raita, Habits make
smartphone use more pervasive, Personal and Ubiquitous Com-puting 16 (1) (2012) 105–114.
[42] C. Shin, A. K. Dey, Automatically detecting problematic use of smartphones, in: Proc. UbiComp’13, ACM, 2013, pp. 335–344. [43] D. Weber, A. Voit, P. Kratzer, N. Henze, In-situ investigation of notifications in multi-device environments, in: Proc. Ubi-Comp’16, ACM, 2016, pp. 1259–1264.
[44] A. Voit, D. Weber, N. Henze, Qualitative investigation of multi-device notifications, in: Proc. UbiComp’18, ACM, 2018, pp. 1263–1270.
[45] R. LiKamWa, Y. Liu, N. D. Lane, L. Zhong, Moodscope: Build-ing a mood sensor from smartphone usage patterns, in: Proc. MobiSys’13, ACM, 2013, pp. 389–402.
[46] B. No¨e, L. D. Turner, D. E. Linden, S. M. Allen, G. R. Maio, R. M. Whitaker, Timing rather than user traits mediates mood sampling on smartphones, BMC research notes 10 (1) (2017) 481.
[47] A. Gaggioli, G. Pioggia, G. Tartarisco, G. Baldus, D. Corda, P. Cipresso, G. Riva, A mobile data collection platform for mental health research, Personal and Ubiquitous Computing 17 (2) (2013) 241–251.
[48] Y.-J. Chang, G. Paruthi, H.-Y. Wu, H.-Y. Lin, M. W. Newman, An investigation of using mobile and situated crowdsourcing to collect annotated travel activity data in real-word settings, International Journal of Human-Computer Studies 102 (2017) 81–102.
[49] T. Sohn, K. A. Li, G. Lee, I. Smith, J. Scott, W. G. Griswold, Place-its: A study of location-based reminders on mobile phones, in: Proc. UbiComp’05, Springer, 2005, pp. 232–250.
[50] S. Rodriguez Garzon, B. Deva, Geofencing 2.0: taking location-based notifications to the next level, in: Proc. UbiComp’14, ACM, 2014, pp. 921–932.
[51] M. D. Rodr´ıguez, J. R. Roa, A. L. Mor´an, S. Nava-Mu˜noz, Cammina: a mobile ambient information system to motivate elders to exercise, Personal and ubiquitous computing 17 (6) (2013) 1127–1134.
[52] F. Gravenhorst, A. Muaremi, J. Bardram, A. Gr¨unerbl, O. May-ora, G. Wurzer, M. Frost, V. Osmani, B. Arnrich, P. Lukowicz, et al., Mobile phones as medical devices in mental disorder treat-ment: an overview, Personal and Ubiquitous Computing 19 (2) (2015) 335–353.
[53] C. Horsch, S. Spruit, J. Lancee, R. van Eijk, R. J. Beun, M. Neer-incx, W.-P. Brinkman, Reminders make people adhere better to a self-help sleep intervention, Health and Technology (2016) 1–16.
Improv-ing accuracy in mobile human contributions: An overview, in: Proc. UbiComp’18, ACM, 2018, pp. 594–599.
[55] T. Okoshi, H. Nozaki, J. Nakazawa, H. Tokuda, J. Ramos, A. K. Dey, Towards attention-aware adaptive notification on smart phones, Pervasive and Mobile Computing 26 (2016) 17–34. [56] L. D. Turner, R. M. Whitaker, S. M. Allen, D. E. Linden, K. Tu,
J. Li, D. Towsley, Evidence to support common application switching behaviour on smartphones, Royal Society Open Science 6 (3).
[57] J. Gwizdka, Email task management styles: the cleaners and the keepers, in: Proc. CHI’04 (EA), ACM, 2004, pp. 1235–1238.
Author Declaration