Journal:
Drug Metabolism & Disposition
Title:
Effects of Dose, Administration Route and/or Vehicle on
Decabromodiphenyl Ether (DecaBDE) Concentrations in Plasma
of Maternal, Fetal and Neonatal Rats and in Milk of Maternal Rats
Authors:
John A. Biesemeier, Melissa J. Beck, Hanna Silberberg, Nicole
R. Myers, John M. Ariano, Eric S. Bodle, Daniel W. Sved, Sylvia
Jacobi, Donald G. Stump, Marcia Hardy, Todd Stedeford
SUPPLEMENTAL INFORMATION, FIGURE, & TABLES
Materials and Methods... 2
Chemicals... 2
Test Substance Formulations ... 2
Animal use and care... 3
Clinical and Pathological Exams ... 3
Plasma and Milk Extraction... 4
Analysis of Plasma and Milk ... 4
Statistics ... 5
Results... 5
Analysis of Test Substance Formulations... 5
In vivo data: F0 Females ... 5
In vivo data: F1 Pups... 6
References... 7
Supplemental Figure ... 9
Materials and Methods
Chemicals
Homogeneity of the DecaBDE composite was demonstrated by confirming that six samples (2 top, 2 middle and 2 bottom with 1 each from the right and left sides of the bulk composite container) had a purity that was equal to or less than a 5% difference from the mean BDE-209 area % for the six samples analyzed.
Test Substance Formulations
The test substance was mixed with vehicle (CO or SPL) to achieve the desired concentrations with no adjustment for purity. CO was used as provided by the manufacturer. The SPL vehicle was prepared by adding phospholipon 90 NG and Lutrol® F 127 NF Prill (16:34, w/w) to deionized water. Stirring was maintained until the preparation was uniform.
Test substance-vehicle (CO or SPL) formulations were prepared weekly or as required, divided into daily dispensation aliquots and protected from light while stored refrigerated until needed. A pre-determined amount of test substance was weighed into calibrated glass containers. Vehicle (CO or SPL) was then added and contents stirred with a magnetic stir bar until suspension was uniform. Before the suspension was adjusted to final volume, homogenization was done for 5 minutes using a Silverson L4RT or L4RT-A electric homogenizer. SPL-test substance formulations were further stirred for approximately 30 minutes prior to dosing the animals. All test substance formulations were stirred continuously throughout the preparation, sampling, and dose administration procedures.
Prior to use, one mL aliquots of the test substance formulations at nominal DecaBDE concentrations of 4, 20, 60 and 200 mg/mL in CO and 4 and 200 mg/mL in SPL were analyzed for concentration correctness and homogeneity. In addition, the test substance formulations were analyzed for re-suspension homogeneity and stability after refrigerated storage for up to 10 days and when protected from light. Homogeneity and concentration verification samples were collected in duplicate from the top, middle and bottom strata of the test substance-vehicle formulations, while duplicate samples were also collected from near the middle stratum of both vehicle containers. Samples were collected from the top and bottom strata after ten days of refrigerated storage and with light protection to assess resuspension homogeneity.
Dosing formulations at concentrations of 4 to 200 mg/mL in CO or SPL were analyzed for BDE-209 congener concentration using a validated gas chromatograph method (Coffee, 2008). Quantitation was performed using calibration standards prepared using DecaBDE at concentrations ranging from 10.0 to 30.0 µg/mL. Assay precision and accuracy were verified by the analysis of quality control (QC) samples prepared at concentrations ranging from 4.00 to 200 mg/mL for both vehicles. A 1-mL sample representing each of the vehicle-prepared test substance formulations and the quality control samples were extracted with either toluene (CO formulations) or tetrahydrofuran (THF)(SPL formulations). Secondary dilutions were performed directly in autosampler vials to achieve final concentrations within the calibration curve. Again, quantitation was based on the BDE-209 congener. The analysis was performed on an Agilent 6890 gas chromatograph equipped with an electron capture detector (315 °C), HP 7673 autosampler, Dionex Chromeleon or equivalent data system, splitless injector (290 °C) and Restek MXT-1 column (6 m x 0.28 mm ID, 0.1-µm film thickness). The cyclic temperature was programmed. The initial temperature was held for 1 minute at 50 °C before it was ramped at 40 °C/min to 310 °C and held for 4 minutes. Helium was the carrier gas at a flow rate of 1.8 mL/min. BDE-209’s retention time under these conditions was approximately 7.7 minutes. In
addition to the experimental samples, each set of analyses consisted of, but was not limited to, calibration standards prepared in triplicate at 5 concentrations and triplicate QC samples at 3 concentrations. For an analytical run to be considered valid, at least two-thirds of the QC samples, with at least one at each concentration was required to be within 85% to 115% of the QC target concentrations. All reported results are from analytical runs meeting the acceptance criteria.
Animal use and care
All rats obtained from Charles Rivers Laboratories, Inc., were examined on the day of receipt, individually identified with a Monel® metal ear tag, and body weights recorded the following day. Upon arrival animals were acclimated at the test laboratory before they were mated and randomly assigned to a test group. Animals were individually housed in clean stainless steel, wire-mesh, cages that were suspended above cage board. Analyses of animal feed and water indicated that no contaminants were present at concentrations sufficient to interfere with the study.
Depending on the treatment groups to which the animals were randomly assigned, the acclimation period was for either 9 days (Groups 1 through 6) or 22 days (Group 7 and 8; Table 1). Bred females were individually housed in plastic maternity cages with nesting material (Bed-O’Cobs®; The Andersons Cob Products Division, Maumee, OH) that the manufacturer periodically analyzes for contaminants. No contaminants were identified in the bedding at concentrations sufficient to interfere with the outcome of the study.
Clinical and Pathological Exams F0 Females
All animals were observed twice daily for morbidity and mortality. Clinical observations and signs of toxicity were recorded daily prior to and 1 hour post-dosing in Groups 1 through 4, 7 and 8. Body weights and food consumption were measured on GD 0, 6, 9, 12, 15, 18 and 20, and on LD 1, 4, 7, 11, 14, 17, 21 and 22.
F0 females selected for the gestational exposure assessment were euthanized by CO2
inhalation prior to blood collection on GD 20. The uterus of each female was examined and those uteri with no macroscopic evidence of implantation were stained with ammonium sulfide (Salewski, 1964). The carcasses were discarded without further examination.
F0 females used for lactational exposure assessment and their litters were euthanized by
CO2 inhalation on LD 22. F0 females that did not deliver by or on post-mating day 25 and those
sacrificed on LD 4, due to culling of their entire litter or within 24 hours of total litter loss, were also euthanized by CO2 inhalation. Ten females/group were randomly selected from those
euthanized on LD 22 and subjected to a gross necropsy. The pregnancy status of females failing to deliver was determined with specific emphasis on anatomic and/or pathologic findings that may have interfered with the pregnancy going to term. Tissues were preserved in 10% neutral-buffered formalin for possible future histopathologic examination.
F1 Pups
The number of stillbirths and live pups were recorded on PND 0. Pups were sexed and examined for gross malformations. Pups were individually identified by tattoo markings of their digits. Offspring dying or euthanized in extremis from PNDs 0 through 4 in Groups 1 through 4,
7 and 8 were examined externally and sexed. A detailed gross necropsy was performed on any pup dying after PND 4.
Litters were examined daily for mortality and morbidity. Clinical observations for appearance, behavior and overt signs of toxicity were performed on PND 1, 4, 7, 11, 14, 17, 21 and 22. Any abnormalities in nursing behavior were recorded. Pups were individually weighed on PND 1, 4, 7, 11, 14 and 21, and sexed on PND 0 (when possible), 4, 11 and 21. Pups that were found dead on PNDs 5 through 22 were subjected to a gross necropsy. Litters from F0
females sacrificed on PND 22 were necropsied.
Plasma and Milk Extraction
Aliquots (100 µL) for the calibration, QC and plasma samples were combined with 50 µL of the IS. No IS was added to the solvent and plasma blanks, and plasma plus analyte specificity samples. THF (10 µL) was also added to each experimental sample. Each calibration, QC, specificity and experimental sample tube received 500 µL of 6 N HCl, 500 µL of isopropanol and 4 mL of 1:1 hexane:methyl tert-butyl ether (MTBE) and shaken for a minimum of 10 minutes. The samples were then centrifuged for 10 minutes at 2000 relative centrifugal force [rcf]) before the transfer of the organic phase to a clean glass tube. An additional 4 mL of 1:1 hexane:MTBE was added and the tubes shaken and centrifuged as previously described. The organic layer was decanted and combined with the first. The samples were evaporated to a volume of approximately 1 mL under a stream of nitrogen at 40 °C, NaOH in 50% EtOH (0.5 M, 1.0 mL) added, shaken and centrifuged and the organic phase removed as described. 6 N HCl (1.0 mL) and 1:1 hexane:MTBE (2 mL) was added to the aqueous phase, shaken and centrifuged and the organic phase added to the first organic extract. The samples were evaporated to dryness under nitrogen, toluene (200 µL) added, mixed and transferred to autosampler vials with limited volume inserts. The samples were evaporated to dryness, and toluene (40 µL) added and mixed. Milk samples were processed as described for plasma, except as noted. After combining the 1:1 hexane:MTBE extracts, samples were evaporated to dryness under nitrogen at 60 °C, 6 N NaOH (1.0 mL) added and the samples heated with boiling water for 1 hour and cooled in an ice water bath. Four (4) mL of 1:1 hexane:MTBE was added, shaken, and centrifuged for 10 minutes at 2000 rcf. After centrifugation, 3.5 mL of the organic layer was transferred to a clean glass tube. Thereafter, processing steps for milk were the same as for plasma except that 80 µL of toluene, instead of 40 µL, was added at the last step.
Analysis of Plasma and Milk
Rat plasma and milk samples were analyzed by gas chromatography (Agilent 6890N) - mass spectrometry (Agilent 5975C) equipped with an electron impact (EI) ionization source. The method was validated prior to use with 100 µLs injection volumes at DecaBDE concentrations ranging from 25 to 2500 ng/mL, DecaBDE-spiked rat plasma ranging from 1000 to 6000 ng/mL and DecaBDE-spiked milk ranging from 250 to 6000 ng/mL (O'Lear, 2009). The method used liquid-liquid extraction of DecaBDE and the IS (13C12DecaBDE) from 100 µL of
rat plasma or milk. For an analytical run to be considered valid, at least two-thirds of the QC samples with at least one-third at each level had to be 85% to 115% of the target QC concentration.
The limit of quantitation was 25 µg/mL for plasma, but varied for milk samples due to insufficient volume. The GC conditions were DB-1MS column (3.0 m x 0.1 mm ID, 0.1 µm film thickness); injector temperature of 270 °C; pulsed split-less injection with pulse pressure of
56.0 psi and a pulse time of 2.00 minutes and temperature programming as follows: initial temperature 100 °C, hold for 1 minute, ramp at 40 °C/min to 310 °C, hold at 310 °C for 2.00 minutes. Helium served as the carrier gas at a flow rate of 1.0 mL/min. The retention time for BDE-209 and the IS was approximately 6.5 minutes and the run time was approximately 8.25 minutes. The MS acquisition parameters that were selected were the ion monitoring (SIM) mode, solvent delay of 3.00 minutes, EI ion source, low resolution, transfer line temperature of 320 °C, MS Quad temperature of 150 °C and MS source temperature of 230 °C. The masses (amu) monitored for BDE-209 were 799.3, 797.3, 792.4 and 399.7 with a dwell time of 100 msec at each mass. The mass monitored for the IS was 405.8 with a similar dwell time. The mass of 465.0 amu was also monitored.
Statistics
Statistical analyses were not performed on the plasma and milk concentration data. For the other included endpoints, analyses were conducted using two-tailed tests (except as noted) for minimum significance levels of 1% and 5% for comparing each test substance-treated group to the control group by sex. Data obtained from nongravid animals were excluded from statistical analyses. Where applicable, the litter was used as the experimental unit.
Mean maternal and offspring body weights, body weight gains, maternal food consumption, gestation lengths, implantation sites, unaccounted-for sites, numbers of pups born and live litter sizes were analyzed using a parametric one-way analysis of variance (ANOVA) to determine intergroup differences (Snedecor and Cochran, 1980). If the ANOVA revealed statistically significant (p<0.05) intergroup variance, Dunnett’s test was used to compare the test substance-treated groups to their respective control group (Dunnett, 1964). For the PND 4 phase (Group 5 and 6; Table 1), statistical analysis was performed on mean offspring body weights only. Mean litter proportions (%/litter) of pup viability and males per litter were analyzed with Kruskal-Wallis nonparametric ANOVA to determine intergroup differences (Kruskal and Wallis, 1952). If the ANOVA revealed statistically significant (p<0.05) intergroup differences, Dunn’s test was used to compare the test substance-treated groups to their respective control group (Dunn, 1964).
Results
Analysis of Test Substance Formulations
Assay specificity/selectivity was confirmed when GC/ECD analysis of the vehicles revealed no significant peaks at or near the retention time of BDE-209. The concentration, homogeneity and stability of the test substance in both vehicles after refrigerated storage for 10 days were within the pre-set criteria, i.e., the RSD for the mean test substance concentration was
≤10% and within the target limits of 85% to 115%. The test substance was not detected in the vehicles used for the control groups.
In vivo data: F0 Females
Morbidity and Mortality
There were no test substance-related mortalities during the study. No clinical signs of toxicity were noted at 1 hour post-dosing or during the daily observations.
Body Weight and Food Consumption
No test substance-related differences in mean body weight, body weight gain or food consumption were detected during gestation (Tables S1 through S3). Prior to dose administration (GDs 0 through 6), females designated to receive the test substance in CO at 300 and 1000 mg/kg/day gained statistically significantly (p<0.05 and 0.01, respectively) less weight than those assigned to the control group. Further, mean body weights in these two groups were statistically significantly (p<0.05 or 0.01) lower than that of the CO control group on GD 9 and 12. These body weight differences were attributed to the lower body weight gains that occurred prior to dose administration and, therefore, unrelated to the test substance administration. The absence of changes in body weight from other studies with DecaBDE supports this interpretation (NTP, 1986; Hardy et al., 2002). Furthermore, mean body weight gains during GDs 6 through 9 and 9 through 12 were comparable to the CO control group.
No test substance-related differences in mean body weight or body weight gain were detected during lactation, except at one time point. Body weight gain was statistically significantly (p<0.05) increased in the SPL 1000 mg/kg/day group, when compared to the SPL control group during LDs 17 through 21.
Food consumption during lactation was comparable among the control and treated animals administered the test substance in CO. Mean food consumption was statistically significantly (p<0.05 or 0.01) increased in the SPL 1000 mg/kg/day group, when compared to the SPL control group over LDs 11 through 24, 14 through 17, 17 through 21, 21 through 22 and 1 through 22. Food consumption in the SPL 1000 mg/kg/day group was generally similar to that of the CO control over these intervals, as was the case with body weight gain, but was not compared statistically.
Pregnancy Status, Gestational Length, Parturition
Test substance administration at all dose levels in either vehicle did not affect gestational or litter parameters (Table S4). Mean gestational length in treated animals was comparable to their respective vehicle controls and similar to the laboratory’s historical control database (mean gestation length = 21.9 days). No signs of dystocia were observed in any group.
Necropsy
No macroscopic test substance-related findings were observed regardless of dose or vehicle. Macroscopic findings in treated groups were infrequent, at similar frequencies as in the control groups and/or in a manner that was not test substance exposure-related.
The number of former implantations and unaccounted-for-sites were similar in control and treated groups irrespective of vehicle on LD 22. While the mean number of unaccounted-for-sites in the CO 1000 mg/kg/day group was 1.5 sites/dam, when compared to 0.6 sites/dam in the CO control, this difference was attributed to a single female with 8 unaccounted-for-sites. Excluding this female, the group mean of the remaining females was 0.8 sites/dam.
In vivo data: F1 Pups
Morbidity and Mortality
The mean number of pups born, percentage of males at birth, mean live litter size and postnatal survival were similar between control groups and their respective treatment groups (Table S4). The number of pups found dead, euthanized in extremis and/or missing and their
general physical condition was unaffected by maternal administration of the test substance in either vehicle.
Body Weight and Body Weight Gain
Mean offspring body weights and weight gains through PND 21 in the CO treated groups were similar to CO controls and/or laboratory historical control means (Tables 2 and S5). Two statistically significant differences in body weight gain were noted at one time point PNDs 14 through 17, but were considered not test substance-related.
Body weights of male and female pups in the SPL 1000 mg/kg/day group were higher than their respective SPL control group on PND 7, 11 (females only), 14 and 21 (p<0.05 or 0.01) (Table 2). Body weight gains were also increased in the SPL 1000 mg/kg/day male and female pups on PNDs 4 through 7 and 17 through 21 (Table S5). In contrast, mean body weights in the SPL-control group were consistently lower than that of litters derived from CO control dams. Furthermore, body weight gains by SPL-control pups of both sexes were found to be approximately 66% to 88% of the CO control pups’ gains.
Necropsy
The number of pups (litters) found dead or euthanized in extremis was 12 (5), 14 (9), 11
(7) and 10 (8) in the CO control, 100, 300 and 1000 mg/kg/day groups, respectively, and 18 (7) and 25 (10) in the SPL control and 1000 mg/kg/day groups, respectively. Hydrocephaly was found during necropsy of a pup euthanized in extremis from the CO 1000 mg/kg/day group.
This represented a single finding out of a total of 89 pups from this dose level or out of a total of 274 pups from all three CO dose levels. Necropsy results were unremarkable in other pups that were found dead, euthanized in extremis, or at scheduled necropsy on PND 22.
References
Coffee ST (2008) Development and validation of a GC-ECD assay for the determination of decabromodiphenyl oxide (Debdpo) concentration in corn oil (Study No. WIL-635-004), WIL Research Laboratories, LLC, Ashland, Ohio.
Dunn OJ (1964) Multiple comparisons using rank sums. Technometrics6:241-252.
Dunnett CW (1964) New tables for multiple comparisons with a control. Biometrics20:482-491. Hardy ML, Schroeder R, Biesemeier J and Manor O (2002) Prenatal Oral (Gavage)
Developmental Toxicity Study of Decabromodiphenyl Oxide in Rats. International Journal of Toxicology21:83 - 91.
Kruskal WH and Wallis WA (1952) Use of ranks in one-criterion variance analysis. J Amer Statist Assn47:583-621.
NTP (1986) Toxicology and Carcinogenesis Studies of Decabromodiphenyl Oxide (CAS No. 1163-19-5) in F344/N Rats and B6C3F1 Mice (Feed Studies). Technical Report Series
No. 309:1-242.
O'Lear JR (2009) Development and validation of GC/MS assays for the determination of decabromodiphenyl oxide (DEBDPO) concentration in rat plasma and rat milk (Study No. WIL-635003), WIL Research Laboratories, LLC, Ashland, OH.
Salewski E (1964) Färbemethode zum makroskopischen Nachweis von Implantationsstellen am Uterus der Ratte [Staining method for a macroscopic test for implantation sites in the uterus of the rat]. Naunyn Schmiedebergs Arch Pharmacol247:367.
Snedecor GW and Cochran WG (1980) One way classifications; Analysis of variance, in:
Supplemental Figure O Br Br Br Br Br Br Br Br Br Br
Supplemental Tables
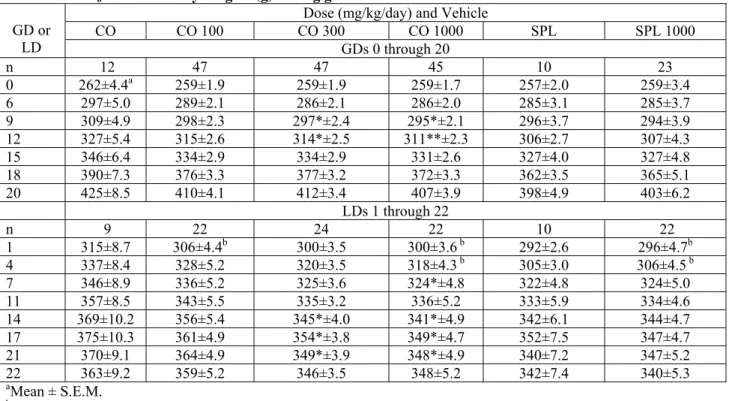
TABLE S1. F0 maternal body weights (g) during gestation and lactation.
Dose (mg/kg/day) and Vehicle
CO CO 100 CO 300 CO 1000 SPL SPL 1000 GD or LD GDs 0 through 20 n 12 47 47 45 10 23 0 262±4.4a 259±1.9 259±1.9 259±1.7 257±2.0 259±3.4 6 297±5.0 289±2.1 286±2.1 286±2.0 285±3.1 285±3.7 9 309±4.9 298±2.3 297*±2.4 295*±2.1 296±3.7 294±3.9 12 327±5.4 315±2.6 314*±2.5 311**±2.3 306±2.7 307±4.3 15 346±6.4 334±2.9 334±2.9 331±2.6 327±4.0 327±4.8 18 390±7.3 376±3.3 377±3.2 372±3.3 362±3.5 365±5.1 20 425±8.5 410±4.1 412±3.4 407±3.9 398±4.9 403±6.2 LDs 1 through 22 n 9 22 24 22 10 22 1 315±8.7 306±4.4b 300±3.5 300±3.6 b 292±2.6 296±4.7b 4 337±8.4 328±5.2 320±3.5 318±4.3 b 305±3.0 306±4.5 b 7 346±8.9 336±5.2 325±3.6 324*±4.8 322±4.8 324±5.0 11 357±8.5 343±5.5 335±3.2 336±5.2 333±5.9 334±4.6 14 369±10.2 356±5.4 345*±4.0 341*±4.9 342±6.1 344±4.7 17 375±10.3 361±4.9 354*±3.8 349*±4.7 352±7.5 347±4.7 21 370±9.1 364±4.9 349*±3.9 348*±4.9 340±7.2 347±5.2 22 363±9.2 359±5.2 346±3.5 348±5.2 342±7.4 340±5.3 aMean ± S.E.M. bn=23.
*Treatment group statistically different from same-vehicle-control (p<0.05). **Treatment group statistically different from same-vehicle-control (p<0.01).
TABLE S2. F0 maternal body weight gain (g) during gestation and lactation.
Dose (mg/kg/day) and Vehicle
CO CO 100 CO 300 CO 1000 SPL SPL 1000 GD or LD GDs 0 through 20 n 12 47 47 45 10 23 0-6 36±2.8a 29±1.2 27*±1.4 26**±1.4 28±2.9 25±1.6 6-9 12±1.7 10±0.9 11±0.7 10±1.0 11±1.7 9±1.2 9-12 18±1.1 16±0.7 17±0.7 16±0.9 10±1.7 13±1.4 12-15 19±2.7 20±0.9 20±0.9 20±0.9 21±2.0 20±1.3 15-18 44±1.8 42±1.0 43±0.9 42±1.2 35±2.1 38±1.6 18-20 35±2.0 34±1.2 35±1.0 34±1.1 37±2.2 37±2.1 6-20 128±5.5 121±3.0 126±2.3 122±2.9 113±3.3 118±3.7 LDs 1 through 22 n 9 22 24 22 10 22 1-4 22±3.1 21±2.8 21±2.0 18±2.0 b 14±2.2 10±1.8b 4-7 9±3.7 8±1.8 5±2.3 5±2.0 17±4.1 16±2.1 7-11 11±3.5 7±2.6 10±2.1 12±2.6 11±3.7 10±1.7 11-14 12±6.0 13±2.7 10±2.4 5±2.0 9±3.2 11±2.0 14-17 6±4.3 5±2.4 8±1.8 8±2.6 11±4.6 3±2.8 17-21 -5±4.6 3±2.1 -5±2.2 -1±2.4 -12±4.1 0*±2.2 21-22 -7±2.9 -4±1.8 -3±1.9 -1±2.1 2±3.6 -7±2.5 1-22 48±4.0 53±3.0 46±3.0 47±3.4 51±6.7 43±3.3 aMean ± S.E.M. bn= 23.
*Treatment group statistically different from same-vehicle-control (p<0.05). **Treatment group statistically different from same-vehicle-control (p<0.01).
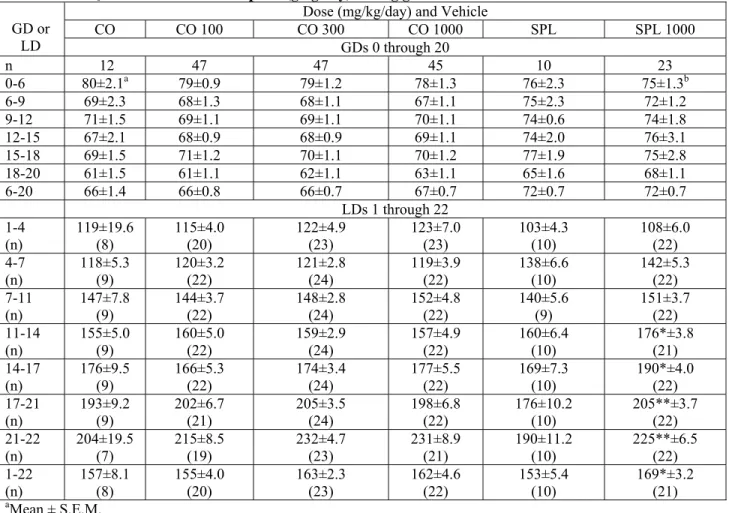
TABLE S3. F0 maternal food consumption (g/kg/day) during gestation and lactation.
Dose (mg/kg/day) and Vehicle
CO CO 100 CO 300 CO 1000 SPL SPL 1000 GD or LD GDs 0 through 20 n 12 47 47 45 10 23 0-6 80±2.1a 79±0.9 79±1.2 78±1.3 76±2.3 75±1.3b 6-9 69±2.3 68±1.3 68±1.1 67±1.1 75±2.3 72±1.2 9-12 71±1.5 69±1.1 69±1.1 70±1.1 74±0.6 74±1.8 12-15 67±2.1 68±0.9 68±0.9 69±1.1 74±2.0 76±3.1 15-18 69±1.5 71±1.2 70±1.1 70±1.2 77±1.9 75±2.8 18-20 61±1.5 61±1.1 62±1.1 63±1.1 65±1.6 68±1.1 6-20 66±1.4 66±0.8 66±0.7 67±0.7 72±0.7 72±0.7 LDs 1 through 22 1-4 (n) 119±19.6 (8) 115±4.0 (20) 122±4.9 (23) 123±7.0 (23) 103±4.3 (10) 108±6.0 (22) 4-7 (n) 118±5.3 (9) 120±3.2 (22) 121±2.8 (24) 119±3.9 (22) 138±6.6 (10) 142±5.3 (22) 7-11 (n) 147±7.8 (9) 144±3.7 (22) 148±2.8 (24) 152±4.8 (22) 140±5.6 (9) 151±3.7 (22) 11-14 (n) 155±5.0 (9) 160±5.0 (22) 159±2.9 (24) 157±4.9 (22) 160±6.4 (10) 176*±3.8 (21) 14-17 (n) 176±9.5 (9) 166±5.3 (22) 174±3.4 (24) 177±5.5 (22) 169±7.3 (10) 190*±4.0 (22) 17-21 (n) 193±9.2 (9) 202±6.7 (21) 205±3.5 (24) 198±6.8 (22) 176±10.2 (10) 205**±3.7 (22) 21-22 (n) 204±19.5 (7) 215±8.5 (19) 232±4.7 (23) 231±8.9 (21) 190±11.2 (10) 225**±6.5 (22) 1-22 (n) 157±8.1 (8) 155±4.0 (20) 163±2.3 (23) 162±4.6 (22) 153±5.4 (10) 169*±3.2 (21) aMean ± S.E.M. bn = 22.
*Treatment group statistically different from same-vehicle-control (p<0.05). **Treatment group statistically different from same-vehicle-control (p<0.01).
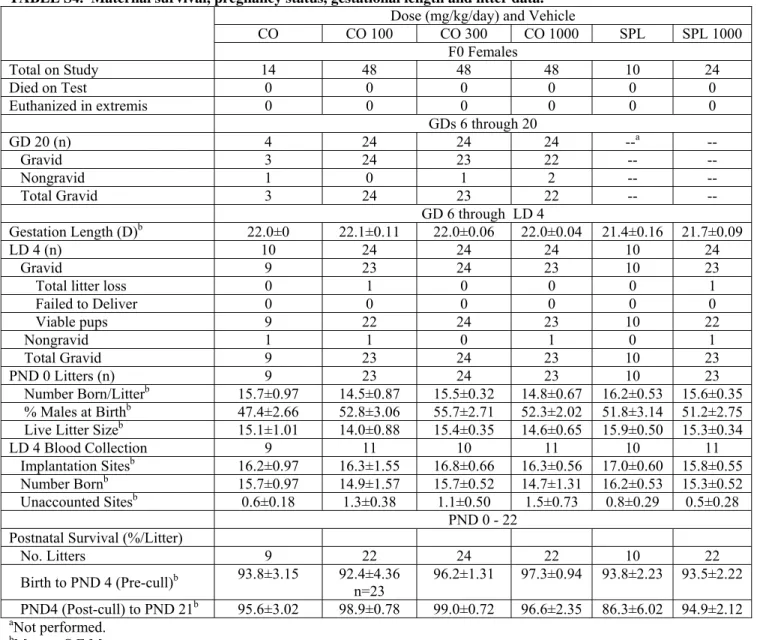
TABLE S4. Maternal survival, pregnancy status, gestational length and litter data.
Dose (mg/kg/day) and Vehicle
CO CO 100 CO 300 CO 1000 SPL SPL 1000 F0 Females Total on Study 14 48 48 48 10 24 Died on Test 0 0 0 0 0 0 Euthanized in extremis 0 0 0 0 0 0 GDs 6 through 20 GD 20 (n) 4 24 24 24 --a -- Gravid 3 24 23 22 -- -- Nongravid 1 0 1 2 -- -- Total Gravid 3 24 23 22 -- -- GD 6 through LD 4 Gestation Length (D)b 22.0±0 22.1±0.11 22.0±0.06 22.0±0.04 21.4±0.16 21.7±0.09 LD 4 (n) 10 24 24 24 10 24 Gravid 9 23 24 23 10 23
Total litter loss 0 1 0 0 0 1
Failed to Deliver 0 0 0 0 0 0 Viable pups 9 22 24 23 10 22 Nongravid 1 1 0 1 0 1 Total Gravid 9 23 24 23 10 23 PND 0 Litters (n) 9 23 24 23 10 23 Number Born/Litterb 15.7±0.97 14.5±0.87 15.5±0.32 14.8±0.67 16.2±0.53 15.6±0.35 % Males at Birthb 47.4±2.66 52.8±3.06 55.7±2.71 52.3±2.02 51.8±3.14 51.2±2.75
Live Litter Sizeb 15.1±1.01 14.0±0.88 15.4±0.35 14.6±0.65 15.9±0.50 15.3±0.34
LD 4 Blood Collection 9 11 10 11 10 11
Implantation Sitesb 16.2±0.97 16.3±1.55 16.8±0.66 16.3±0.56 17.0±0.60 15.8±0.55
Number Bornb 15.7±0.97 14.9±1.57 15.7±0.52 14.7±1.31 16.2±0.53 15.3±0.52
Unaccounted Sitesb 0.6±0.18 1.3±0.38 1.1±0.50 1.5±0.73 0.8±0.29 0.5±0.28
PND 0 - 22 Postnatal Survival (%/Litter)
No. Litters 9 22 24 22 10 22 Birth to PND 4 (Pre-cull)b 93.8±3.15 92.4±4.36 n=23 96.2±1.31 97.3±0.94 93.8±2.23 93.5±2.22 PND4 (Post-cull) to PND 21b 95.6±3.02 98.9±0.78 99.0±0.72 96.6±2.35 86.3±6.02 94.9±2.12 aNot performed. bMean ± S.E.M.
TABLE S5. F1 pup body weight gain (g) from postnatal days (PND) 0 through 22. F1 pups derived from F0 females
administered DecaBDE at doses of 100 to 1000 mg/kg/day in corn oil (CO) or 1000 mg/kg/day in soyaphospholipon:Lutrol® F127 (16:34 w/w)/mL water (SPL) from GD 6 through LD 22.
Maternal Dose (mg/kg/day) and Vehicle
PND CO (n=9)a CO 100 (n=22) CO 300 (n=24) CO 1000 (n=23) (n=10) SPL SPL 1000 (n=22) F1 Males 1-4 2.7±0.28b 2.9±0.12 2.6±0.12 2.5±0.16 1.4±0.22 1.8±0.13 4-7 6.7±0.44 6.4±0.19 6.2±0.19 6.1±0.26 3.5±0.54 4.7*±0.27 7-11 9.7±0.48 9.7±0.36 9.5±0.27 9.6±0.31 7.6±0.69 8.4±0.33 11-14 7.0±0.31 6.8±0.29 6.2±0.20 6.0±0.31 6.7±0.36 7.3±0.29 14-17 7.6±0.45 6.1*±0.32 6.2*±0.27 7.1±0.34 7.1±0.43 6.7±0.21 17-21 10.5±0.68 11.3±0.50 10.7±0.24 9.3±0.63 9.1±0.76 11.2**±0.29 F1 Females 1-4 2.5±0.30 2.6±0.14 2.5±0.10 2.3±0.15 1.3±0.19 1.6±0.12 4-7 6.3±0.41 6.2±0.15 5.9±0.21 5.9±0.23 3.1±0.44 4.3**±0.22 7-11 9.6±0.59 9.3±0.37 9.1±0.31 9.5±0.28 7.0±0.65 8.0±0.31 11-14 6.5±0.54 7.0±0.27 5.9±0.26 6.2±0.32 6.5±0.44 7.1±0.31 14-17 6.9±0.24 6.1±0.33 6.1±0.26 6.7±0.27 7.3±0.58 6.7±0.28 17-21 10.2±0.68 10.9±0.47 10.2±0.32 9.6±051 8.0±0.89 10.3**±0.30 aLitters. bMean ± S.E.M.
*Treatment group statistically different from same-vehicle-control (p<0.05). **Treatment group statistically different from same-vehicle-control (p<0.01).
TABLE S6. DecaBDE plasma concentrations on GD 20. DecaBDE administered to F0 females from
GDs 6 through 20 with corn oil (CO) as the vehicle.
Plasma [DecaBDE (ng/mL)]a
Hour Post Dosing Dose (mg/kg/day) 0 0.5 1 2 4 8 F0 Dams, GD 20b CO -- -- <LOQc -- -- -- CO 100 1175 ± 335 832 ± 591 1237 ± 284 2084 ± 778 2011 ± 440 2299 ± 759 CO 300 1563 ± 584 1147 ± 378 1430 ± 206 1713 ± 521 1885 ± 152 1518 ± 299 CO 1000 1635 ± 557 949 ± 202 1337 ± 178 1450 ± 252 1666 ± 740 1457 ± 394 Fetuses, GD 20b CO -- -- <LOQ106 (n=1) (n=2); -- -- -- CO 100 581 ± 87 839 ± 346 476 ± 145 436 ± 33 500 ± 66 505 ± 80 CO 300 448 ± 56 450 ± 148 469 ± 116 408 ± 82 462 ± 79 343 ± 47 (n=3) CO 1000 260 ± 45 (n=3) 380 ± 71 (n=3) 325 ± 118 426 ± 51 324 ± 90 412 ± 57 an = 4 F
0 females and their fetuses/group/time point, except where noted. bMean ± standard deviation.
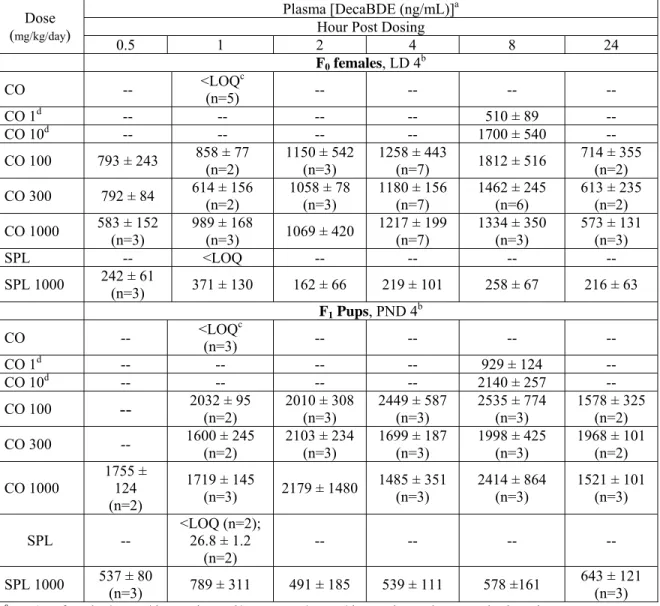
TABLE S7. DecaBDE plasma concentrations on LD 4 (F0 females) and PND 4 (F1 Pups). DecaBDE
administered to F0 females from GD 6 through LD 4 with corn oil (CO) or
soyaphospholipon:Lutrol® F127 (16:34 w/w)/water (SPL) as the vehicle.
Plasma [DecaBDE (ng/mL)]a
Hour Post Dosing Dose (mg/kg/day) 0.5 1 2 4 8 24 F0 females, LD 4b CO -- <LOQ(n=5) c -- -- -- -- CO 1d -- -- -- -- 510 ± 89 -- CO 10d -- -- -- -- 1700 ± 540 -- CO 100 793 ± 243 858 ± 77 (n=2) 1150 ± 542 (n=3) 1258 ± 443 (n=7) 1812 ± 516 714 ± 355 (n=2) CO 300 792 ± 84 614 ± 156 (n=2) 1058 ± 78 (n=3) 1180 ± 156 (n=7) 1462 ± 245 (n=6) 613 ± 235 (n=2) CO 1000 583 ± 152 (n=3) 989 ± 168 (n=3) 1069 ± 420 1217 ± 199 (n=7) 1334 ± 350 (n=3) 573 ± 131 (n=3) SPL -- <LOQ -- -- -- -- SPL 1000 242 ± 61 (n=3) 371 ± 130 162 ± 66 219 ± 101 258 ± 67 216 ± 63 F1 Pups, PND 4b CO -- <LOQ(n=3) c -- -- -- -- CO 1d -- -- -- -- 929 ± 124 -- CO 10d -- -- -- -- 2140 ± 257 -- CO 100 -- 2032 ± 95 (n=2) 2010 ± 308 (n=3) 2449 ± 587 (n=3) 2535 ± 774 (n=3) 1578 ± 325 (n=2) CO 300 -- 1600 ± 245 (n=2) 2103 ± 234 (n=3) 1699 ± 187 (n=3) 1998 ± 425 (n=3) 1968 ± 101 (n=2) CO 1000 1755 ± 124 (n=2) 1719 ± 145 (n=3) 2179 ± 1480 1485 ± 351 (n=3) 2414 ± 864 (n=3) 1521 ± 101 (n=3) SPL -- <LOQ (n=2); 26.8 ± 1.2 (n=2) -- -- -- -- SPL 1000 537 ± 80 (n=3) 789 ± 311 491 ± 185 539 ± 111 578 ±161 643 ± 121 (n=3) an = 4 F
0 females/group/time point and/or F1 pups/group/time point, unless noted otherwise. bMean ± standard deviation.
cLOQ=25 ng/mL.
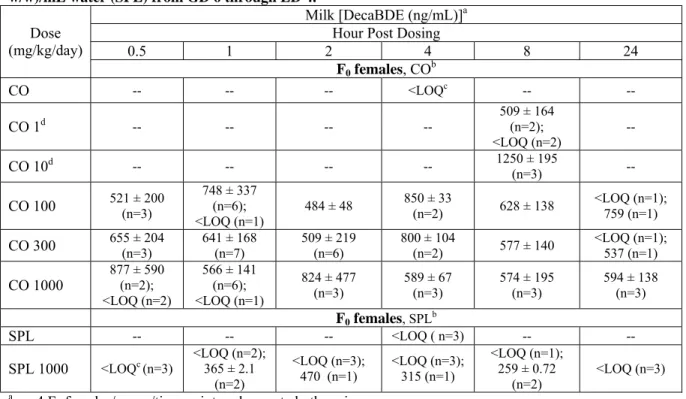
TABLE S8. DecaBDE milk concentrations on LD 4. DecaBDE administered to F0 females at doses of 1
to 1000 mg/kg/day in corn oil (CO) or 1000 mg/kg/day in soyaphospholipon:Lutrol® F127 (16:34 w/w)/mL water (SPL) from GD 6 through LD 4.
Milk [DecaBDE (ng/mL)]a
Hour Post Dosing
0.5 1 2 4 8 24 Dose (mg/kg/day) F0 females, COb CO -- -- -- <LOQc -- -- CO 1d -- -- -- -- 509 ± 164 (n=2); <LOQ (n=2) -- CO 10d -- -- -- -- 1250 ± 195 (n=3) -- CO 100 521 ± 200 (n=3) 748 ± 337 (n=6); <LOQ (n=1) 484 ± 48 850 ± 33 (n=2) 628 ± 138 <LOQ (n=1); 759 (n=1) CO 300 655 ± 204 (n=3) 641 ± 168 (n=7) 509 ± 219 (n=6) 800 ± 104 (n=2) 577 ± 140 <LOQ (n=1); 537 (n=1) CO 1000 877 ± 590 (n=2); <LOQ (n=2) 566 ± 141 (n=6); <LOQ (n=1) 824 ± 477 (n=3) 589 ± 67 (n=3) 574 ± 195 (n=3) 594 ± 138 (n=3) F0 females, SPLb SPL -- -- -- <LOQ ( n=3) -- -- SPL 1000 <LOQc (n=3) <LOQ (n=2); 365 ± 2.1 (n=2) <LOQ (n=3); 470 (n=1) <LOQ (n=3); 315 (n=1) <LOQ (n=1); 259 ± 0.72 (n=2) <LOQ (n=3) an = 4 F
0 females/group/time point, unless noted otherwise.
bMean ± standard deviation.
cLOQ=250 ng/mL.
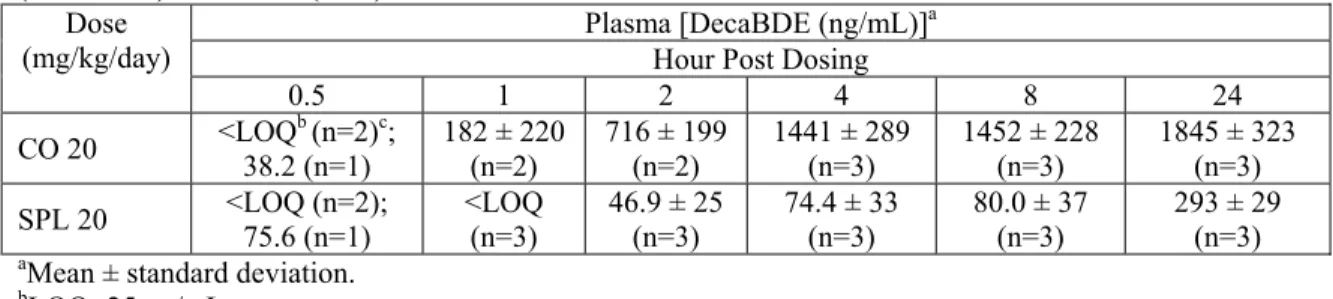
TABLE S9. DecaBDE F1 naïve pup plasma concentrations on postnatal day 4 following a single
direct administration of 20 mg/kg using either corn oil (CO) or soyaphospholipon:Lutrol® F127 (16:34 w/w)/mL water (SPL) as the vehicle.
Plasma [DecaBDE (ng/mL)]a
Hour Post Dosing Dose
(mg/kg/day)
0.5 1 2 4 8 24
CO 20 <LOQ38.2 (n=1) b (n=2)c; 182 ± 220 (n=2) 716 ± 199 (n=2) 1441 ± 289 (n=3) 1452 ± 228 (n=3) 1845 ± 323 (n=3) SPL 20 <LOQ (n=2); 75.6 (n=1) <LOQ (n=3) 46.9 ± 25 (n=3) 74.4 ± 33 (n=3) 80.0 ± 37 (n=3) 293 ± 29 (n=3)
aMean ± standard deviation.
bLOQ=25 ng/mL.