ISSN: 2088-8708, DOI: 10.11591/ijece.v9i4.pp2205-2211 2205
Application of the least square support vector machine for
point-to-point forecasting of the PV power
Mahdi Farhadi, Nader MollayiFaculty of Computer and Industrial Engineering, Birjand University of Technology, Iran
Article Info ABSTRACT
Article history: Received Jun 12, 2018 Revised Nov 11, 2018 Accepted Mar 3, 2019
In today's industrial world, the growing capacity of renewable energy sources is a crucial factor for sustainable power generation. The application of solar photovoltaic (PV) energy sources, as a clean and safe renewable energy resource has found great attention among the consumers in the recent decades. Accurate forecasting of the generated PV power is an important task for scheduling the generators and planning the consumption patterns of customers to save electricity costs. To this end, it is necessary to develop a global model of the generated power based on the effective factors which are mainly the solar radiation intensity and the ambient weather temperature. As a result of the wide numerical range of these parameters and various weather conditions, a large training database must be used for developing the models, which results in high-computational complexity of the algorithms used for training the models. In this paper, a novel algorithm for point to point prediction of the generated power based on the least squares support vector machine (LS-SVM) has been proposed which can handle the large training database with a very fewer deal of computation and benefits from reasonable accuracy and generalization capability.
Keywords:
Forecasting of PV power generation
Least squares support vector machine
Renewable energy sources Solar photovoltaic energy Supervised learning
Copyright © 2019 Institute of Advanced Engineering and Science. All rights reserved. Corresponding Author:
Nader Mollayi,
Faculty of Computer and Industrial Engineering, Birjand University of Technology,
Birjand, South Khorasan Province, Iran. Email: [email protected]
1. INTRODUCTION
Solar photovoltaic (PV) energy sources are increasingly growing and gain more popularity than conventional fossil fuel sources [1]. In the last decades, the manufacturing and installation cost of photovoltaic panels has had a significant reduction and their energy efficiency has been improved [2, 3]. The solar energy is one of the most favorable green energies among renewable energy resources, because it is an inexhaustible, clean, and safe energy source [4]. In spite of its affluence and lower cost, yet the solar energy supplies less than 1% of the world’s energy needs [3, 5]. The dependency of the output power of PV systems on weather conditions and the uncertainty of output power of PV systems are significant challenges that power system operators encounter with [6]. In addition, integrating renewable energy sources (RES) into the existing grid raises several challenges. Renewable energy sources are naturally intermittent, and the weather condition affects the power generation, hence, the stability of the grid. The operation of a power grid involves matching the supply and load. The mismatch between supply and load is considered as grid disturbance. The frequency of the grid is mostly 50Hz or 60Hz. The frequency decreases if load is greater than supply, otherwise it increases. The grid stability requires the frequency to be fixed. When a generator fails, load will be greater than the supply. In this condition, if load couldn’t be matched to the supply, then it may cause failure of the other generators as well.
Accurate forecasting of PV power generation is useful for both the power grid and individual smart homes. The data obtained can be used by the grid to schedule the generators. Also, the smart homes can use it
to plan their consumption patterns in order to save electricity costs [6]. Accurate forecasting of PV power generation is important for system reliability and developing large-scale PV deployments [4]. By increasingly integrating the PV systems into the existing power resources, the reliable and accurate PV system identification would be essential in order to deal with the highly nonlinear change in dynamics and operational characteristics of the PV system [1].
Increased capacity of renewable power sources is a main driving factor for sustainable power generation [7]. In recent years, penetration of such renewable sources, along with their intermittence power generation, has posed challenges to power engineers [8]. The rapid growth of such resources has resulted in some structural changes in power grids [9]. The reliable operation and economic dispatch (distribution) of power generation are usually planned real-time, daily, weekly, monthly, and yearly. Hence, it is important to predict the load profile of power systems and their generation outputs including the conventional centralized power plants and renewable power stations such as photovoltaic (PV) and wind [10].
Power output forecasting of RES is important for grid operators. It helps the grid operators to predict the shortage or surplus time of RES and make necessary decisions. In addition, it is useful for scheduling, energy storage, management and maintenance of the power systems [3]. The prediction error of short-term PV power output is in the range of ∼10-20%. The prediction accuracy is typically lower in the mornings, evenings, or under rainy weather conditions, and under some conditions the relative mean square error (RMSE) can be even higher than 50% [4].
2. LITERATURE REVIEW
The forecasting approaches of PV generation can be classified into three categories including numerical weather forecasting (NWP)-based approach, data-driven statistical approach and hybrid approach [11]. NWP-based forecasting approach has been discussed in [12], which uses the first principles of solar irradiance and PV generation prediction. The second approach includes auto regression (AR)-based models [13] and computational intelligence tools such as artificial neural networks (ANNs) [14, 15]. The third approach is a combination of the two first approaches [16, 17].
Hammer, A. et al. proposed a PV output forecasting method in which the information concerning cloud movement in local area for very short-term horizons in satellite images are used for predicting process. This can improve the forecasting accuracy to some extent [18].
A one-day-ahead PV power output forecasting model is proposed for a single station by Jie Shi et al., which is based on weather forecasting data, actual historical data of power output, and the SVM algorithm. They applied the model into a PV station in China [4, 19]. To predict the output characteristics of a commercial PV module, [14] uses a radial basis function neural network (RBFNN) model. However, considering the need for large training data, both SVM and RBFNN models suffer from the disadvantage of high-computational complexity [6].
Nowadays, thanks to the advances in Meteorology, accurate forecasting of the sun radiation intensity and the ambient weather temperature has become possible. Using a global database of the generated electric energy and these parameters, it is possible to provide a precise prediction of the generated electric energy in various intervals of the day and by summing them an estimation of the daily electric energy can be obtained. To yield a high degree of accuracy, it is necessary to use a large database which covers various weather conditions. As a result of the SVM and RBFNN models' computational complexity, such a database is very large for these models and therefore simpler models should be investigated.
Least squares support vector machines (LS-SVMs) are the extended version of SVMs, proposed by Suykens et al. [20], which benefit from reduced calculations besides higher generalization capability [21]. In this paper, a novel approach for point to point prediction of the generated PV power based on LS-SVMs has been proposed which can provide the necessary forecasting accuracy and does not suffer from the high-computational complexity. The rest of the paper is organized as follows: Section 3 describes the least squares support vector machines and Section 4 presents the results and analysis.
3. LEAST SQUARES SUPPORT VECTOR MACHINES
Support vector machines (SVMs), are supervised learning models which are used for classification and regression analysis. Initial version of support vector machines was an extension of the Generalized Portrait algorithm, which was developed in 1960s. However, the current version was developed by Vapnik and his coworkers at AT&T Bell Laboratories in 1990s [22]. In SVM-based regression, to estimate a function as the one shown in (1) based on a limited set of observations, first the input space is mapped into a high dimensional feature space through a kernel function𝜙(𝑥), next a linear optimal regression is carried out in this space [23].
𝑦 = 𝑓(𝑥) = 𝑤𝑇𝜙(𝑥) + 𝑤
0 (1)
Weight vector w and the bias 𝑤0 are obtained by solving the optimization problem (2) [24]:
min {𝑅(𝑤) =1 2‖𝑤‖ 2+ 𝐶 . ∑ 𝜉 𝑖+ 𝜉𝑖∗ 𝑁 𝑖=1 } s.t. { 𝑦𝑖− (𝑤𝑇𝜙(𝑥𝑖) + 𝑏) ≤ 𝜀 + 𝜉𝑖 (𝑤𝑇𝜙(𝑥 𝑖) + 𝑏) − 𝑦𝑖≤ 𝜀 + 𝜉𝑖∗ 𝜉𝑖و 𝜉𝑖∗≥ 0 , i = 1, … , N (2)
Where C is the regularization factor, 𝜀 is the insensitivity parameter and 𝜉𝑖and 𝜉𝑖∗are slack variables,
calculated based on the Vapnik’s 𝜀-insensitive loss function, like on (3).
𝜉 = |𝑦 − 𝑓(𝑥)|𝜀= 𝑚𝑎𝑥{0, |𝑦 − 𝑓(𝑥)| − 𝜀} (3)
The concept of 𝜀 -insensitivity in SVM-based regression is shown in Figure 1.
Figure1. The illustration of 𝜀 -insensitivity
When using classical SVMs, the optimization problem is solved by quadratic programming optimization. However, this method suffers from high computational load for the constrained optimization programing. Least squares support vector machines (LS-SVM) can deal with this disadvantage, by solving a set of linear equations rather than a quadratic programming problem [25]. When LS-SVMs are used for function estimation, the optimization problem is formulated as minimizing a risk function which is defined such as (4) follows: R(w) =1 2‖w‖ 2 +C 2∑ ei 2 N i=1 (4) Subject to 𝑦𝑖= 〈𝑤, 𝜑(𝑥𝑖)〉 + 𝑏 + 𝑒𝑖, i=1, … , N,
Where ei is the error variable related to the i-th training data, as shown in (5) and C≥0 is the regularization constant. The Lagrangian is
Lα(w, b, e) = 1 2‖w‖ 2 +C 2∑ ei 2 N i=1 − ∑Ni=1αi{〈w, φ(xi)〉 + b + ei− yi}, (5)
Where αi∈R are Lagrange multipliers. Optimal condition is obtained by solving the following set of (5): 𝜕𝐿𝛼(𝑤,𝑏,𝑒) 𝜕𝑤 = 0 → 𝑤 = ∑ 𝛼𝑖𝜑(𝑥𝑖) 𝑁 𝑖=1 (6) 𝜕𝐿𝛼(𝑤,𝑏,𝑒) 𝜕𝑏 = 0 → ∑ 𝛼𝑖= 0 𝑁 𝑖=1
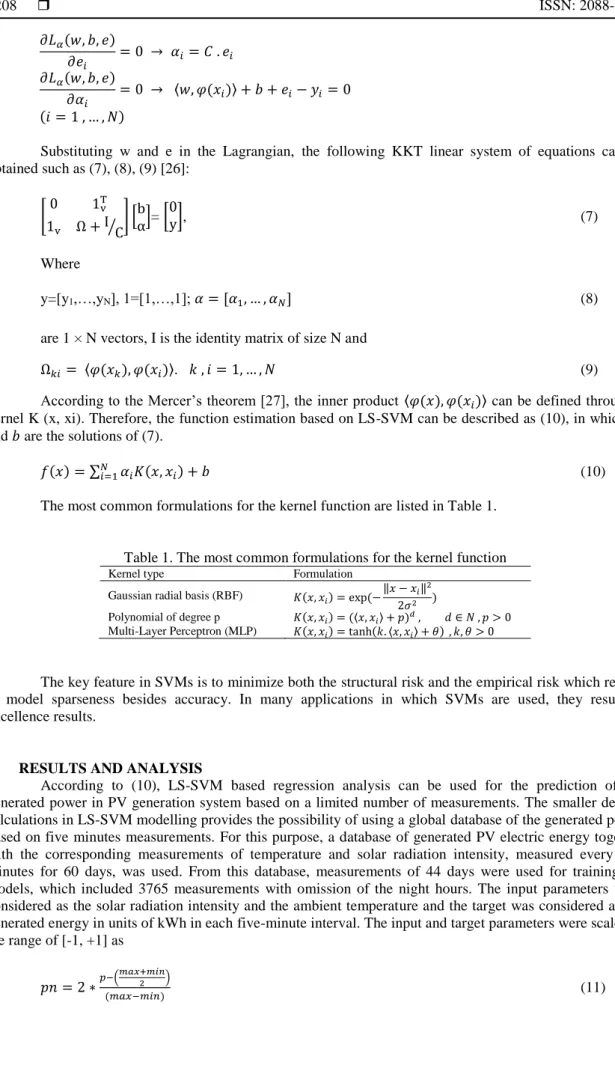
𝜕𝐿𝛼(𝑤, 𝑏, 𝑒) 𝜕𝑒𝑖 = 0 → 𝛼𝑖= 𝐶 . 𝑒𝑖 𝜕𝐿𝛼(𝑤, 𝑏, 𝑒) 𝜕𝛼𝑖 = 0 → 〈𝑤, 𝜑(𝑥𝑖)〉 + 𝑏 + 𝑒𝑖− 𝑦𝑖= 0 (𝑖 = 1 , … , 𝑁)
Substituting w and e in the Lagrangian, the following KKT linear system of equations can be obtained such as (7), (8), (9) [26]: [0 1v T 1v Ω + I C⁄ ] [b α]= [ 0 y], (7) Where y=[y1,…,yN], 1=[1,…,1]; 𝛼 = [𝛼1, … , 𝛼𝑁] (8)
are 1 × N vectors, I is the identity matrix of size N and
Ω𝑘𝑖= 〈𝜑(𝑥𝑘), 𝜑(𝑥𝑖)〉. 𝑘 , 𝑖 = 1, … , 𝑁 (9)
According to the Mercer’s theorem [27], the inner product 〈𝜑(𝑥), 𝜑(𝑥𝑖)〉 can be defined through a
kernel K (x, xi). Therefore, the function estimation based on LS-SVM can be described as (10), in which 𝛼𝑖
and 𝑏 are the solutions of (7).
𝑓(𝑥) = ∑𝑁𝑖=1𝛼𝑖𝐾(𝑥, 𝑥𝑖) + 𝑏 (10)
The most common formulations for the kernel function are listed in Table 1.
Table 1. The most common formulations for the kernel function
Kernel type Formulation
Gaussian radial basis (RBF) 𝐾(𝑥, 𝑥𝑖) = exp (−
‖𝑥 − 𝑥𝑖‖2
2𝜎2 )
Polynomial of degree p 𝐾(𝑥, 𝑥𝑖) = (〈𝑥, 𝑥𝑖〉 + 𝑝)𝑑 , 𝑑 ∈ 𝑁 , 𝑝 > 0
Multi-Layer Perceptron (MLP) 𝐾(𝑥, 𝑥𝑖) = tanh(𝑘. 〈𝑥, 𝑥𝑖〉 + 𝜃) , 𝑘, 𝜃 > 0
The key feature in SVMs is to minimize both the structural risk and the empirical risk which results in model sparseness besides accuracy. In many applications in which SVMs are used, they result in excellence results.
4. RESULTS AND ANALYSIS
According to (10), LS-SVM based regression analysis can be used for the prediction of the generated power in PV generation system based on a limited number of measurements. The smaller deal of calculations in LS-SVM modelling provides the possibility of using a global database of the generated power based on five minutes measurements. For this purpose, a database of generated PV electric energy together with the corresponding measurements of temperature and solar radiation intensity, measured every five minutes for 60 days, was used. From this database, measurements of 44 days were used for training the models, which included 3765 measurements with omission of the night hours. The input parameters were considered as the solar radiation intensity and the ambient temperature and the target was considered as the generated energy in units of kWh in each five-minute interval. The input and target parameters were scaled in the range of [-1, +1] as
𝑝𝑛 = 2 ∗𝑝−(
𝑚𝑎𝑥+𝑚𝑖𝑛
2 )
In which max and min are the maximum and minimum value of the input or the output among the whole dataset, respectively; 𝑝 is the input or output and 𝑝𝑛 is the corresponding normalized value. Using the normalized measurements, LS-SVM models were implemented by the LS-SVM lab toolbox version 1.8 of MATLAB. In this toolbox, a function is provided for tuning the kernel and model parameters [28]. The RBF kernel function was preferred. The values of the regularization parameter (C) and RBF kernel parameter (𝜎2)
are listed in Table 2. The outputs were predicted by the models and were scaled to their original range as
𝑦̂ = 𝑦𝑛∗ (
𝑚𝑎𝑥−𝑚𝑖𝑛 2 ) + (
𝑚𝑎𝑥+𝑚𝑖𝑛
2 ) (12)
In which 𝑦̂ is the predicted output in the original range and 𝑦𝑛 is the normalized output predicted by
the models.
Table 2. TheLS-SVM model and kernel parameters
Parameter Value
RBF Kernel parameter (𝜎2) 0.0289
Regularization factor (C) 4.9119
To evaluate the accuracy of the LS-SVM models, the measurements of the generated power in each five minutes for 16 other days were used. Since the weather temperature is mainly predicted based on its values in the morning, noon, afternoon and at night, a two-term exponential function, defined in (13) was used for modelling the ambient temperature.
𝑇 = 𝐴 𝑒𝐵 𝑡+ 𝐶 𝑒𝐷𝑡 (13)
In (13), T is the ambient temperature in degrees Celsius and t is the time. In case of the solar radiation intensity, the original measurements were used, since this parameter can be obtained based on the satellite images.
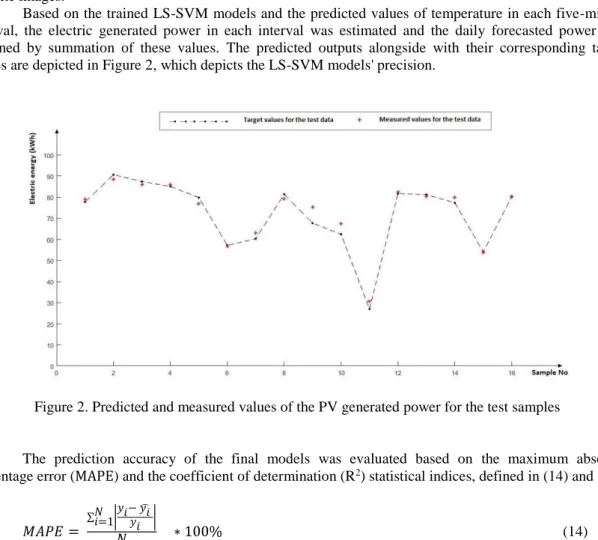
Based on the trained LS-SVM models and the predicted values of temperature in each five-minute interval, the electric generated power in each interval was estimated and the daily forecasted power was obtained by summation of these values. The predicted outputs alongside with their corresponding target values are depicted in Figure 2, which depicts the LS-SVM models' precision.
Figure 2. Predicted and measured values of the PV generated power for the test samples
The prediction accuracy of the final models was evaluated based on the maximum absolute percentage error (MAPE) and the coefficient of determination (R2) statistical indices, defined in (14) and (15).
𝑀𝐴𝑃𝐸 = ∑ |𝑦𝑖− 𝑦𝑖̂ 𝑦𝑖 | 𝑁 𝑖=1 𝑁
∗ 100% (14)
𝑅2= 1 − ∑ ( 𝑦𝑖 − 𝑦̂𝑖 ) 2 𝑁 𝑖=1 ∑𝑁 ( 𝑦𝑖 − 𝑦̅ )2 𝑖=1
(15)
In these (14) and (15), 𝑦𝑖 and 𝑦̂𝑖 are the measured and the predicted outputs, respectively, N is the
number of test samples, 𝑦𝑚𝑎𝑥 and 𝑦𝑚𝑖𝑛 are the maximum and minimum values of the measured outputs and 𝑦̅ is the mean value of the measured output, calculated as (16).
𝑦̅ = ∑ 𝑦𝑖
𝑁 𝑖=1
𝑁 (16)
The calculated values of indices are listed in Table 3. Table 3. Modelling indices
𝑀𝐴𝑃𝐸 𝑅2
3.55% 96.73
5. CONCLUSION
Accurate forecasting of the generated solar photovoltaic power is an important task in electric distribution system. In this paper, a novel point-to-point forecasting methodology has been presented for this purpose, which is based on the least squares support vector machine (LS-SVM). The reduced necessary calculations of the LS-SVM algorithm provided the possibility of using a large training database, corresponding to the wide numerical range of the ambient weather temperature and solar radiation intensity. A two-term exponential function was used to model the ambient temperature and the temperature in each 5-minute interval was obtained. Using the trained LS-SVM models and the predicted values of temperature together with the values of solar radiation intensity, the generated electric energy in each interval was obtained and the forecasted total electric energy was calculated by summation of the obtained values in each day. Error analysis of the results show that the proposed method benefits from a high degree of accuracy and generalization capability, and reduces the computational complexity compared to the previous methods and therefore can be used for accurate forecasting of the generated PV power.
ACKNOWLEDGEMENTS
The present paper is based on the data of a 20 KW solar powerplant and the aerial data located in University of Birjand. The authors are eager to express their deepest gratitude to the Power Engineering Department of the University of Birjand, Birjand, Iran.
REFERENCES
[1] A. Alqahtani, et al., "Photovoltaic power forecasting model based on nonlinear system identification," Canadian Journal of Electrical and Computer Engineering, vol. 39, no. 3, pp. 243-250, 2016.
[2] A. Nawabjan, et al., "A Front Surface Optimization Study for Photovoltaic Application," TELKOMNIKA (Telecommunication, Computing, Electronics and Control), vol. 16, no. 4, pp. 1383-1387, 2018.
[3] T. T. Teo, et al., "Forecasting of photovoltaic power using extreme learning Machine," Innovative Smart Grid Technologies - Asia (ISGT ASIA) Thailand, Nov. 2015.
[4] J. Shi, et al., "Forecasting power output of photovoltaic systems based on weather classification and support vector machines," IEEE Transactions on Industry Applications, vol. 48, no 3, pp.1064-1069, May 2012.
[5] International Energy Agency, Key world energy statistic, International Energy Agency, 2014.
[6] Z. Li, et al., "Day-ahead hourly photovoltaic generation forecasting using extreme learning machine," The 5th Annual IEEE International Conference on Cyber Technology in Automation, Control and Intelligent Systems,
Shenyang, China, June 8-12, 2015.
[7] K. Kawabe and K. Tanaka, "Impact of dynamic behavior of photovoltaic power generation systems on short-term voltage stability," IEEE Transactions on Power Sysems, vol. 30, no. 6, pp. 3416–3424, Nov. 2015.
[8] M. A. Awadallah, et al., "Impact of solar panels on power quality of distribution networks and transformers,"
Canadian Journal of Electrical and Computer Engineering, vol. 38, no. 1, pp. 45–51, 2015.
[9] S. Eftekharnejad, et al., "Optimal generation dispatch with high penetration of photovoltaic generation," IEEE Transaction Sustainable Energy, vol. 6, no. 3, pp. 1013–1020, Jul. 2015.
[10] J. Liu, et al., "An improved photovoltaic power forecasting model with the assistance of aerosol index data," IEEE Transaction on Sustainable Energy, vol. 6, no. 2, pp. 434–442, Apr. 2015.
[11] C. Yang, et al., "Multitime-scale data-driven spatio-temporal forecast of photovoltaic generation," IEEE Transactions on Sustainable Energy, vol. 6, no 1, pp. 104-112, 2015.
[12] L. A. Fernandez-Jimenez, et al., "Short-term power forecasting system for photovoltaic plants," Journal of Renewable Energy, vol 44, pp. 311-317, 2012.
[13] C. Ben Salah, et al., "Wavelet autoregressive forecasting of climatic parameters for photovoltaic systems," The 8th International Multi-Conference on Systems, Signals and Devices (SSD), 2011.
[14] W. Y. Chang, "Power generation forecasting of solar photovoltaic system using radial basis function neural network," Trans Tech Publications Frontiers of Green Building, Materials and Civil Engineering, pp. 1262 -1265, 2013.
[15] M. H. Alomari, et al., "Solar photovoltaic power forecasting in Jordan using artificial neural networks,"
International Journal of Electrical and Computer Engineering, vol 8, no 1, Feb. 2018.
[16] M. G. Kratzenberg and H. G. Beyer, "Solar radiation prediction based on the combination of a numerical weather prediction model and a time series prediction model," The 1st International Congress on Heat Cool Building,
Lisbon, Portugal, 2008.
[17] J. S. Kumari and C. S. Babu, "Mathematical modeling and simulation of photovoltaic cell using matlab-simulink environment," International Journal of Electrical and Computer Engineering, vol 2, no 1, Feb. 2012.
[18] A. Hammer, et al., "Solar energy assessment using remote sensing technologies," Remote Sensing of Environment, pp. 423-432, vol. 86, no. 3, 2003.
[19] S. Jie, et al., "Forecasting power Output of photovoltaic systems based on weather classification and support vector machines," IEEE Transactions on Industry Applications, vol. 48, no 3, pp. 1064-1069, 2012.
[20] J. A. Suykens, T. Van Gestel, J. De Brabanter, "Least squares support vector machines," World Scientific, 2002. [21] T. Van Gestel, et al., "Benchmarking least squares support vector machine classifiers," Machine learning, vol. 54,
no 1, pp. 5-32, 2004.
[22] C. Cortes and V. Vapnik, "Support-vector networks," Machine Learning, vol. 20, no 3, pp. 273, 1995.
[23] G. T. Ngo, et al., "Image retrieval with relevance feedback using SVM active learning," International Journal of Electrical and Computer Engineering, vol. 6, no. 6, pp. 32-38, 2016.
[24] L. Geng, et al., "Forecasting range volatility using support vector machines with improved PSO algorithms,"
Telkomnika (Telecommunication Computing Electronics and Control), vol. 13, no. 3A, pp. 208-216, 2016.
[25] J. A. Suykens, et al., "Sparse approximation using least squares support vector machines," Proceedings of the IEEE International Symposium on Circuits and Systems, vol. 2, pp. 757-760, 2000.
[26] H. Wang and D. Hu, "Comparison of SVM and LS-SVM for regression," IEEE International Conference on Neural Networks and Brain, pp. 279-283, 2005.
[27] N. Cristianini and J. Shawe-Taylor, An introduction to support vector machines and other kernel-based learning methods, Cambridge University Press., 2000.
[28] K. Pelckmans, et al., "LS-SVMlab: a MATLAB/C toolbox for least squares support vector machines," Tutorial. KULeuven-ESAT. Leuven, Belgium, 142, pp. 1-2. 2002.
BIOGRAPHIES OF AUTHORS
Mahdi Farhadi was born in Birjand , Iran , on September 23th,1973. He received the B.Sc. degree
from the Ferdowsi University, Mashhad, Iran, in 1996 and the M.Sc. degree from the K.N. Toosi University, Tehran, Iran, in 2004 both in power engineering. He has been a “distribution network designer and supervisor” at the “Iran Ministry of Energy-Khorasan Electrical Company” from 1997 to 1999. Currently, he is academic staff in the 'Computer and Industrial Engineering Faculty' in
Birjand University of Technology, Birjand, Iran. His current research interests are in the areas of Power System Analysis, Load and Energy Forecasting and Renewable Energies
Nader Mollayi was born in Mashhad, Iran in 1985. He received his B.Sc. degree in electrical
engineering from Shahrood University of Technology, Shahrood, Iran and his M.Sc. degree in power electronics from Sharif University of Technology, Tehran, Iran in 2007 and 2010, respectively. Since September 2010, he has been a lecturer in Birjand University of Technology, Birjand, Iran. His research interests include power electronics, power quality, digital signal processing, pattern recognition and machine learning.